Abstract
Protection against infectious diseases is mediated by the immune system 1,2. T lymphocytes are the master coordinators of the immune system, regulating the activation and responses of multiple immune cells 3,4. T-cell activation is dependent on the recognition of specific antigens displayed by antigen presenting cells (APCs). The T-cell antigen receptor (TCR) is specific to each T-cell clone and determines antigen specificity 5. The binding of the TCR to the antigen induces the phosphorylation of components of the TCR complex. In order to promote T-cell activation, this signal must be transduced from the membrane to the cytoplasm and the nucleus, initiating various crucial responses such as recruitment of signaling proteins to the TCR;APC site (the immune synapse), their molecular activation, cytoskeletal rearrangement, elevation of intracellular calcium concentration, and changes in gene expression 6,7. The correct initiation and termination of activating signals is crucial for appropriate T-cell responses. The activity of signaling proteins is dependent on the formation and termination of protein-protein interactions, post translational modifications such as protein phosphorylation, formation of protein complexes, protein ubiquitylation and the recruitment of proteins to various cellular sites 8. Understanding the inner workings of the T-cell activation process is crucial for both immunological research and clinical applications.
Various assays have been developed in order to investigate protein-protein interactions; however, biochemical assays, such as the widely used co-immunoprecipitation method, do not allow protein location to be discerned, thus precluding the observation of valuable insights into the dynamics of cellular mechanisms. Additionally, these bulk assays usually combine proteins from many different cells that might be at different stages of the investigated cellular process. This can have a detrimental effect on temporal resolution. The use of real-time imaging of live cells allows both the spatial tracking of proteins and the ability to temporally distinguish between signaling events, thus shedding light on the dynamics of the process 9,10. We present a method of real-time imaging of signaling-complex formation during T-cell activation. Primary T-cells or T-cell lines, such as Jurkat, are transfected with plasmids encoding for proteins of interest fused to monomeric fluorescent proteins, preventing non-physiological oligomerization 11. Live T cells are dropped over a coverslip pre-coated with T-cell activating antibody 8,9, which binds to the CD3/TCR complex, inducing T-cell activation while overcoming the need for specific activating antigens. Activated cells are constantly imaged with the use of confocal microscopy. Imaging data are analyzed to yield quantitative results, such as the colocalization coefficient of the signaling proteins.
Keywords: Immunology, Issue 76, Cellular Biology, Molecular Biology, Medicine, T-cell activation, Live-cell imaging, Signal transduction, Confocal microscopy, Signaling complex, Co-localization analysis, fluorescence, cell biology, T-cell, cell, imaging
Protocol
1. T-cell Transfection
Prepare the activated Amaxa Nucleofector solution by mixing the kit's "Supplement" solution to the Nucleofector Solution. The activated solution may be stored at 4 °C for up to three months.
Grow Jurkat T cells in culture medium [10% fetal calf serum (FCS), 1% Penicillin-Streptomycin solution, and 2 mM L-glutamine in RPMI]. Optimally, cells should be used 1-2 weeks after thawing. Using cell cultures in logarithmic growth is crucial for high transfection efficiency and cell survival. Alternatively, with minor modifications, this protocol can be used with primary T cells, as previously described 8. It should be emphasized that as the duration of the activation process of primary T cells is longer than that of Jurkat T cells (~30 min), a microscope stage mounted incubation system must be used to maintain CO2, humidity levels and temperature throughout the activation process.
Collect 5 × 10⁶ log-phase T cells per transfection into a 15-ml tube.
Centrifuge cells for 7 min at 400 × g at room temperature.
During centrifugation, prepare a 6-well plate. Fill one well for each transfection with 5 ml culture medium, and pre-incubate at 37 °C.
Collect the tubes from the centrifuge and discard the supernatant. Resuspend the cell pellet in 1 ml RPMI.
Centrifuge cells for 7 min at 400 × g at room temperature.
During centrifugation, prepare the transfection solution. In one well of a 96-well plate, mix activated 100 μl Amaxa Nucleofector solution prepared in step 1 with 5 μg DNA of the plasmid of interest encoding a fluorescently tagged protein. Optimally, DNA concentration should be greater than 1 μg/ml in order to avoid diluting the transfection solution.
Mix well by gentle pipetting.
After centrifugation of the cells, carefully remove all the supernatant while not disturbing the pellet.
Pipette the DNA/transfection solution twice.
Add the DNA/transfection solution to the pellet.
Transfer the cells to the Amaxa cuvette.
Insert the cuvette into the Amaxa Nucleofector device.
Use the H-10 Amaxa transfection setting for electroporation (for Jurkat ) or T-23 (for primary T cells).
Remove the 6-well plate from the incubator.
Following electroporation, carefully transfer the supernatant with the cell suspension to the 6-well plate using a Pasteur pipette. A pellet consisting of cell debris may form. Avoid transferring the pellet.
Incubate the cells for 24 hr at 37 °C.
Transfer 2.5 ml of cell suspension from each well into a new well. Add 2.5 ml warm culture medium (described in step 2) to each well.
After 72 hr, transfer the cells to a sterile tube and centrifuge for 7 min at 400 × g at room temperature. Discard the supernatant and replace it with culture medium supplemented with the mammalian cell selection antibiotic appropriate for the plasmid used (apply a concentration suitable for the antibiotics used; we used G418 and/or Hygromycin in concentrations of 1.3 mg/ml and/or 0.2 mg/ml, respectively). Culture the cell suspension in a fresh well. Alternatively, cells can be transfected transiently and imaged 48 hr after transfection. To prepare transiently transfected cells, co-transfect the cells with the two plasmids simultaneously at step 8, continuing normally to step 20, and then skip directly to step 23. Note that under this scenario, the cells should be used immediately, and generally their fluorescence intensity is heterogeneous and not necessarily high.
Grow cells with culture medium supplemented with the appropriate selection antibiotic. Split the cells and supplement them with antibiotic-supplemented culture medium as needed.
After 2 weeks, verify successful transfection with the use of FACS (fluorescence-activated cell sorting) as follows:
Collect 106 transfected cells, 106 mock transfected cells (negative control), and 106 cells that are known to stably express the fluorescently tagged protein. If cells are transfected with more than one fluorescent protein (see step 27), use multiple, singly tagged cell lines as positive controls.
Centrifuge cells for 7 min at 400 × g at room temperature.
Discard the supernatant. Resuspend cells in 500 μl FACS buffer (PBS w/o Ca2+ and Mg2+, 5% FCS, 0.05% sodium azide).
Use an analytical FACS to verify cellular fluorescence. Compare fluorescence of the transfected cells to that of the negative and positive controls.
To transfect the cells with an additional, fluorescently tagged protein, repeat steps 3-26 using the transfected cells.
Cells displaying high levels of fluorescence should be used. Optimally, at least 50% of the cells in the culture should be highly fluorescent. Cell fluorescence may be increased by cell sorting via FACS.
Any additional tagged proteins must be fused to different fluorophores and be encoded on plasmids encoding for different selection antibiotics. Selection medium for cells transfected with more than one plasmid should be supplemented with all the appropriate antibiotics.
2. T-cell Spreading Assay Preparation
Use Lab-Tek II German coverglass system 4 chamber slides. Make sure not to accidently scratch the inner surface of the chambers, e.g. with a pipette tip, during preparation or use.
Prepare 50-ml slide preparation solution: Take 4.6 ml of 12 M (37%) HCl, add 38.5 ml 100% ethanol, and 6.9 ml doubly distilled water.
Fill each chamber of the slide with 500 μl slide preparation solution.
Incubate at room temperature for 10 min.
Aspirate the chambers, drying them completely.
Incubate the uncovered slides for 1 hr at 45 °C till fully dry.
Prepare 0.01% poly-L-lysine solution by diluting 0.1% poly-L-lysine (Sigma-Aldrich) in double distilled water.
Apply 500 μl to each chamber.
Incubate the slide for 15 min at room temperature.
Aspirate the chambers, drying them completely.
Incubate for 3 hr at 45 °C till fully dry.
Coated slides can be stored dry for several months at room temperature.
Prepare an activating antibody solution. Use an anti-CD3 antibody: either HIT3a (BD Pharmingen, #555337) or UCHT1 (BD Pharmingen, #555330), 10 μg/ml in 400 μl PBS, per chamber. This solution should be prepared shortly before slide preparation.
Fill each chamber with 400 μl of the activating antibody solution.
Incubate the slide for 2 hr at 37 °C or, preferably, overnight at 4 °C.
Remove the activating antibody solution and immediately wash the chamber twice with 300 μl PBS. From this point, make sure the chambers remain filled with buffer.
Store the PBS-filled slide at 4 °C. We suggest using the prepared slide chambers within 1 week.
3. T-cell Activation and Imaging
Prepare imaging buffer [1.25 ml HEPES (1 M), 10 ml FCS, 38.75 ml RPMI without phenol red]. Imaging buffer can be stored at 4 °C after filtration.
Activate the Zeiss LSM 510 Meta microscope. Warm the microscope heatable mounting frame to 37 °C. Select "Expert mode".
Click the "Acquire" tab and open the following tabs: Lasers; Microscopy; Configuration; Scan; Time Series.
Activate the needed lasers. For excitation of mCFP and mYFP, set the Argon/2 laser to "standby" for 5 min, then to "on".
If you have performed this live-cell imaging assay before, using the same fluorophores, open the resulting LSM file, click the "reuse" icon, and continue from step 9. Otherwise continue from step 6.
Define channels using filters appropriate for the excitation and emission of the fluorescent proteins used.
In the "Scan control" window, select the Z stack option.
Enter the following scan parameters: Number of slices: 5; Interval: 0.5 μm; Current slice: 3.
Prepare an Accublock Digital Dry Bath (Labnet) at 37 °C near the microscope.
Warm the imaging buffer to 37 °C.
Prepare the stored slide by aspirating the PBS, replacing it with 600 μl of warm imaging buffer.
Incubate the slide at 37 °C. Keep the slide in the incubator until step 13, for at least 15 min.
Collect 5 × 10⁵ transfected T cells.
Centrifuge cells for 2 min at 400 × g.
Discard the supernatant.
Resuspend cells in 1 ml warm imaging buffer, and transfer them to a 1.5-ml Eppendorf tube.
Place the test tube on the Accublock Digital Dry Bath.
Take the warmed slide from the incubator, and mount it on the warmed microscope mounting frame.
Click the "VIS" icon.
Mix the cell suspension and remove 1-2 μl.
Insert the tip of the pipette into the imaging buffer above the bottom of the slide. Avoid scratching the slide.
Seed the cells over the objective's aperture.
Immediately begin visually tracking the fluorescent cells as they descend. Select a cell that displays high fluorescence in both channels.
Before the cell reaches the surface of the slide, activate the LSM mode.
Toggle only one excitation laser. Select a laser for which you have a DIC channel.
Set Zoom to 1. Click the "Fast XY" icon. Click the "Stop" icon. Using the Crop tool, select an ROI centered on the cell.
Set Zoom to 3. Click the "Fast XY" icon, then manually set the focus to optimally view the cell. Click the "Stop" icon.
Toggle all the needed excitation lasers.
Begin recording by clicking the "StartT" icon. Image the cell for the entirety of the spreading process (commonly 5 min). When finished, click the "Stop" icon.
Save the file.
To acquire additional cells, click the "VIS" icon. If there are cells that did not yet come into contact with the slide's bottom, continue from step 23. Avoid imaging cells that have already begun the spreading process. Otherwise proceed to step 32.
If the observed slide area is mostly devoid of cells, add another aliquot of cells (continue from step 20). Otherwise proceed to step 33.
To acquire additional cells, move the slide so that the area above the objective's aperture is devoid of cells.
Add another aliquot of cells (and continue from step 20).
After performing all the desired imaging, open a saved LSM file.
Click "Gallery", "Time+Z" and "Subset".
Select the relevant time range and Z stack.
Save the new file.
Perform steps 35-38 for all the imaging files.
4. Imaging Data Analysis
Open the LSM files using Imaris software (Bitplane AG, Zurich Switzerland).
Click "Surpass". Click the "Image Processing" menu, and select "Swap Time and Z". This will assist in the correct cropping of the image.
Click the "Edit" tool bar and select the "Crop 3D" option in the drop menu. Crop the image to include only the area surrounding the cell. We suggest cropping a 300 × 300 pixel square centered on the cell. Note that the shape and location of the cell can change over time. Observing the t axis, make sure that the cell is within the cropped region at all time points.
Click the "Image Processing" menu, and select "Swap Time and Z" to restore the original temporal separation of the image.
Press the "Coloc" button on the main tool bar. Select "Build Time Dep. Coloc". Imaris will automatically calculate intensity thresholds for each channel at each time point.
View the results of the colocalization analysis by selecting "Channel Statistics". Export the data by clicking "Export".
Repeat steps 1 to 6 for each imaged cell. We recommend that at least 50 cells be analyzed in this manner.
Calculate the mean Pearson's colocalization coefficient and its standard error or deviation.
Representative Results
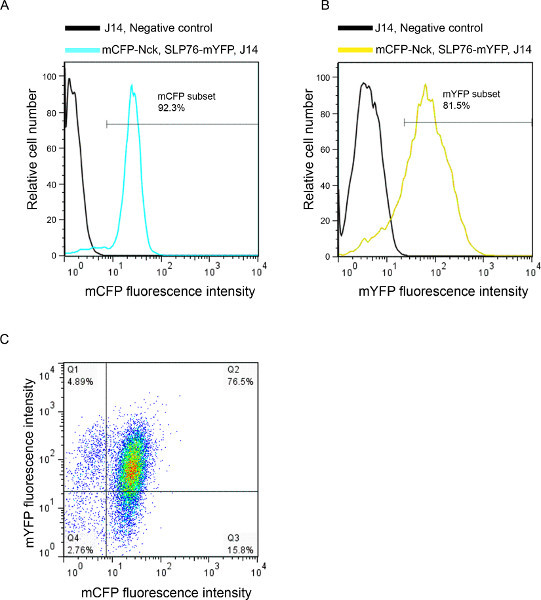
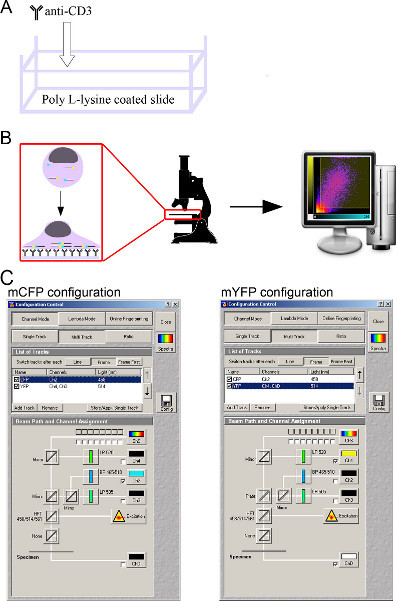
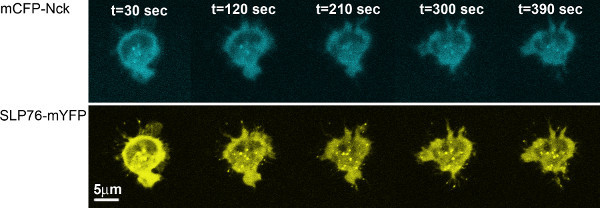
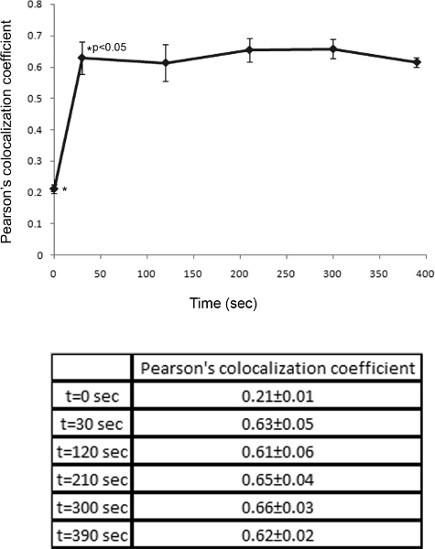
We present an example of live T-cell imaging and analysis. Prior to the imaging experiment, SLP76 deficient T cells (J14) were analyzed with the use of FACS to determine the expression of the fluorescent proteins (Figure 1). T cells transfected with the tagged signaling proteins mCFP-Nck and SLP76-mYFP were deposited over activating slides and imaged during T-cell spreading (Figure 2). Collected images show the dynamics of protein localization throughout activation and spreading (Figure 3). Computerized image processing provides new insights and quantitative information from the visualized cells, while minimizing human bias. To examine the colocalization of the two proteins throughout the cellular activation process, we utilized the colocalization tool of the Imaris software (Bitplane AG, Zurich Switzerland). By comparing the colocalization coefficients between different time points across imaged cells, we were able to ascertain that the colocalization of Nck and SLP76 does not change significantly throughout T-cell activation (p > 0.3) (Figure 4).
 Figure 1. FACS analysis of cells double transfected with fluorescently-labeled proteins. Data are shown as fluorescence intensity histograms for (A) mCFP; (B) mYFP; and (C) as a dot plot. Fluorescence intensity of J14 cells transfected with mCFP-Nck and SLP76-mYFP are represented in cyan and yellow, respectively. Untransfected J14 negative control cells are indicated by black lines.
 Figure 2. A schematic representation of the live T-cell spreading assay.(A) The preparation of T-cell activating slides; (B) live T-cell spreading assay and analysis; (C) microscopy setup. Click here to view larger figure.
 Figure 3. Distribution of Nck and SLP76 during the T-cell activation process. Cells expressing mCFP-Nck and SLP76-mYFP were dropped over anti-CD3 stimulatory antibody pre-coated coverslips and constantly imaged for a period of 7 min. mCFP-Nck is represented by cyan, while SLP76-mYFP is shown in yellow.
 Figure 4. Quantitative analysis of protein colocalization. Image processing of cells was performed using the Imaris software (Bitplane AG, Zurich Switzerland). Colocalization is calculated as Pearson's correlation coefficient between the intensities of the mCFP channel and the mYFP channel for each pixel. Pearson's colocalization coefficients calculated from different time points are compared. Thirty seconds into the activation process, the colocalization coefficient of mCFP-Nck and SLP76-mYFP was increased significantly (p<0.05). These results were calculated by analyzing >50 independent cells. Mean ± standard error are shown.
Discussion
The regulation and function of multiple cellular processes depend on the formation and termination of protein-protein interactions. Microscopic imaging allows the real-time tracking of fluorescently tagged proteins in living cells. Colocalization of tagged proteins can suggest a direct or indirect interaction between the proteins, and can be used to reinforce findings obtained by biochemical methods, such as immunoprecipitation. Unlike biochemical methods, live-cell imaging allows these inter-protein interactions to be observed spatially and over time, facilitating the monitoring of physiological processes as they occur and the detection of the cellular distribution of proteins. Various tools for the quantitative analysis of colocalization have been developed; Pearson's correlation coefficient remains a very attractive and widely available method for quantification of the degree of colocalization between two proteins 12. While fluorescence resonance energy transfer (FRET) experiments enable the detection of inter-protein interactions characterized by close proximity (10 nm), this method requires specialized settings (equipment and compatibility of fluorescent taggings used) and complex data processing. For most uses, colocalization analysis, in conjugation with biochemical methods, constitutes an easy-to-use and straightforward method for observing protein-protein interactions over time.
Establishing a fluorescence-intensity threshold for analyzed pixels, while ignoring pixels below the intensity threshold for either channel, is of critical importance for accurate and sensitive colocalization analysis. The commonly used algorithm for the objective and automated determination of these thresholds was developed by Costes et al. 13 and is implemented by image processing programs such as Imaris and Volocity.
Here, we demonstrate the use of the live T-cell imaging method for analyzing the dynamics of SLP76, a key scaffold in T cells, and Nck, an adaptor protein, both of which are essential for T-cell activation 14,15. Images of T cells collected during activation suggest that the two proteins are colocalized throughout the cellular activation process (Figure 3). This is quantitatively corroborated by performing the Pearson's colocalization test on images collected throughout the activation process. The Pearson's colocalization coefficients range from -1 to 1, where a score of -1 means anti-correlation, a score of 1 signifies perfect colocalization and 0 means no correlation between the two image channels. Comparison of Pearson's colocalization coefficients calculated for different time points and for different cells indicates that colocalization of Nck and SLP76 does not significantly change during cellular activation, but remains constant (p> 0.3, Figure 4). While the overall colocalization coefficient of these proteins does not change throughout the activation process, it does not eliminate the possibility of a dynamic process of association and disassociation occurring between these proteins 18.
The protocol we presented can also be adapted to other hematopoietic cell lines by adjusting cell-growth conditions as required, selecting a transfection setting suitable for the cell line in question and modifying the cellular activation process, if applicable. Please note that while we used the LSM 510 Meta confocal microscope, with the appropriate adjustments and use of settings, other confocal microscopy systems can be successfully used as well.
The use of live T-cell imaging allows the regulatory and activation processes to be directly monitored, enabling signaling events to be explored with temporal and spatial resolution unavailable using biochemical and molecular methods. We present a straightforward method for carrying out a live T-cell spreading assay, monitoring relevant proteins in real-time and analyzing the data to yield quantitative results. Resulting microscopy data can also be used for other downstream applications, such as cell-shape index analysis 16 and FRET analysis 17,18, depending on the specific experimental setup and research objectives.
Disclosures
We have no conflicts of interest to disclose.
Acknowledgments
The authors thank Sophia Fried for technical assistance. MBS thanks the following agencies for their research support: The Israel Science Foundation for grants no.1659/08, 971/08, 1503/08 and 491/10, the Ministries of Health & Science for grants no. 3-4114 and 3-6540, the Israel Cancer Association through the Estate of the late Alexander Smidoda, and the Taubenblatt Family Foundation for the Bio-medicine excellence grant.
References
- Viret C, Janeway CA. MHC and T cell development. Rev. Immunogenet. 1999;1:91–104. [PubMed] [Google Scholar]
- Risso A. Leukocyte antimicrobial peptides: multifunctional effector molecules of innate immunity. J. Leukoc. Biol. 2000;68:785–792. [PubMed] [Google Scholar]
- Doherty PC. Cytotoxic T cell effector and memory function in viral immunity. Curr. Top Microbiol. Immunol. 1996;206:1–14. doi: 10.1007/978-3-642-85208-4_1. [DOI] [PubMed] [Google Scholar]
- Jager D, Jager E, Knuth A. Immune responses to tumour antigens: implications for antigen specific immunotherapy of cancer. J. Clin. Pathol. 2001;54:669–674. doi: 10.1136/jcp.54.9.669. [DOI] [PMC free article] [PubMed] [Google Scholar]
- Davis MM, Bjorkman PJ. T-cell antigen receptor genes and T-cell recognition. Nature. 1988;334:395–402. doi: 10.1038/334395a0. [DOI] [PubMed] [Google Scholar]
- Burkhardt JK, Carrizosa E, Shaffer MH. The actin cytoskeleton in T cell activation. Annu. Rev. Immunol. 2008;26:233–259. doi: 10.1146/annurev.immunol.26.021607.090347. [DOI] [PubMed] [Google Scholar]
- Reicher B, Barda-Saad M. Multiple pathways leading from the T-cell antigen receptor to the actin cytoskeleton network. FEBS Lett. 2010;584:4858–4864. doi: 10.1016/j.febslet.2010.09.002. [DOI] [PubMed] [Google Scholar]
- Barda-Saad M, et al. Dynamic molecular interactions linking the T cell antigen receptor to the actin cytoskeleton. Nat. Immunol. 2005;6:80–89. doi: 10.1038/ni1143. [DOI] [PubMed] [Google Scholar]
- Bunnell SC, Kapoor V, Trible RP, Zhang W, Samelson LE. Dynamic actin polymerization drives T cell receptor-induced spreading: a role for the signal transduction adaptor LAT. Immunity. 2001;14:315–329. doi: 10.1016/s1074-7613(01)00112-1. [DOI] [PubMed] [Google Scholar]
- Balagopalan L, Sherman E, Barr VA, Samelson LE. Imaging techniques for assaying lymphocyte activation in action. Nat. Rev. Immunol. 2011;11:21–33. doi: 10.1038/nri2903. [DOI] [PMC free article] [PubMed] [Google Scholar]
- Zacharias DA, Violin JD, Newton AC, Tsien RY. Partitioning of lipid-modified monomeric GFPs into membrane microdomains of live cells. Science. 2002;296:913–916. doi: 10.1126/science.1068539. [DOI] [PubMed] [Google Scholar]
- Adler J, Parmryd I. Quantifying colocalization by correlation: the Pearson correlation coefficient is superior to the Mander's overlap coefficient. Cytometry A. 2010;77:733–742. doi: 10.1002/cyto.a.20896. [DOI] [PubMed] [Google Scholar]
- Costes SV, et al. Automatic and quantitative measurement of protein-protein colocalization in live cells. Biophys. J. 2004;86:3993–4003. doi: 10.1529/biophysj.103.038422. [DOI] [PMC free article] [PubMed] [Google Scholar]
- Fang N, Motto DG, Ross SE, Koretzky GA. Tyrosines 113, 128, and 145 of SLP-76 are required for optimal augmentation of NFAT promoter activity. J. Immunol. 1996;157:3769–3773. [PubMed] [Google Scholar]
- Wunderlich L, Faragó A, Downward J, Buday L. Association of Nck with tyrosine-phosphorylated SLP-76 in activated T lymphocytes. Eur. J. Immunol. 1999;29:1068–1075. doi: 10.1002/(SICI)1521-4141(199904)29:04<1068::AID-IMMU1068>3.0.CO;2-P. [DOI] [PubMed] [Google Scholar]
- Pauker MH, Reicher B, Fried S, Perl O, Barda-Saad M. Functional cooperation between the proteins Nck and ADAP is fundamental for actin reorganization. Mol. Cell Biol. 2011;31:2653–2666. doi: 10.1128/MCB.01358-10. [DOI] [PMC free article] [PubMed] [Google Scholar]
- Barda-Saad M, et al. Cooperative interactions at the SLP-76 complex are critical for actin polymerization. EMBO J. 2010;29:2315–2328. doi: 10.1038/emboj.2010.133. [DOI] [PMC free article] [PubMed] [Google Scholar]
- Pauker MH, Hassan N, Noy E, Reicher B, Barda-Saad M. Studying the Dynamics of SLP-76, Nck, and Vav1 Multimolecular Complex Formation in Live Human Cells with Triple-Color. 2012;5:rs3. doi: 10.1126/scisignal.2002423. [DOI] [PubMed] [Google Scholar]


