

Introduction
Vertebral fractures are the most common osteoporotic fracture, affecting as many as half of white women and men in their 80s in the United States.1-2 Despite their profound impact on public health, less than one third of individuals with vertebral fractures receive medical attention and even fewer are treated.3 Further, a large number of vertebral fractures go undiagnosed, since many are asymptomatic, and diagnosis requires radiographic assessments. As a result, identifying risk factors for vertebral fracture is particularly challenging compared with fractures at other skeletal sites. Although older age and low bone mineral density are known to increase the risk for vertebral fracture, the strongest predictor of a future vertebral fracture in women and men is an existing vertebral fracture.4-5 Despite the significant morbidity and mortality associated with vertebral fracture, with costs approaching $750 million annually in the U.S., the underlying pathogenesis of vertebral fracture remains elusive.
Prevalence of vertebral fracture is similar in women and men in middle-age years but two to three times greater in women than men in later years.5 Vertebral fractures occur most commonly in the mid-thoracic region (T7-T8) and thoracolumbar junction (T12-L1) in both women and men. Reasons for the bimodal distribution of fractures along the spine are largely unknown. Some have suggested biomechanical factors play a role, however, information on cortical, trabecular and whole bone volumetric BMD (vBMD), geometry, and strength in community-based populations is scarce.6-9 Moreover, there are no population-based studies of variation in vBMD measurements at the thoracic spine as prior studies have been limited to the lumbar region.9-10 Lenchik and colleagues11 evaluated trabecular vBMD in the thoracic and lumbar spine, however, this study predominately included a selective group of individuals with diabetes, limiting the generalizability of their findings.
To address these shortcomings in knowledge about vertebral strength, we used volumetric QCT scans to evaluate vertebral trabecular, cortical, and integral volumetric bone density, geometry, and strength in the thoracic and lumbar spine and determined how these parameters varied with age, sex and spinal location in a community-based population of women and men. Further, we estimated the loads applied to the spine during several activities of daily living and compared these loads to the estimates of vertebral strength at the thoracic and lumbar spine.
Methods
Participants
Participants for the current study are members of the Framingham Heart Study Offspring and Third Generation Multi-detector Computed Tomography (MDCT) Study.12 Members of the Offspring and Third Generation cohorts include second generation (plus spouses) and third generation offspring of the original cohort that was established in 1948.13-15 Computed tomography (CT) scans of the chest and abdomen were acquired in 3,529 participants in the MDCT Study (35 to 90 years, mean 51 years) for assessment of coronary and aortic calcium in 2002-2005.16 Exclusion criteria for the MDCT Study included pregnancy or age less than 40 years for women, age less than 35 years for men, and weight greater than 320 pounds. The current study includes 690 participants (344 women and 346 men) 40-87 years old, selected using sex and 5-year age group stratified random sampling.
Computed Tomography Scan
Volumetric computed tomography scans of the thoracic and lumbar spine were obtained using an 8-slice multidetector computed tomography scanner (Lightspeed Ultra/Plus, General Electric Medical Systems, Milwaukee, WI) operating at tube voltage 120 kVp, tube current 320/400 mA (<220/>220 lb body weight), and gantry rotation of 500 ms. Scans had a nominal in-plane pixel size of 0.68 × 0.68 mm and a slice thickness of 2.5 mm. Effective radiation exposure was 1.0 to 1.25 mSv for 320 and 400 mA, respectively. Two volumetric computed tomography scans were acquired: 1) a thoracic scan that included contiguous slices from the carina of the trachea to the diaphragm (40 to 68 CT slices); and 2) an abdominal scan in which the L5/S1 junction was identified, and 60 contiguous CT slices (150 mm) were acquired superior to this point.12,17 A hydroxyapatite phantom (Image Analysis, Columbia, KY) was placed under each individual and scanned concurrently to allow conversion of Hounsfield units to equivalent concentration of calcium hydroxyapatite (g/cm3).
Since scan acquisition was based on landmarks for cardiac assessments, not all vertebral levels were included in the scans. Typically, the scans included vertebral levels from T6 to T11 and L2 to L5. In more than one-third of participants, however, the scan region did not include vertebral levels T6, T7, T11, and L2. We therefore present results for T8-T10 and L3-L5.
Bone density, cross-sectional area and compressive strength
Vertebral integral and trabecular volumetric bone density (vBMD; g/cm3) and vertebral cross-sectional area (cm2) were determined from the CT scans using previously published algorithms,18-19 modified to assess multiple vertebral levels. Individual vertebrae were identified from reconstructed thoracic and abdominal CT scans, in combination with the lateral scout views.
The volume of interest for integral vBMD included the entire vertebral body (both cortical and trabecular compartments), but excluded the transverse and posterior processes.20 The volume of interest for trabecular vBMD measurements was an elliptical region encompassing the anterior vertebral body, centered at the midvertebral level and encompassing 70% of the volume between vertebral endplates. The volume of interest for cortical vBMD measurements encompassed approximately the outer 1 mm of the peripheral bone of the vertebral body. The average cross-sectional area of the mid-vertebral body (cm2) was calculated from a central 10 mm thick slice.
Vertebral compressive strength (in Newtons, N) was computed as the linear combination of integral vBMD and cross-sectional area, according to beam theory assuming that the vertebral body is loaded in compression.9
Inter- and intra-reader reliability for the QCT-based bone outcomes was determined by having two readers analyze 16 participants (8 men, 8 women) two times each, and computing intraclass correlation coefficients (ICC's). Overall, reproducibility of the QCT analysis methods was good, with inter- and intra-reader ICC's consistently greater than 0.85 for compressive strength, integral vBMD and trabecular vBMD, whereas ICC's for vertebral cross-sectional area were greater than 0.70. ICC's for cortical vBMD were lower and more variable, ranging from 0.57 to 0.95.
Vertebral loading
A quasi-static biomechanical model was used to estimate compressive force on the spine21 was used to estimate compressive force on the vertebral bodies for two different body positions: 1) 90° of forward flexion with arms hanging down and a 10 kg weight in each hand, and 2) twisting combined with forward flexion, each at 30°, with arms hanging down and a 10 kg weight in each hand. The biomechanical model is similar to previously published biomechanical models of the lumbar spine22-24 but also takes into account the mechanical contribution of the ribs and sternum in the thoracic region.21 Briefly, the body was modeled as a series of linked-segments, and the weight, length, and center of mass position of each body segment was estimated using each individual's height and weight together with published anthropometric data.25-29 Trunk muscle morphologies (cross-sectional area and location relative to the vertebral body) were measured from QCT scans in a sample of 100 individuals selected from the current study. These measurements were used to develop regression equations to estimate trunk muscle morphologies for participants in the current study based on the age, sex, height, and weight for each individual.30 Muscle forces required to maintain static equilibrium were determined using a static optimization algorithm.21
Factor of Risk
The factor of risk was computed as the ratio of applied compressive forces to vertebral strength for each activity.9 Theoretically, when the applied force exceeds the bone strength a fracture would occur, thus higher values of the factor of risk indicate greater risk of fracture.
Exclusion of vertebral levels with fracture
Because prevalence of fracture prohibits valid bone density and geometry measurements, vertebrae with fracture grades 1 and higher (n=74), assessed using Genant's semi-quantitative method31 from lateral CT scout images by experienced skeletal radiologists, were excluded.
Statistical Analysis
General linear models were used to evaluate the association between age, sex, and spinal region and each vertebral bone parameter. Because our study involved some correlated data due to familial relations and multiple measures within a person, a generalized estimating equation approach with robust standard errors was employed to adjust for this correlation (Proc GENMOD, SAS Institute Inc., Cary, NC, USA.). The association of age with each bone measure was evaluated for the thoracic region and the lumbar region in women and men, separately. Values for each bone parameter were averaged for T8 to T10 for the thoracic region and averaged for L3 to L5 for the lumbar region.
To examine whether the association between age and each bone measure varied by sex, we tested sex-by-age interaction terms at each vertebral level or region. To evaluate whether the association between age and each bone measure varied by spinal region, we tested region-by-age interaction terms in women and men, separately. We calculated absolute and percent differences in predicted values of each bone measure for individuals 40 years of age compared to those 75 years.
We performed initial analysis without adjustment for covariates, and repeated analysis adjusting for body weight. Because unadjusted results and results adjusted for weight did not differ, we present unadjusted results. In analysis of vertebral cross-sectional area, we adjusted for height in order to account for differences in bone size.
Results
Mean age of participants (N=690; 344 women, 346 men) was 61 years and ranged from 40 to 87 years. The number of vertebral levels (T8-10, L3-L5) included in the analysis was 3,826 (1,918 vertebrae in women and 1,908 vertebrae in men). Body mass index was 28 kg/m2 in women and 29 kg/m2 in men (Table 1). Seven percent of women and 9% of men were current smokers. Among women, 80% were post-menopausal, and 9% used hormone replacement therapy.
Table 1. Characteristics of sex- and age-stratified sample for study of vertebral bone assessment of 690 participants in the Framingham Offspring and Third Generation Multidetector Computed Tomography Study, 2002-2005.
| Women (N=344) | Men (N=346) | |
|---|---|---|
| Age (years) | N (%) or Mean +SD (Range) | N (%) or Mean +SD (Range) |
| 40-44 | 40 (12) | 39 (11) |
| 45-49 | 40 (12) | 40 (12) |
| 50-54 | 39 (11) | 38 (11) |
| 55-59 | 39 (11) | 40 (12) |
| 60-64 | 40 (12) | 44 (13) |
| 65-69 | 40 (12) | 40 (12) |
| 70-74 | 40 (12) | 40 (12) |
| 75+ | 66 (19) | 65 (19) |
| Height (cm) | 161 ± 7 (144-183) | 175 ± 7 (154-196) |
| Weight (kg) | 72 ± 17 (37-138) | 88 ± 14 (52-132) |
| Body mass index (kg/m2) | 28 ± 6 (15-50) | 29 ± 4 (18-45) |
| Current smokers | 25 (7) | 31 (9) |
| Post-menopausal | 275 (80) | - |
| Current hormone replacement therapy | 32 (9) | - |
The decline in integral vBMD with increasing age was twice the magnitude in women than men for the lumbar spine (women, β=-0.0024; men, β=-0.0011; interaction, p<0.01) and more than four times greater in women than men for the thoracic spine (women, β=-0.0017, men, β=-0.0003; interaction, p<0.01; Figure 1A and Table 2). Integral vBMD declined more at the lumbar spine than at the thoracic spine in both women and men (interaction, p<0.01). For example, integral vBMD at the thoracic spine decreased 29% in women from 40 to 75 years of age compared to a 6% decrease in men (Table 2). At the lumbar spine, integral vBMD decreased 36% from 40 to 75 years in women and decreased 18% in men.
Figure 1.
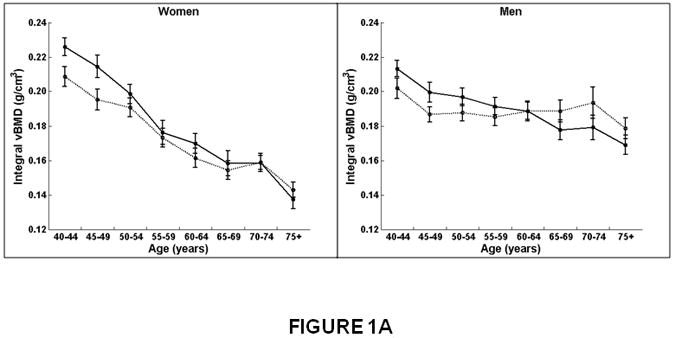
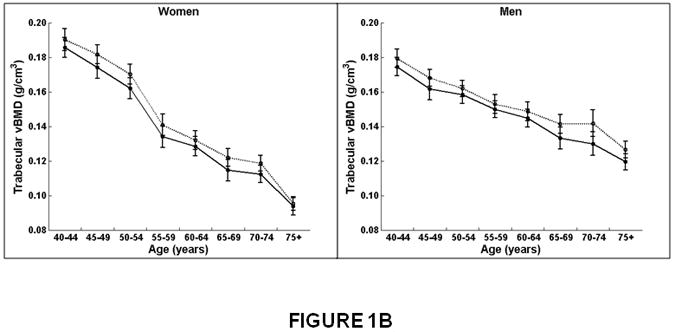
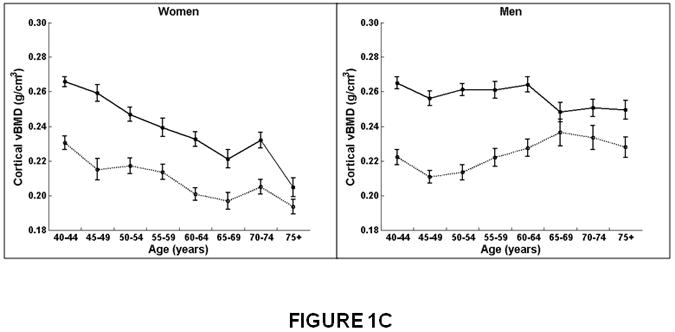
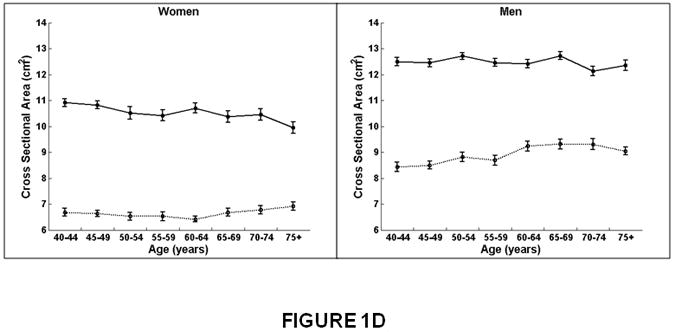
Association between age and integral, trabecular, and cortical vBMD, and cross-sectional area for the thoracic (T8-T10) and lumbar (L3-L5) spine in women and men. Mean values for the thoracic and lumbar spine, averaged for T8-T10 and L3-L5, respectively, are shown. Integral and trabecular vBMD declined with increasing age for the lumbar and thoracic spine in women and men. Cortical vBMD declined with increasing age for the lumbar and thoracic spine in women. In men, cortical vBMD declined with increasing age in the lumbar spine but increased with increasing age in the thoracic spine. Cross-sectional area increased with increasing age in the thoracic spine but did not change with increasing age at the lumbar spine in women and men.
Women on left, men on right.
X-axis, age in years.
Y-axis, QCT bone measures, (A) Integral vBMD, (B) Trabecular vBMD, (C) Cortical vBMD, (D) Cross-Sectional Area. Solid line, values for lumbar spine, averaged for L3-L5 vertebral levels.
Dotted line, values for thoracic spine, averaged for T8-T10 vertebral levels.
Table 2. Association between age and QCT volumetric bone density and geometry by spinal region and sex.
| Women | Men | |||||||||
|---|---|---|---|---|---|---|---|---|---|---|
| QCT bone measure Spinal regiona | β | se | p | Difference from 40 to 75 years of age | β | se | p | Difference from 40 to 75 years of age | ||
| Absolute | Percent | Absolute | Percent | |||||||
| Integral vBMD (g/cm3) | ||||||||||
| Thoracic | -0.0017 | 0.0001 | `0.01 | -0.0609 | -29 | -0.0003 | 0.0002 | 0.06 | -0.0121 | -6 |
| Lumbar | -0.0024 | 0.0002 | <0.01 | -0.0825 | -36 | -0.0011 | 0.0002 | <0.01 | -0.0385 | -18 |
| Trabecular vBMD (g/cm3) | ||||||||||
| Thoracic | -0.0026 | 0.0001 | <0.01 | -0.0913 | -47 | -0.0013 | 0.0002 | <0.01 | -0.0461 | -26 |
| Lumbar | -0.0025 | 0.0002 | <0.01 | -0.0881 | -47 | -0.0014 | 0.0002 | <0.01 | -0.0504 | -29 |
| Cortical vBMD (g/cm3) | ||||||||||
| Thoracic | -0.0009 | 0.0001 | <0.01 | -0.0309 | -14 | 0.0004 | 0.0002 | 0.01 | 0.0153 | +7 |
| Lumbar | -0.0016 | 0.0001 | <0.01 | -0.0550 | -20 | -0.0004 | 0.0001 | <0.01 | -0.0146 | -6 |
| Cross-Sectional Area (cm2)b | ||||||||||
| Thoracic | 0.0220 | 0.0047 | <0.01 | 0.7691 | +12 | 0.0283 | 0.0049 | <0.01 | 0.9895 | +12 |
| Lumbar | 0.0001 | 0.0066 | 0.99 | 0.0040 | 0 | 0.0018 | 0.0052 | 0.72 | 0.0646 | +1 |
β=beta coefficient for age (per year), se=standard error, p=p-value for Ho: β=0, N=Newtons
Values for T8-T10 were averaged for thoracic spine, and values for L3-L5 were averaged for the lumbar spine.
Adjusted for height.
The decline in trabecular vBMD with increasing age was significantly greater in women than men (interaction, p<0.01). For example, trabecular vBMD decreased 47% from 40 to 75 years in women versus a 26-29% decline in men (Table 2). However, trabecular vBMD declined with increasing age similarly for the thoracic and lumbar regions in women (thoracic, β=-0.0026, lumbar β=-0.0025; interaction, p=0.37) and in men (thoracic, β=-0.0013, lumbar, β=-0.0014; interaction, p=0.24; Figure 1B and Table 2).
Similar to integral and trabecular vBMD, cortical vBMD declined with age more in women than men (Figure 1C and Table 2). Between 40 and 75 years of age, cortical vBMD decreased at the thoracic spine 14% in women and increased 7% in men, whereas at the lumbar spine, cortical vBMD decreased 20% in women compared to a 6% decline in men (Table 2). In women, cortical vBMD declined with increasing age more at the lumbar spine (β=-0.0016, p<0.01) than the thoracic region (β=-0.0009, p<0.01; interaction, p<0.01). In men, cortical vBMD at the lumbar spine also declined with increasing age (β=-0.0004, p<0.01) but increased at the thoracic region (β=0.0004, p<0.01; interaction, p<0.01).
In both women and men, mean vertebral cross-sectional area increased with age at the thoracic spine but did not change at the lumbar spine (Figure 1D and Table 2). For example, cross-sectional area increased 12% at the thoracic spine compared to no significant change (0 to 1%) at the lumbar spine.
The decline in vertebral compressive strength with increasing age was twice the magnitude in women (β=-59.4859, p<0.01) than men (β=-30.6220, p<0.01; interaction, p<0.01) for the lumbar spine (Figure 2A and Table 3). At the thoracic spine, vertebral strength also declined significantly with increasing age in women (β=-22.6385, p<0.01), whereas in men, vertebral strength did not change (β=1.9305, p=0.66; interaction, p<0.01). Thus, vertebral compressive strength declined with increasing age more at the lumbar than the thoracic spine for both women and men. From 40 to 75 years of age, for example, compressive strength in men decreased 19% at the lumbar spine compared to no significant change (+2%) at the thoracic region, whereas in women, compressive strength declined on average 41% at the lumbar spine and 28% at the thoracic spine.
Figure 2.
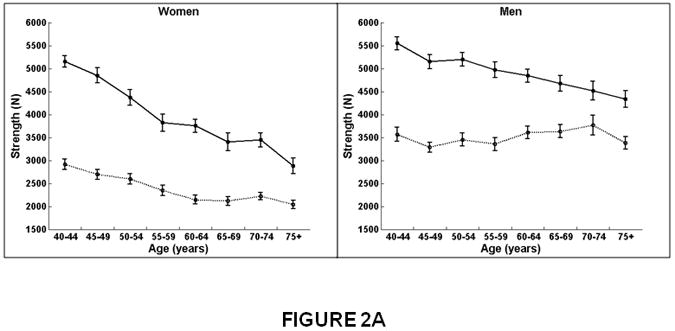
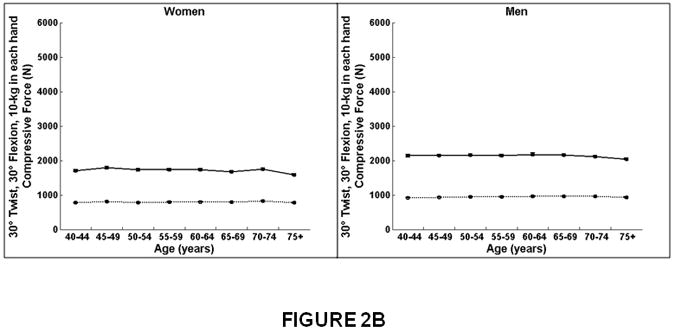
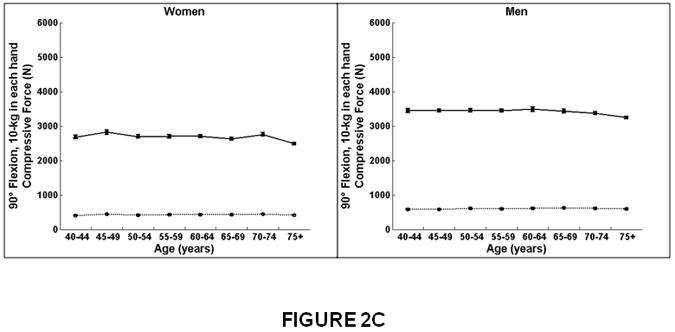
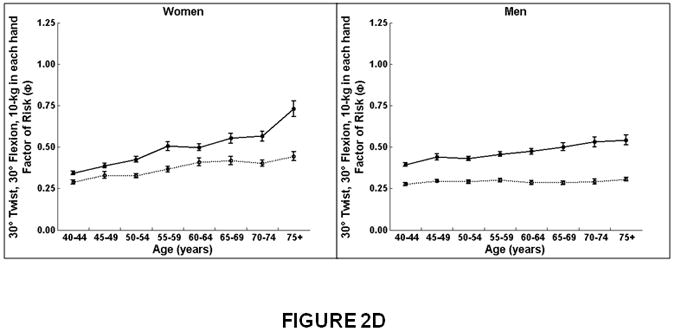
Association between age and compressive strength, compressive force, and factor-of-risk for the thoracic (T8-T10) and lumbar (L3-L5) spine in women and men. Mean values for the thoracic and lumbar spine, averaged for T8-T10 and L3-L5, respectively, are shown. Compressive strength declined with increasing age for the lumbar and thoracic spine in women. In men, compressive strength declined with increasing age for the lumbar spine but did not change with increasing age for the thoracic spine. Compressive force declined with increasing age for the lumbar spine in women and men but did not change with increasing age at the thoracic spine. Factor-of-risk increased with age for the lumbar and thoracic spine in women, whereas the factor-of-risk increased with age only for the lumbar spine and not in the thoracic spine in men.
Women on left, men on right.
X-axis, age in years.
Y-axis, QCT bone measures, (A) Compressive strength (B) Compressive force, twisting and flexion, (C) Compressive force, standing and flexion, (D) Factor-of-risk, twisting and flexion (E) Factor-of-risk, standing and flexion.
Solid line, values for lumbar spine, averaged for L3-L5 vertebral levels.
Dotted line, values for thoracic spine, averaged for T8-T10 vertebral levels.
Table 3. Association between QCT derived biomechanical measures of compressive strength, force, and factor-of-risk by spinal region and sex.
| Women | Men | |||||||||
|---|---|---|---|---|---|---|---|---|---|---|
| QCT bone measure Spinal regiona | β | se | p | Difference from 40 to 75 years of age | β | se | p | Difference from 40 to 75 years of age | ||
| Absolute | Percent | Absolute | Percent | |||||||
| Compressive Strength (N) | ||||||||||
| Thoracic | -22.6385 | 2.9066 | <0.01 | -792 | -28 | 1.9305 | 4.4556 | 0.66 | 67 | +2 |
| Lumbar | -59.4859 | 4.6951 | <0.01 | -2082 | -41 | -30.6220 | 5.1188 | <0.01 | -1071 | -19 |
| Compressive force, Twist (N)b | ||||||||||
| Thoracic | -0.0064 | 0.3039 | 0.98 | -0.22 | 0 | 0.3695 | 0.3357 | 0.27 | 12.93 | +1 |
| Lumbar | -3.4724 | 0.8603 | <0.01 | -121.53 | -7 | -2.4123 | 0.8557 | <0.01 | -84.43 | -4 |
| Compressive force, Stand (N)c | ||||||||||
| Thoracic | 0.2183 | 0.2428 | 0.37 | 7.64 | +2 | 0.5388 | 0.3023 | 0.07 | 18.85 | +3 |
| Lumbar | -5.4697 | 1.4680 | <0.01 | -191.44 | -7 | -4.8800 | 1.4724 | <0.01 | -170.80 | -5 |
| Factor of risk, Twist (N)b | ||||||||||
| Thoracic | 0.0041 | 0.0007 | <0.01 | 0.14 | +49 | 0.0005 | 0.0003 | 0.18 | 0.01 | +6 |
| Lumbar | 0.0100 | 0.0012 | <0.01 | 0.35 | +114 | 0.0040 | 0.0008 | <0.01 | 0.13 | +35 |
| Factor of risk, Stand (N)c | ||||||||||
| Thoracic | 0.0023 | 0.0004 | <0.01 | 0.08 | +54 | 0.0004 | 0.0002 | 0.06 | 0.01 | +8 |
| Lumbar | 0.0157 | 0.0019 | <0.01 | 0.54 | +114 | 0.0064 | 0.0014 | <0.01 | 0.22 | +35 |
β=beta coefficient for age (per year), se=standard error, p=p-value for Ho: β=0, N=Newtons
Values for T8-T10 were averaged for thoracic spine, and values for L3-L5 were averaged for the lumbar spine.
Twisting and flexion, each at 30°, 10 kg weight in each hand.
Standing and flexion at 90°, 10 kg weight in each hand.
At the lumbar spine, compressive force for twisting and flexion (Figure 2B) and for forward flexion (Figure 2C) declined modestly from 40 to 75 years of age similarly for women (7%) and men (4-5%, Table 3). In contrast, at the thoracic spine, compressive force did not change with increasing age in women or men.
The factor-of-risk for twisting and flexion (Figure 2D) and for forward flexion (Figure 2E) increased with age more in women than men (interaction, p<0.01), and more for the lumbar than the thoracic spine (interaction, p<0.01). In men, there was no increase in the factor-of-risk for the thoracic spine (twisting and flexion, β=0.0005, p=0.18; forward flexion, β=0.0004, p=0.06).
Discussion
The current work provides novel information on age-related changes in volumetric bone density and strength in the thoracic spine in comparison to the lumbar spine. Clinical assessment of vertebral bone density by DXA is limited to the lumbar spine due to the overlying sternum and ribs in the thoracic spine. Thus, little is known about the pathophysiology of bone loss at the thoracic spine. Further, incidence of vertebral fracture has a bimodal distribution with peak frequencies occurring at vertebral bodies T7-T8 and T12-L1.32-34 Therefore, full understanding of the etiology of fracture requires characterization of bone strength in vertebrae from the thoracic as well as the lumbar spine.
Our results indicate that in both women and men, bone density and vertebral strength declined with age more in the lumbar than thoracic spine, and cross-sectional area increased less with age in the lumbar than thoracic spine. In particular, bone density and vertebral strength in the thoracic spine appear to be preserved with increasing age in men. We also found marked differences between the lumbar and thoracic spine in age-related patterns of vBMD by bone compartment. Trabecular vBMD declined with age similarly for the lumbar and thoracic regions, whereas cortical vBMD (and integral vBMD) decreased more at the lumbar spine than the thoracic spine. Notably, in men, cortical vBMD at the thoracic spine did not decline but increased with age, and the magnitude of the decline at the lumbar region was small.
These results are consistent with previous work, conducted in a small sample of participants in the current study, which showed that strength of the peripheral vertebral compartment was maintained with age in men, but not women. 35 The mechanism is not clear as to how cortical vBMD would be maintained or even increase with age in men. It is possible that cortical vBMD is influenced by degenerative changes in the spine, such as osteophytes or syndesmophytes, though it is unknown whether these conditions are more common in men than women.
The decline in cortical vBMD with age in the lumbar region is likely due to a combination of cortical thinning as well as an increase in porosity within the cortex. The resolution of the clinical CT scans in the current study does not allow accurate assessment of the thin cortex of the vertebral body, reported to range from 250 – 400 μm,36-37 nor the cortical porosity.
Compressive forces applied to the vertebral body did not decline with increasing age at the thoracic spine, and the decline at the lumbar region was small (7% in women and 4-5% in men). Thus, differences by spinal region in the factor-of-risk are attributable to greater decline with age in vBMD in the lumbar compared to the thoracic spine, rather than a greater increase with age in vertebral load at the lumbar region relative to the thoracic spine.
In addition to evaluating differences by spinal region in age-related changes in QCT derived bone parameters, we also examined differences by sex. We found that integral, trabecular, and cortical vBMD declined with age more in women than men. In contrast, there was no difference between women and men with respect to the association between age and cross-sectional area. Specifically, cross-sectional area increased with age at the thoracic spine and did not change with age at the lumbar spine in women or men. Accordingly, vertebral strength, estimated from integral bone density and cross-sectional area, declined more with age in women than men. In contrast, we found little or no age-related changes in the forces applied to the vertebrae in either women or men. The factor-of-risk, however, increased (i.e., worsened) with age 2 to 8-fold more in women than in men. Thus, the marked increase in the factor-of-risk in women was due to a decline in vertebral strength, rather than an increase in vertebral loading over life. Further, we found that there were sex-specific differences in the pattern of age-related bone loss at the thoracic versus lumbar spine. Whereas women lost bone density and strength at both the thoracic and lumbar spine, in men, vertebral strength declined only at the lumbar spine.
These results are largely consistent with previous findings from the Rochester, MN Epidemiology Project Cohort,6,9 as well as with the well-established increase in the female-to-male ratio of vertebral fractures with aging.32,38-40 Riggs et al.6 found greater age-related declines in integral and trabecular vBMD (cortical vBMD was not assessed) at the lumbar spine in women than men, but no difference in age-related increases in vertebral cross-sectional area between women and men. Whereas we observed similar patterns for bone density, we did not observe an age-related increase in vertebral cross-sectional area at the lumbar spine in women or men.
This is the first study to provide volumetric QCT bone density and morphometry measures for both the thoracic and lumbar spine in a community-based population of women and men. In addition to integral bone density, we evaluated compartment specific measures of vBMD and biomechanical measures of vertebral strength, force, and the factor-of-risk. Our results are representative of patterns expected for the general Caucasian population, rather than limited to clinical patient groups.
This study is limited by the cross-sectional design, and our results may have been affected by secular trends in bone health. However, it is unlikely that secular trends would have differed by sex or spinal region, the main parameters of interest of this study. Nevertheless, investigations to determine age-specific longitudinal changes in vertebral bone density, geometry, and strength are warranted.41
This study is also limited by a lack of information for the thoracolumbar vertebral levels due to exclusion from scan acquisitions. However, values for each bone parameter were averaged for 3 thoracic (T8-T10) and 3 lumbar levels (L3-L5) reducing random measurement error. Further, the association between age and each bone measure was the same for each vertebral level within the thoracic region and within the lumbar region, validating the use of mean values for each spinal region. The study is also limited in its ability to measure the very thin vertebral cortex. Rather the values for cortical vBMD likely represent the peripheral bone, rather than an accurately segmented cortex.
Our findings suggest that deterioration in the spine is greater in the lumbar than the thoracic region and greater in women than men. These results help explain the greater frequency of vertebral fracture in women than men, and also, the high predictive value of lumbar spine bone density for predicting fracture. The relative lack of decline in thoracic vBMD and strength with age in men observed in our study suggests that vertebral fracture would be less frequent in men for the thoracic spine. However, incidence of fracture is highest at the mid-thoracic region (T7-T8) and thoracolumbar junction (T12-L1) for both women and men, although few studies have compared the distribution of fracture along the spine in women and men.5,39,42-43 Misclassification of fracture has been shown to be higher for the thoracic spine than the lumbar spine,31,44-47 in part due to poorer image quality, but also due to degenerative spinal disease or short vertebral height unrelated to osteoporosis.48 Moreover, some studies found that discordance in methods to identify vertebral fracture relates mainly to differential classification of mild deformities in the thoracic spine.48-50 Prospective studies are needed to directly compare the association between bone loss and fracture at the thoracic and lumbar spine in women and men.
In conclusion, decreases in vertebral strength with aging were greater in the lumbar than the thoracic spine and greater in women than men. Both trabecular and cortical vertebral bone declined with increasing age in the thoracic and lumbar spine in women. In men, trabecular bone density also declined with age in both the thoracic and lumbar regions, however, cortical bone loss was restricted to the lumbar spine. Our study confirms the importance of evaluating the determinants of vertebral strength in both the thoracic and lumbar spine and in both women and men to understand the mechanisms underlying structural failure of vertebral bodies with aging.
Acknowledgments
Preliminary results from this study were presented at the 31st Annual Scientific Meetings of the American Society for Bone and Mineral Research in Denver, CO, and an abstract was published (Christiansen, BA, Samelson, EJ, Demissie, S, Valentine, MJ, Manoharan, R, Roberts, BJ, Ming, C-A, Broe, KE, Lang, TF, Kiel, DP, Bouxsein, ML 2009 Men and women exhibit different patterns of age-related bone loss in the thoracic and lumbar vertebrae: The Framingham QCT study. J Bone Miner Res 24 (Suppl 1). Available at http://www.asbmr.org/Meetings/AnnualMeeting/AbstractDetail.aspx?aid=fff24b64-05af-4c4e-aeb3-7b0b28433497. Accessed June 22, 2010.
Funding Sources: This work was supported by NIH R01AR053986, R01AR/AG041398, K01 AR053118, T32 AG023480, and by the National Heart, Lung, and Blood Institute (NHLBI) Framingham Heart Study (NIH/NHLBI Contract N01-HC-25195).
Authors' roles: Study design: ejs, sd, keb, lac, dpk, mlb. Study conduct and data collection: BAC, KEB, BJR, RM, JD, TL. Data analysis: SD, QLG. Data interpretation: EJS, SD, LAC, DPK, MLB. Drafting manuscript: EJS AND BAC.
Footnotes
Disclosures: All authors state that they have no conflicts of interest.
References
- 1.Melton LJd, Lane AW, Cooper C, Eastell R, O'Fallon WM, Riggs BL. Prevalence and incidence of vertebral deformities. Osteoporos Int. 1993;3(3):113–9. doi: 10.1007/BF01623271. [DOI] [PubMed] [Google Scholar]
- 2.Bone Health and Osteoporosis: A Report of the Surgeon General. US Department of Health and Human Services, Office of the Surgeon General; Rockville, MD: 2004. [PubMed] [Google Scholar]
- 3.Delmas PD, van de Langerijt L, Watts NB, Eastell R, Genant H, Grauer A, Cahall DL. Underdiagnosis of vertebral fractures is a worldwide problem: the IMPACT study. J Bone Miner Res. 2005;20(4):557–63. doi: 10.1359/JBMR.041214. [DOI] [PubMed] [Google Scholar]
- 4.Cauley JA, Hochberg MC, Lui LY, Palermo L, Ensrud KE, Hillier TA, Nevitt MC, Cummings SR. Long-term risk of incident vertebral fractures. Jama. 2007;298(23):2761–7. doi: 10.1001/jama.298.23.2761. [DOI] [PubMed] [Google Scholar]
- 5.Samelson EJ, Hannan MT, Zhang Y, Genant HK, Felson DT, Kiel DP. Incidence and risk factors for vertebral fracture in women and men: 25-year follow-up results from the population-based Framingham study. J Bone Miner Res. 2006;21(8):1207–14. doi: 10.1359/jbmr.060513. [DOI] [PubMed] [Google Scholar]
- 6.Riggs BL, Melton LJ, Robb RA, Camp JJ, Atkinson EJ, Peterson JM, Rouleau PA, McCollough CH, Bouxsein ML, Khosla S. Population-based study of age and sex differences in bone volumetric density, size, geometry, and structure at different skeletal sites. J Bone Miner Res. 2004;19(12):1945–54. doi: 10.1359/JBMR.040916. [DOI] [PubMed] [Google Scholar]
- 7.Melton LJ, 3rd, Riggs BL, Keaveny TM, Achenbach SJ, Hoffmann PF, Camp JJ, Rouleau PA, Bouxsein ML, Amin S, Atkinson EJ, Robb RA, Khosla S. Structural determinants of vertebral fracture risk. J Bone Miner Res. 2007;22(12):1885–92. doi: 10.1359/jbmr.070728. [DOI] [PubMed] [Google Scholar]
- 8.Cauley JA, Blackwell T, Zmuda JM, Fullman RL, Ensrud KE, Stone KL, Barrett-Connor E, Orwoll ES. Correlates of trabecular and cortical volumetric bone mineral density at the femoral neck and lumbar spine: the osteoporotic fractures in men study (MrOS) J Bone Miner Res. 2010;25(9):1958–71. doi: 10.1002/jbmr.86. [DOI] [PMC free article] [PubMed] [Google Scholar]
- 9.Bouxsein ML, Melton LJ, 3rd, Riggs BL, Muller J, Atkinson EJ, Oberg AL, Robb RA, Camp JJ, Rouleau PA, McCollough CH, Khosla S. Age- and sex-specific differences in the factor of risk for vertebral fracture: a population-based study using QCT. J Bone Miner Res. 2006;21(9):1475–82. doi: 10.1359/jbmr.060606. [DOI] [PubMed] [Google Scholar]
- 10.Riggs BL, Melton LJ, 3rd, Robb RA, Camp JJ, Atkinson EJ, Oberg AL, Rouleau PA, McCollough CH, Khosla S, Bouxsein ML. Population-based analysis of the relationship of whole bone strength indices and fall-related loads to age- and sex-specific patterns of hip and wrist fractures. J Bone Miner Res. 2006;21(2):315–23. doi: 10.1359/JBMR.051022. [DOI] [PubMed] [Google Scholar]
- 11.Lenchik L, Shi R, Register TC, Beck SR, Langefeld CD, Carr JJ. Measurement of trabecular bone mineral density in the thoracic spine using cardiac gated quantitative computed tomography. J Comput Assist Tomogr. 2004;28(1):134–9. doi: 10.1097/00004728-200401000-00023. [DOI] [PubMed] [Google Scholar]
- 12.Moselewski F, O'Donnell CJ, Achenbach S, Ferencik M, Massaro J, Nguyen A, Cury RC, Abbara S, Jang IK, Brady TJ, Hoffmann U. Calcium concentration of individual coronary calcified plaques as measured by multidetector row computed tomography. Circulation. 2005;111(24):3236–41. doi: 10.1161/CIRCULATIONAHA.104.489781. [DOI] [PubMed] [Google Scholar]
- 13.Dawber TR, Meadors GF, Moore FE. Epidemiological approaches to heart disease: the Framingham Study. Am J Pub Health. 1951;41:279–286. doi: 10.2105/ajph.41.3.279. [DOI] [PMC free article] [PubMed] [Google Scholar]
- 14.Feinleib M, Kannel WB, Garrison RJ, McNamara PM, Castelli WP. The Framingham Offspring Study. Design and preliminary data. Prev Med. 1975;4(4):518–25. doi: 10.1016/0091-7435(75)90037-7. [DOI] [PubMed] [Google Scholar]
- 15.Splansky GL, Corey D, Yang Q, Atwood LD, Cupples LA, Benjamin EJ, D'Agostino RB, Sr, Fox CS, Larson MG, Murabito JM, O'Donnell CJ, Vasan RS, Wolf PA, Levy D. The Third Generation Cohort of the National Heart, Lung, and Blood Institute's Framingham Heart Study: design, recruitment, and initial examination. Am J Epidemiol. 2007;165(11):1328–35. doi: 10.1093/aje/kwm021. [DOI] [PubMed] [Google Scholar]
- 16.Pou KM, Massaro JM, Hoffmann U, Lieb K, Vasan RS, O'Donnell CJ, Fox CS. Patterns of abdominal fat distribution: the Framingham Heart Study. Diabetes Care. 2009;32(3):481–5. doi: 10.2337/dc08-1359. [DOI] [PMC free article] [PubMed] [Google Scholar]
- 17.Hoffmann U, Massaro JM, Fox CS, Manders E, O'Donnell CJ. Defining normal distributions of coronary artery calcium in women and men (from the Framingham Heart Study) Am J Cardiol. 2008;102(9):1136–41. 1141 e1. doi: 10.1016/j.amjcard.2008.06.038. [DOI] [PMC free article] [PubMed] [Google Scholar]
- 18.Lang T, LeBlanc A, Evans H, Lu Y, Genant H, Yu A. Cortical and trabecular bone mineral loss from the spine and hip in long-duration spaceflight. J Bone Miner Res. 2004;19(6):1006–12. doi: 10.1359/JBMR.040307. [DOI] [PubMed] [Google Scholar]
- 19.Sigurdsson G, Aspelund T, Chang M, Jonsdottir B, Sigurdsson S, Eiriksdottir G, Gudmundsson A, Harris TB, Gudnason V, Lang TF. Increasing sex difference in bone strength in old age: The Age, Gene/Environment Susceptibility-Reykjavik study (AGES-REYKJAVIK) Bone. 2006;39(3):644–51. doi: 10.1016/j.bone.2006.03.020. [DOI] [PubMed] [Google Scholar]
- 20.Lang TF, Guglielmi G, van Kuijk C, De Serio A, Cammisa M, Genant HK. Measurement of bone mineral density at the spine and proximal femur by volumetric quantitative computed tomography and dual-energy X-ray absorptiometry in elderly women with and without vertebral fractures. Bone. 2002;30(1):247–50. doi: 10.1016/s8756-3282(01)00647-0. [DOI] [PubMed] [Google Scholar]
- 21.Iyer S, Christiansen BA, Roberts BJ, Valentine MJ, Manoharan RK, Bouxsein ML. A biomechanical model for estimating loads on thoracic and lumbar vertebrae. Clin Biomech (Bristol, Avon) 2010;25(9):853–8. doi: 10.1016/j.clinbiomech.2010.06.010. [DOI] [PMC free article] [PubMed] [Google Scholar]
- 22.Bean JC, Chaffin DB. Biomechanical model calculation of muscle contraction forces: A double linear programming method. J Biomechanics. 1988;21(1):59–66. doi: 10.1016/0021-9290(88)90192-3. [DOI] [PubMed] [Google Scholar]
- 23.Brown SH, Potvin JR. Constraining spine stability levels in an optimization model leads to the prediction of trunk muscle cocontraction and improved spine compression force estimates. J Biomech. 2005;38(4):745–54. doi: 10.1016/j.jbiomech.2004.05.011. [DOI] [PubMed] [Google Scholar]
- 24.Schultz AB, Andersson GBJ. Analysis of loads on the lumbar spine. Spine. 1981;6(1):76–82. doi: 10.1097/00007632-198101000-00017. [DOI] [PubMed] [Google Scholar]
- 25.Contini R. Body Segment Parameters, Part II. Artif Limbs. 1972;16(1):1–19. [PubMed] [Google Scholar]
- 26.Liu YK, Laborde JM, Van Buskirk WC. Inertial properties of a segmented cadaver trunk: their implications in acceleration injuries. Aerosp Med. 1971;42(6):650–7. [PubMed] [Google Scholar]
- 27.Pearsall DJ, Reid JG, Livingston LA. Segmental inertial parameters of the human trunk as determined from computed tomography. Ann Biomed Eng. 1996;24(2):198–210. doi: 10.1007/BF02667349. [DOI] [PubMed] [Google Scholar]
- 28.de Leva P. Adjustments to Zatsiorsky-Seluyanov's segment inertia parameters. J Biomech. 1996;29(9):1223–30. doi: 10.1016/0021-9290(95)00178-6. [DOI] [PubMed] [Google Scholar]
- 29.Winter D. Biomechanics and Motor Control of Human Movement. 4th. John Wiley & Sons; Hoboken, NJ: 2009. pp. 82–106. [Google Scholar]
- 30.Anderson DE, DA J, Bruno AG, Demissie S, Kiel DP, Bouxsein ML. Variations of QCT-Based Muscle Attenuation with Age, Sex and Specific Muscle in the Lumbar and Thoracic Trunk. J Biomechanics (accepted) 2011 [Google Scholar]
- 31.Samelson EJ, Christiansen BA, Demissie S, Broe KE, Zhou Y, Meng CA, Yu W, Cheng X, O'Donnell CJ, Hoffmann U, Genant HK, Kiel DP, Bouxsein ML. Reliability of vertebral fracture assessment using multidetector CT lateral scout views: the Framingham Osteoporosis Study. Osteoporos Int. 2011;22(4):1123–31. doi: 10.1007/s00198-010-1290-6. [DOI] [PMC free article] [PubMed] [Google Scholar]
- 32.Samelson EJ, Hannan MT, Felson DT, Zhang YQ, Genant HK, Kiel DP. Risk factors for incidence of vertebral fracture in men and women: 25-year fellow-up results from the Framingham osteoporosis study. Journal of Bone and Mineral Research. 1999;14:S147–S147. doi: 10.1359/jbmr.060513. [DOI] [PubMed] [Google Scholar]
- 33.Wasnich RD. Vertebral fracture epidemiology. Bone. 1996;18(3 Suppl):179S–183S. doi: 10.1016/8756-3282(95)00499-8. [DOI] [PubMed] [Google Scholar]
- 34.Freitas SS, Barrett-Connor E, Ensrud KE, Fink HA, Bauer DC, Cawthon PM, Lambert LC, Orwoll ES. Rate and circumstances of clinical vertebral fractures in older men. Osteoporos Int. 2008;19(5):615–23. doi: 10.1007/s00198-007-0510-1. [DOI] [PMC free article] [PubMed] [Google Scholar]
- 35.Christiansen BA, Kopperdahl DL, Kiel DP, Keaveny TM, Bouxsein ML. Mechanical contributions of the cortical and trabecular compartments contribute to differences in age-related changes in vertebral body strength in men and women assessed by QCT-based finite element analysis. J Bone Miner Res. 2011;26(5):974–83. doi: 10.1002/jbmr.287. [DOI] [PMC free article] [PubMed] [Google Scholar]
- 36.Silva MJ, Wang C, Keaveny TM, Hayes WC. Direct and computed tomography thickness measurements of the human, lumbar vertebral shell and endplate. Bone. 1994;15(4):409–14. doi: 10.1016/8756-3282(94)90817-6. [DOI] [PubMed] [Google Scholar]
- 37.Eswaran SK, Gupta A, Adams MF, Keaveny TM. Cortical and trabecular load sharing in the human vertebral body. J Bone Miner Res. 2006;21(2):307–14. doi: 10.1359/jbmr.2006.21.2.307. [DOI] [PubMed] [Google Scholar]
- 38.O'Neill TW, Felsenberg D, Varlow J, Cooper C, Kanis JA, Silman AJ. The prevalence of vertebral deformity in european men and women: the European Vertebral Osteoporosis Study. J Bone Miner Res. 1996;11(7):1010–8. doi: 10.1002/jbmr.5650110719. [DOI] [PubMed] [Google Scholar]
- 39.Davies KM, Stegman MR, Heaney RP, Recker RR. Prevalence and severity of vertebral fracture: the Saunders County Bone Quality Study. Osteoporos Int. 1996;6(2):160–5. doi: 10.1007/BF01623941. [DOI] [PubMed] [Google Scholar]
- 40.Lunt M, Felsenberg D, Reeve J, Benevolenskaya L, Cannata J, Dequeker J, Dodenhof C, Falch JA, Masaryk P, Pols HA, Poor G, Reid DM, Scheidt-Nave C, Weber K, Varlow J, Kanis JA, O'Neill TW, Silman AJ. Bone density variation and its effects on risk of vertebral deformity in men and women studied in thirteen European centers: the EVOS Study. J Bone Miner Res. 1997;12(11):1883–94. doi: 10.1359/jbmr.1997.12.11.1883. [DOI] [PubMed] [Google Scholar]
- 41.Riggs BL, Melton LJ, Robb RA, Camp JJ, Atkinson EJ, McDaniel L, Amin S, Rouleau PA, Khosla S. A population-based assessment of rates of bone loss at multiple skeletal sites: evidence for substantial trabecular bone loss in young adult women and men. J Bone Miner Res. 2008;23(2):205–14. doi: 10.1359/JBMR.071020. [DOI] [PMC free article] [PubMed] [Google Scholar]
- 42.Van der Klift M, De Laet CE, McCloskey EV, Hofman A, Pols HA. The incidence of vertebral fractures in men and women: the Rotterdam Study. J Bone Miner Res. 2002;17(6):1051–6. doi: 10.1359/jbmr.2002.17.6.1051. [DOI] [PubMed] [Google Scholar]
- 43.Santavirta S, Konttinen YT, Heliovaara M, Knekt P, Luthje P, Aromaa A. Determinants of osteoporotic thoracic vertebral fracture. Screening of 57,000 Finnish women and men. Acta Orthop Scand. 1992;63(2):198–202. doi: 10.3109/17453679209154823. [DOI] [PubMed] [Google Scholar]
- 44.Chapurlat RD, Duboeuf F, Marion-Audibert HO, Kalpakcioglu B, Mitlak BH, Delmas PD. Effectiveness of instant vertebral assessment to detect prevalent vertebral fracture. Osteoporos Int. 2006;17(8):1189–95. doi: 10.1007/s00198-006-0121-2. [DOI] [PubMed] [Google Scholar]
- 45.Takada M, Wu CY, Lang TF, Genant HK. Vertebral fracture assessment using the lateral scoutview of computed tomography in comparison with radiographs. Osteoporos Int. 1998;8(3):197–203. doi: 10.1007/s001980050054. [DOI] [PubMed] [Google Scholar]
- 46.Hospers IC, van der Laan JG, Zeebregts CJ, Nieboer P, Wolffenbuttel BH, Dierckx RA, Kreeftenberg HG, Jager PL, Slart RH. Vertebral fracture assessment in supine position: comparison by using conventional semiquantitative radiography and visual radiography. Radiology. 2009;251(3):822–8. doi: 10.1148/radiol.2513080887. [DOI] [PubMed] [Google Scholar]
- 47.Zmuda JM, Cauley JA, Glynn NW, Finkelstein JS. Posterior-anterior and lateral dual-energy x-ray absorptiometry for the assessment of vertebral osteoporosis and bone loss among older men. J Bone Miner Res. 2000;15(7):1417–24. doi: 10.1359/jbmr.2000.15.7.1417. [DOI] [PubMed] [Google Scholar]
- 48.Ferrar L, Jiang G, Cawthon PM, San Valentin R, Fullman R, Lambert L, Cummings SR, Black DM, Orwoll E, Barrett-Connor E, Ensrud K, Fink HA, Eastell R. Identification of vertebral fracture and non-osteoporotic short vertebral height in men: the MrOS study. J Bone Miner Res. 2007;22(9):1434–41. doi: 10.1359/jbmr.070608. [DOI] [PubMed] [Google Scholar]
- 49.Jiang G, Eastell R, Barrington NA, Ferrar L. Comparison of methods for the visual identification of prevalent vertebral fracture in osteoporosis. Osteoporos Int. 2004;15(11):887–96. doi: 10.1007/s00198-004-1626-1. [DOI] [PubMed] [Google Scholar]
- 50.Fuerst T, von Ingersleben G, Wu C, Ounadjela S, Colombel P, Szechinski J, Hufert K, Genant H. Patterns of prevalent and Incident vertebral fracture in the spine: differentiating prevalent fracture from deformity. J Bone Miner Res. 2011;26(Suppl1):S44. [Google Scholar]