

Abstract
Resolving the excited state dynamics of DNA- and RNA- nucleobases has attracted considerably attention. UV irradiation of the isolated nucleobases leads to the population of an electronic excited state which is quenched by internal conversion mediated by conical intersections on an ultrafast timescale. We present non-adiabatic on-the-fly molecular dynamics simulations of the UV-pump-IR-probe signal of the pyrimidine nucleobase uracil using a novel semiclassical protocol which takes into account the path integral over the excited state vibrational dynamics and properly describes the joint temporal and spectral resolution of the technique. Simulations of vibrational motions of carbonyl fingerprint modes in the electronically excited states reveal clear signatures of different relaxation pathways on a timescale of hundreds of femtoseconds which arise from an ultrafast branching in the excited state. We show that the inherent temporal and spectral resolution of the technique is not purely instrumental but also depends on the vibrational fluctuation timescale.
Keywords: non-adiabatic on-the-fly dynamics, excited states, DNA, time-resolved IR spectroscopy
The strong UV absorption bands of DNA- and RNA- nucleobases lead to the population of bright valence excited states with ππ* character. The nucleobases have been engineered by nature to be photostable with respect to UV irradiation. At the core of this self-protecting property are few-picosecond excited state deactivation mechanisms involving conical intersections1,2 where electronic energy is very rapidly converted into vibrational energy allowing to minimize harmful photochemical processes that can eventually lead to DNA photolesions. These damages can be corrected to some extent in enzymatic repair processes but an accumulation of photolesions leads to genetic mutations and ultimately to diseases like skin cancer. The harmful molecular mechanisms leading to photochemical DNA damage has been shown to occur on the short picosecond timescale3, thus directly competing with photoprotection mechanisms, and are additionally affected by variations of the base sequence and the double helix conformation4–7.
It is well established that the purine nucleobases adenine and guanine decay with a single quenching mechanism8–10 which is mediated by the barrierless access to a seam of conical intersections with the electronic ground state11–14. In contrast, the excited state lifetimes of the pyrimidine bases are somewhat longer (with the longest for thymine) and involve several interconnected excited state decay pathways15–17. A direct ππ* → gs channel leads to ultrafast repopulation of the electronic ground state9,10,18,19 while an indirect ππ* → nOπ* → gs channel involves an optical dark nOπ* intermediate state with a longer lifetime 19. Dynamical simulations of DNA and RNA bases helped establish the interconnection between the two relaxation mechanisms and additional minor ring-opening pathways but the relative importance of these pathways is still under debate20–22. A clear assignment of spectroscopic signatures of these pathways has only been provided for the earlier stages of the process20.
Commonly applied time resolved techniques such as UV or visible pump-probe or photoelectron spectroscopy offer a high sub-100 fs temporal resolution9,10. The multidimensional optical counterparts of these techniques have been traditionally developed in the 600–800 nm regime limited by laser sources, are now becoming feasible in the UV23–28. The broad bandwidth of the optical or ionizing probe pulses lacks selectivity for the underlying vibrational dynamics. Only the population decay of the bright ππ* state is captured by probing the system dynamics in the optical regime. These techniques thus fail to directly monitor the population of dark states and to decipher between the particular pathways.
Structural information about the rearrangement of atoms can be derived directly from time- and frequency-resolved vibrational spectroscopy (either with IR- or Raman probes). Unique marker bands (e.g. the IR-intense carbonyl C = O stretch vibrations of the nucleobases) serve as fingerprint of the excited state photoreaction or non-adiabatic relaxation dynamics. This allows to resolve transient reaction intermediates29–31, obtain structural details32 and thus ultimately resolve the reaction mechanism3,4,33,34. The UV-Pump - IR-Probe technique has been proven to be a valuable direct probe for complex photoreactions by allowing to identify the real time reaction mechanism leading to the formation of photolesions in DNA nucleobases3,4,34,35 and other photoreactions30,31,33,36.
We present a semiclassical microscopic simulation protocol for the UV-pump - IR-probe signal of uracil which takes into account the entire path integral of the excited state dynamics as well as the temporal and spectral profile of the IR probe pulse. The interpretation of these signals requires a careful analysis of the interplay between spectral and temporal resolution in the excited state since time resolved vibrational spectra37–39 may not be simply interpreted as an instantaneous snapshot of the nuclear dynamics40; sums over paths smear the temporal and spectral resolutions. The time-dependent vibrational frequencies (subject to non-adiabatic relaxation) introduce a matter-chirp contribution to the signal which affects the effective pulse length for highest temporal resolution. We demonstrate that the resolution in vibrational spectra is governed by both the infrared probe and the underlying matter dynamics and can not be controlled solely by experimental knobs. The present analysis and the conclusions may be readily extended to a stimulated Raman probe41.
Our simulations employ non-adiabatic on-the-fly molecular dynamics to calculate the vibrational spectra. A small vibrational system is treated quantum mechanically whereas a classical bath causes a time dependent modulation of the system Hamiltonian. The required quantities are directly derived from non-adiabatic mixed quantum-classical dynamics where the excited state vibrational Hamiltonian is reconstructed on-the-fly by block-diagonalization in a mode tracking procedure42 which avoids the calculation of the entire exited state Hessian matrix (for details see Sec. Materials and Methods). The numerical algorithm developed for the simulation of the time-evolution of specific “fingerprint” modes (like e.g. C = O modes) scales linearly with the number of vibrations, allowing for simulations of medium sized molecules in the excited states and numerical effort is decoupled from system size.
We further dissect the contributions of different femtosecond relaxation mechanisms to the signal and predict the signatures of the concurring relaxation pathways, excited state trapping and ultrafast deactivation to the electronic ground state. The spectra show unique signatures from the different deactivation pathways and allow to asses their relative importance in future experiments.
Loop diagram representation of time and frequency resolved pump-probe signals
In the UV-pump - IR-probe technique the pump pulse
 centered at time zero promotes the system from its ground electronic state g to the vibrational state a of an excited electronic state (see Scheme 1 (a)) and launches the vibrational dynamics. The IR probe
 centered at T can then either stimulate emission that couples the vibrational state a and a lower vibrational state d or absorption to a higher vibrational state c. The complex electric field reads
Scheme 1.
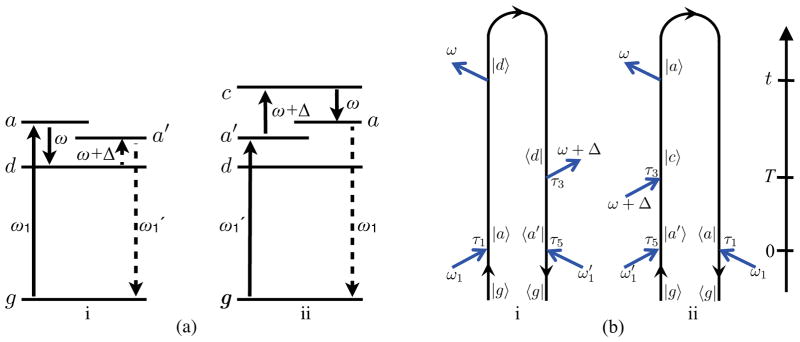
Time-resolved frequency-dispersed pump-probe spectroscopy: (a) schematic of ground and excited states accessed by the pump-probe pulse sequence; solid arrows represent intervals with forward time propagation, dashed lines represent backward time propagation. (b) closed-time path-loop diagrams which together with their complex conjugates represent the pump-probe signal. Diagram (i) stimulated emission and (ii) absorption contribution to the signal, diagram rules are given in Ref. 43. ω1 and denote interactions with the pump, the corresponding times τ1 and τ5 are centered around zero. ω+ Δ represents an interaction with the probe at time ω3 which is centered around the pump-probe delay T. Time translational invariance of the matter correlation functions implies that the sum of frequencies in each diagram must be zero, i.e. .
| (1) |
The pump-probe signal SPP(ω, T) is given by the frequency gated change in probe intensity and depends parametrically on T. The relevant loop diagrams shown in Scheme 1 (b) (plus their complex conjugates) contain four field-matter interactions -two with each pulse. Diagrams (i) and (ii) correspond to emission and absorption, respectively of the IR probe pulse. The frequency-gated signal can be directly read off the diagrams and is given by
| (2) |
| (3) |
where G(t1,t2) = (−i/ħ)θ(t1 − t2)e−iH(t1−t2) is the retarded Green’s function representing forward propagation from t1 to t2. The advanced Green’s function G†(t1,t2) represents backward propagation from t1 to t2, Ve and Vn denote the electronic and vibrational dipole operators, respectively. The two interactions with the probe involve the detection mode ω and another mode ω +Δ. The relevant range of the τ3 integration is controlled by the effective bandwidth of the variable Δ. In both diagrams (i) and (ii) the probe is frequency-dispersed in the detection. Since only a single mode is selected for detection one can ask why does the probe duration matter at all? This is apparent from the diagrams which show that the signal involves two interactions with the probe. The frequency dispersed detection only selects the frequency of the last interaction
whereas the other interaction
(ω +Δ) may still involve many other modes, making the signal dependent on the probe bandwidth and the relative phase of different modes. The time resolution is lost only if the other interaction also selects a single mode and is sharply peaked at Δ= 0. This implies a CW probe. The Δ bandwidth cannot be controlled experimentally since it depends on the system dynamics details.
Semiclassical approach: coupling to a classical bath
Eq. (2) and Eq. (3) may be used for a complete many body propagation of the wavefunction which is exact and numerically expensive. The signal is given by a sum over paths spanning both branches of the loop. We shall employ a simplified protocol by treating some of the bath degrees of freedom as classical while retaining the quantum character of selected vibrations40,41 (in our case the IR-intense carbonyl C = O stretch vibrations of the nucleobase). The selected modes are then modulated during the course of the non-adiabatic dynamics of other classical bath degrees of freedom. We further assume that the preparation pump pulse is impulsive setting
(t) =
δ(t), and eliminating the τ1 and τ5 integrations in Eq. (2) and Eq. (3). The semiclassical signal finally reads
| (4) |
where ωαβ ≡ ωα − ωβ and is the lifetime of state a. 〈…〈e represents the ensemble averaging over a set of classical trajectories. This signal is given by a path integral in the molecule and field space involving the vibrational frequency trajectories ωca(t) and ωad(t). In addition, the starting point τ3 is not precisely defined since it is an integration variable. The signal depends not only on the initial and final value of the vibrational frequency ωca(t), but rather on the entire pathway from time T to the time when the polarization decays to zero. In time-resolved measurements the probe must have a broader bandwidth than the inverse timescale of the vibrational dynamics. The latter is given by the spread of transition frequencies ωa′a (decay of a superposition) and by the dephasing rate γa. Even if the probe pulse is impulsive and delayed by T, the pulse may not be simply replaced by δ function, since it can be longer than the infrared period. Thus an infrared pulse can be at most “semi impulsive” (i.e. short compared to vibrational relaxation process but not compared to the period of high frequency vibrations ≈ 2000–3000 cm−1). In contrast, the visible pulse used in a stimulated Raman process can be truly impulsive (short compared to the vibrational period)41,44–48.
Electronic Relaxation
UV radiation excites the molecule (Figure 1 (a)) to the bright ππ* S2 state which is located 5.07 eV above the S0 state on MRPT2-CAS(14/10) level of theory and above the dark nOπ* state (Figure 1 (b), for a discussion of the electronic exited states and electronic structure methods see Supporting Information (SI)-Table 1). Figure 1 (c) shows the IR stick spectrum of uracil calculated on CAS(14/10) level of theory1 in the electronic ground state S0 (bottom), the S1 minimum with nOπ* character (middle) and the S2 minimum with ππ* character (top). In S0 two intense and spectrally isolated C = O stretch vibrations are identified at ν̃ = 2012 cm−1 and ν̃ = 1971 cm−1, the splitting is attributed to the different chemical environment in the aromatic π system of uracil. In the ππ* minimum the higher energy C = O7 mode (where C = On is the localized stretch vibration involving atom n) is blue shifted by ≈ 16 cm−1 and the high oscillator strength of this mode is preserved. Due to the broken aromaticity in the ππ* state, the low-energy C = O8 mode is red shifted by ≈ 41 cm−1 and the oscillator strength is largely diminished, reflecting the population of the anti-bonding π* orbital of the C = O8 bond. Inspection of the normal mode vector shows that the localized C = O8 mode in S0 develops into a partially delocalized normal mode whose motion involves the adjacent partial double bond, reflecting the enolat-resonance structure of uracil. Nevertheless both C = O modes remain decoupled. In the S1 state with nO8π* character the motion of the C = O8 mode is even more delocalized and the energy is further reduced (ν̃ = 1719 cm−1). The oscillator strength is about 33 % of the C = O7 ground state vibration. The high energy C = O7 mode preserves its localized character and shows a blue shift of ≈ 47 cm−1 compared to the S0 state.
Figure 1.
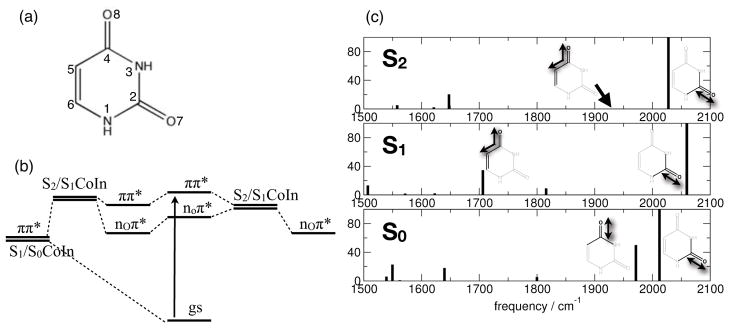
(a) Chemical structure of uracil. (b) Schematic of the femtosecond excited state relaxation mechanisms. (c) Carbonyl stretch vibrations: frequencies and relative intensities of the carbonyl marker bands in the electronic ground state S0 (ν̃C=O7 = 2012 cm−1, ν̃C=O8 = 1971 cm−1), and the excited states S1 (nO8π*; ν̃C=O7 = 2059 cm−1, ν̃C=8 = 1706 cm−1) and S2 (πOπ*; ν̃C=O7 = 2028 cm−1, ν̃C=O8 = 1929 cm−1).
Figure 2 depicts the time evolution of the excited state electronic populations within the first picosecond, averaged over 44 trajectories (electronic structure method CAS(14/10), for details of the non-adiabatic on-the-fly molecular dynamics simulations see Sec. Theoretical Methods). The molecule starts in the bright ππ* state (47.6 % in S2 and 52.3 % in S3), within the first 30 fs the S2 population is rapidly increased to 86 %, by following the diabatic character of the ππ* state. This initial S3 → S2 population transfer is accompanied by a partial population of the S1 state by ≈ 24 % due to S2 → S1 population transfer within the first 50 fs. The S1 population remains nearly constant until t = 200 fs, and then increases to ≈ 57 % at t = 1 ps. This increase is fed from the S2 state whose population is reduced by about ≈ 50 % in the time interval [200; 1000] fs. Accordingly the decay of S2 occurs by two mechanisms: first due to population of the dark S1 state with nOπ* character and second due to population transfer into the electronic ground state S0 which is populated by about 18 % at t = 1000fs. Additionally a significant fraction of the population (about 24 %) is trapped in the S2 state at t=1000 fs. Interestingly the S1 population is not transiently increased by the S2 → S0 relaxation.
Figure 2.

Time evolution of electronic populations and sample trajectories: (a) Mean adiabatic electronic state population averaged over 44 trajectories starting in the bright πOπ* state. Depending on the initial geometry the initial state is either S2 (47.7 %) or S3 (52.3 %); (b) time-evolution of the electronic states for a prototype trajectory showing ππ*→ nOπ* relaxation (S2 → S1 population transfer at t= 270 fs). (c) time-evolution of the electronic states for a prototype trajectory showing ππ* → gs relaxation (S2 → S1 population transfer at t= 586 fs, S1 → S0 population transfer at t= 645 fs).
The typical trajectories depicted in Figure 2 (b) and (c) demonstrate the two relaxation mechanisms of S2 (the populated state at time t is highlighted in cyan). Figure 2 (b) shows the population relaxation of the S2 state leading to a trapped S1 population. In this trajectory the S2/S1 seam of conical intersection is reached at t = 270 fs. The energy gap between S1 and S0 is then reduced but no hopping event into the ground state occurs and the trajectory evolves on the dark S1 (nOπ*) state until 1 ps. This relaxation mechanism is denoted as ππ* → nOπ* trapping. A typical trajectory leading to the repopulation of the electronic ground state S0 is depicted in Figure 2 (c). Here at t = 586 fs S2 → S1 population transfer occurs, followed by S1 → S0 transition at t = 656 fs. Subsequent to the initial S2 → S1 hopping event the ππ* character of the populated state is preserved leading to a S1/S0 conical intersection with ππ*/gs character. Thus the trajectory follows diabatically the ππ* character in the excited electronic states. Inspection of the complete set of trajectories shows that all observed ground state relaxation events (8 out of 44 trajectories) follow this mechanism. Upon S2 → S1 relaxation the diabatic ππ* character of the populated state is preserved, followed by relaxation into the S0 state. The period the system spends in the intermediate S1 state varies between 8–59 fs which is too short for a transient increase in the S1 population.
A possible excited state relaxation mechanism is summarized in Figure 1 (b). Subsequent to population of the bright ππ* state, ultrafast branching of the excited state population takes place. The dominant relaxation channel involves sub-ps population transfer involving the ππ* and nOπ* states, followed by trapping of the population in a dark nOπ* state (ππ*→ nOπ* trapping mechanism, right side of Figure 1 (b)), relaxation could only be observed as minor channel for propagation times > 1 ps (an elaborate comparison to the relaxation dynamics reported in Refs.20,21 and electronic populations until t = 2 ps are given in the SI). In a parallel relaxation channel the system relaxes to the S2 minimum potentially followed by a relaxation into the electronic ground within the first picosecond. The latter is triggered by a crossing of the nOπ* and ππ* state where the diabatic ππ* character is preserved in the populated S1 state, followed by S1 → S0 population transfer (diabatic relaxation mechanism, left side of Figure 1 (b)).
The UV-Pump-IR-Probe signal
In the following we demonstrate how the two non-adiabatic relaxation mechanisms show up in the temporal evolution of the UV-pump - IR-probe signal SPP(ω, T). Figure 3 (a) depicts the SPP(ω, T) signal (Eq. (4)) of the ππ*→ nOπ* trapping (selected time-slices are given in SI-Figure 6). The calculation is based on a single trajectory and is depicted together with the instantaneous time evolution of the C = O7 and C = O8 stretch vibrations (blue and red line, respectively). These are modulated due to non-adiabatic electronic relaxation in the bath of all remaining vibrational modes. Both modes C = O7 and C = O8 show fast modulations on a 10–20 fs timescale and slower intense modulations an a 50–100 fs timescale. The C = O8 mode is shifted in its center frequency to appearing as new resonance at t >270 fs due to the ππ*→ nOπ* population transfer. Detailed comparison of SPP(ω, T) with the actual time evolution of the C = O8 mode reveals that the new resonance in SPP(ω, T) slightly precedes C = O8, an intrinsic effect of the path integral expression in Eq. (4) as the signal does not simply represent an instantaneous snapshot of the vibrational frequency at the observation time (represented by the IR probe pulse centered around T). Due to the population of the S1 state (nOπ*) the relative intensity at is reduced compared to the C = O7 mode but still a clear IR signature of the ππ*→ nOπ* trapping process is retained in SPP(ω, T).
Figure 3.

(a) SPP(ω, T) signal of the C = O7 and C = O8 modes of uracil (Gaussian probe
with tFW HM = 175 fs, centered at ω0 = 2000 cm−1; ΔT = 25 fs) for the prototype trajectory of ππ*→ nOπ* trapping (S2
→ S1 population transfer at t= 270 fs). Also shown are the instantaneous C = O stretch vibrational frequencies. (b) The Δ-dispersed signal S̄ (ω,T = 270 fs; Δ) (Eq. (5)) for a probe pulse characterized by tFW HM and ωFW HM as indicated. (c) same as (b) but for tFW HM = 400 fs and ωFW HM = 74 cm−1. The
temporal and spectral widths are marked in panels (b) and (d). (d) S̄(ω= 1678 cm−1,,T = 270 fs; Δ) for various probe durations. (e–h) same as (a–d) but for a trajectory of diabatic
relaxation (S2
→ S1 population transfer at t= 586 fs; S1
→ S0 population transfer at t= 645 fs); the Δ-dispersed signal (f–h) is evaluated at T = 500 fs.
The fast frequency fluctuations apparent in C = O7 and C = O8 are not resolved in the pump-probe signal since the IR probe pulse is too long (tFW HM = 175 fs), yet the two modes are resolved. Only frequency shifts which capture the average of the C = O7,8 modulations can be observed. To examine the effect of the inherent matter chirp on the joint time-frequency resolution we decompose the signal in the form
| (5) |
The Δ-dispersed signal S̄(ω,T; Δ) (calculated according to SI-Eq. 5) represents the contribution of the ω + Δ mode of the probe to the signal (in addition to the ω mode) and is a joint property of field+ matter which depends on the vibrational dynamics as well as the pump and the probe pulses. The signal (Eq. (4)) is obtained by integrating it over Δ. As is clear from Eq. (5), S̄ is not an experimental observable but it allows to visualize the underlying paths in the joint filed+matter space that contribute to the signal. If the vibrational dynamics is fast compared to the pulse, the signal will depend on the entire probe bandwidth and the variation of S̄ with Δ will resemble the probe envelope. In the opposite limit only a slice of the bandwidth will participate. In the time domain this implies that τ3 in Eq. (4) will be sharply peaked or diffuse in the two limits, respectively. This will affect the temporal resolution of the technique as will be demonstrated below.
It is our objective to capture the matter dynamics, i.e. the frequency changes of C = O7,8 induced by non-adiabatic relaxation in Figure 3 (a). Therefore we consider the effect of a 50 fs probe pulse on S̄ (ω,T; Δ) (Figure 3 (b)). As the probe is short compared to the change in vibrational frequency
(τ3 −T) selects limited frequency contributions from the matter chirp in the time domain. Accordingly the dominant contribution in S̄(ω,T; Δ) arises from the broad bandwidth of the pulse itself, and frequency resolution of matter is eroded (see the two unstructured bands along ω + Δ in Figure 3 (b)). For a long 400 fs probe pulse (Figure 3 (c)) the induced frequency changes C = O7,8 are entirely captured by the probe field and we obtain a high frequency resolution with dominant frequency contributions arising from the matter (at the expense of low temporal resolution). Each resonance along ω can now be decomposed into matter frequency contributions at a given delay T. Figure 3 (d) displays the underlying frequency contributions to a single point in SPP(ω, T) for different probe durations. For long pulses (300–500 fs) the induced frequency changes C = O7,8 are captured by the probe pulse resulting in a double peak structure which correspond to the initial and final frequency of C = O8 due to the non-adiabatic relaxation. The width of S̄ along ω + Δ becomes independent of the probe due to the inherent matter chirp contribution (for a comparison with the probe bandwidth see SI-Fig. 5). As the probe is shortened (250–150 fs),
(τ3 − T) selects only limited frequency contributions from the matter chirp. Thus frequency resolution is reduced and non-Gaussian peak shapes appear along ω + Δ. In the limit when the probe is short compared to the change in the vibrational frequency C = O7,8 (20–50 fs) the dominant contribution to S̄(t,T; Δ) arises from the pulse itself and frequency resolution is eroded.
A similar analysis for the diabatic relaxation trajectory is shown in Figure 3 (e–h). In the SPP(ω, T) signal (Figure 3 (e)) the intensity of the low-energy C = O8 mode is now largely diminished. Only one resonance appears from the C = O7 mode which shows a characteristic blue shift until t= 500 fs due to its evolution on the S2 potential energy surface with ππ* character. The non-adiabatic relaxation mediated by a ππ*→ gs conical intersection shows up in a short spike in the signal due to dramatic red-shift in C = O8 which is already initiated by the population transfer. Upon relaxation into S0 the frequency shift is reversed and both modes C = O7 and C = O8 again appear around ν̃ = 2000 cm−1. Further on C = O8 and C = O7 appear highly oscillating due to excess vibrational energy in S0. The individual modes are not resolved, nevertheless the ground state relaxation is accompanied by a strong increase in intensity showing up in SPP(ω, T). By examining the Δ-dispersed signal S̄(ω, T = 500 fs; Δ) we observe that for a long probe pulse a structured red shifted shoulder along ω + Δ can be observed at ω = 1856 cm−1 (Figure 3 (g)) which arises from the matter induced changes in vibrational frequency due to non-adiabatic relaxation. An examination of these frequency contributions as a function of pulse duration (Figure 3 (h)) reveals that probe pulses of 150–250 fs are required to resolve this spectral feature. Interestingly the system dynamics induced frequency changes of C = O7/8 of both relaxation mechanisms appear on a similar ≈ 100 fs timescale imposing common requirements on the design of probe pulse length and bandwidth. We find that probe pulses of tFW HM = 150–250 fs offer the best compromise of temporal and spectral resolution which allow to resolve spectral features characteristic for the individual relaxation mechanisms (see e.g. the shoulder at ω + Δ ≈ 1500–1600 cm−1 for tFW HM = 200 fs in Figure 3 (h)).
The signal SPP(ω, T) obtained by ensemble averaging < … >e over the set of trajectories is depicted in Figure 4 (a). We observe a single intense resonance around ν̃ = 2000 cm−1 originating from the time evolution of the C = O7 mode. The frequency and its intensity evolution are depicted in Figure 4 (b) and (c), respectively (blue line). By analyzing the spectral position of the C = O7 mode (Figure 4 (b)) we observe an initial blue shift of the center frequency until t = 300 fs due to the initial dynamics in the S2 and S1 states, followed by a red shift of Δν̃ = 20 cm−1 for t > 600 fs. The intensity of the C = O7 mode is initially diminished until 400–500 fs by about 15 % (Figure 4 (c)). Later on we observe a recovery in the spectral region around ν̃ = 2000 cm−1 due to population of the electronic ground state. Both the temporal intensity recovery and red-shift of the center frequency are clear spectroscopic signatures of the diabatic transition which is responsible for ultrafast photoprotection mechanism of uracil. In the course of the dynamics, ground state relaxation is mediated by the superimposed S1/S0 CoIn structures depicted in Figure 4 (d) representing the active part of the CoIn seam. They are characterize by a pronounced pyramidalization at C5 accompanied by a out-of-plane displacement of H5 in good agreement with the lowest energy S1/S0 CoIn characterized in Refs. 16,18,50. Additionally the dynamically reached CoIn structures show an out-of-plane displacement of N3 and C6, where the degree of C5 pyramidalization can be compensated by a N3 and C6 Dewar-like structure34,51.
Figure 4.

(a) Signal SPP(ω, T) of C = O7 and C = O8 modes averaged over 44 trajectories -
pulse parameters: tFW HM = 175fs, ω0 = 2000 cm−1; ΔT = 25 fs; (b) Peak shift of C = O7 vibrational frequency as indicated by black dots in (a). (c) Time evolution of C = O7 and C = O8 vibrational frequency. (d) Overlay of S1/S0 CoIn structures reached during the dynamics.
The spectral signature of the ππ*→ nOπ* trapping appears red-shifted to the intense C = O7 mode in the ensemble averaged signal SPP(ω, T) as broad and unstructured plateau with about 15 % intensity compared to the intense C = O7 mode. The plateau like appearance arises from the excess vibrational energy in the nOπ* state populated by non-adiabatic relaxation. The plateau intensity steadily increases from t > 300 fs (red line in Figure 4 (c)) providing a unique signature of the dynamics of the optical dark nOπ* state. Similar red-shifted features have been reported for thymine and thymidine but on a slower nanosecond timescale indicative of triplet state formation52. As both, the C = O8 carbonyl bond of a 1nOπ* and a 3ππ* state posses substantial single bond character similar signatures on the respective (femtosecond or nanosecond) timescales are expected.
We have reported simulations of the time resolved UV-pump - IR-probe signal SPP(ω, T) of the RNA nucleobase uracil undergoing non-adiabatic electronic relaxation. The pump-probe signal should help to unambiguously reveal the interconnected relaxation pathways in future time resolved measurements. We find that both diabatic relaxation and ππ*→ nOπ* trapping mechanisms have distinct signatures within the fist picosecond in SPP(ω, T). The system dynamics timescale imposes a lower bound on the probe pulse and defines the actual time resolution which can be observed in the experiment. There are two fundamental reasons why the signal (Eq. (4)) may not be interpreted as snapshots of the instantaneous vibrational frequency: 1. the uncertainty in τ3 around T limits our ability to initiate the probe process in a sharply defined time. 2. the signal at time T depends on a time integral over the frequency trajectory rather than its value at one time. Both effects preclude the simple interpretation of the signal by inspection. However using modeling, the molecular relaxation parameters may nevertheless be extracted from the signals. Some information of the individual trajectories (i.e. individual non-adiabatic relaxation events) is missed in the ensemble-averaged spectra. Performing nonlinear optical experiments at the single molecule level where individual trajectories can be observed will be an exciting possibility53–55.
Theoretical Methods
The signal is calculated in the semiclassical signal representation (Eq. (4)) where all required molecular quantities are derived from semi-classical non-adiabatic on-the-fly molecular molecular dynamics trajectory calculations. We follow a three step procedure:
1. Non-adiabatic on-the-fly molecular dynamics (NA-O-MD)
NA-O-MD simulations are performed with the Newton-X program package 56 where the nuclei are treated classically and follow Newton’s equation of motion. The acceleration on the nuclei is defined by the gradient ∂ESi(R)/∂R of the respective populated electronic state i. Excited state gradients are evaluated by solving the time-independent Schödinger equation for the electrons and a subsequent gradient calculation based on the Ehrenfest theorem 57,58. For the integration of the electronic Hamiltonian, the electronic expansion coefficients ck/j define the time dependent electronic population, where changes are induced by the quantum chemically derived coupling vector dkj(R), the velocity vector Ṙ (defined by the PES gradient) and the potential energy matrix Vk j which is diagonal in the adiabatic representation. Computational details of the NA-O-MD simulations are given in the SI.
2. Reconstruction of the excited state vibrational Hamiltonian
The NA-O-MD simulations yield trajectories of the electronic state potential energies Ei(t) together with the evolving nuclear geometries q(t) as classical objects. We follow the intramolecular high-frequency spectator modes (i.e. the C=O vibrations) whose frequencies are modulated during the dynamics in the bath of all other nuclear motions in the style of instantaneous normal mode analysis 59–62 where the spectator modes posses stable (real) eigenvalue during the dynamics. For low frequency skeleton motions the semi-classical signal representation looses validity as the modes can potentially evolve from stable to unstable (and vice versa). Here a full quantum propagation of the Green’s function according to eq. 2 and 3 is required. The standard approach for the calculation of vibrational frequencies is the diagonalization of the full (mass-weighted) Hessian matrix (within the harmonic approximation) yielding 3N − 6 vibrational eigenvalues and eigenvectors at time t. To follow the excited state dynamics of the C = O vibrations of nucleobases a block-diagonal Hessian can be constructed in an iterative subspace Davidson procedure 42, avoiding the calculation of the full excited state Hessian. This mode tracking procedure allows to follow the important modes in the spectrum which are know a priori without the need to calculate the full Hessian matrix. Thus, omitting unnecessary modes the numerical effort is decoupled from system size. The computational details of the mode tracking procedure are given in the SI.
3. IR intensities
We approximate the IR intensities by neglecting the nuclear coordinate dependence but taking into account the relative intensity of vibrational modes in the different electronic excited states (Frank-Condon approximation). Non-Codon effects can be incorporated by numerical differentiation of the excited state dipole moment with respect to the “fingerprint” normal modes qi.
Supplementary Material
Acknowledgments
We gratefully acknowledge the support of the National Institute of Health Grant No. GM-59230, National Science Foundation through Grant No. CHE-1058791, the Chemical Sciences, Geo-sciences and Biosciences Division, Office of Basic Energy Sciences, Office of Science and US Department of Energy. B. P. F. gratefully acknowledges support from the Alexandervon-Humboldt Foundation through the Feodor-Lynen program. We would like to tank the Leibniz-Rechenzentrum and the Greenplanet cluster (Grant No. CHE-0840513) for the allocation of computing resources.
Footnotes
The C = O vibrational frequencies are calculated on CAS(14/10) level of theory (Basis: 6-31G*). Due to the lack of dynamic electron correlation and the finite basis size vibrational frequencies appear blue shifted compared to experiment, comparison with the experimental vibrational spectrum (recorded at low temperatures in argon matrix) 49 suggests a scaling factor ≈ 0.86.
Supporting Information Available
Computational details of the non-adiabatic on-the-fly molecular dynamics and mode tracking procedure. Expressions for the Δ-dispersed signal S̄( ω ,T ; Δ). Discussion of the time evolution of the electronic states and populations. Supporting figures of the Δ-dispersed signal S̄( ω ,T ; Δ). This material is available free of charge via the Internet at http://pubs.acs.org/.
References
- 1.Crespo-Hernández CE, Cohen B, Hare PM, Kohler B. Ultrafast Excited-State Dynamics in Nucleic Acids. Chem Rev. 2004;104:1977–2020. doi: 10.1021/cr0206770. [DOI] [PubMed] [Google Scholar]
- 2.Middleton CT, de La Harpe K, Su C, Law YK, Crespo-Hernández CE, Kohler B. DNA Excited-State Dynamics: from Single Bases to the Double Helix. Ann Rev Phys Chem. 2009;60:217–239. doi: 10.1146/annurev.physchem.59.032607.093719. [DOI] [PubMed] [Google Scholar]
- 3.Schreier WJ, Schrader TE, Koller FO, Gilch P, Crespo-Hernández CE, Swaminathan VN, Carell T, Zinth W, Kohler B. Thymine Dimerization in DNA is an Ultrafast Photoreaction. Science. 2007;315:625–629. doi: 10.1126/science.1135428. [DOI] [PMC free article] [PubMed] [Google Scholar]
- 4.Schreier WJ, Kubon J, Regner N, Haiser K, Schrader TE, Zinth W, Clivio P, Gilch P. Thymine Dimerization in DNA Model Systems: Cyclobutane Photolesion is Predominantly Formed via the Singlet Channel. J Am Chem Soc. 2009;131:5038–5039. doi: 10.1021/ja900436t. [DOI] [PubMed] [Google Scholar]
- 5.Crespo-Hernández CE, Cohen B, Kohler B. Base Stacking Controls Excited-State Dynamics in A-T DNA. Nature. 2005;436:1141–1144. doi: 10.1038/nature03933. [DOI] [PubMed] [Google Scholar]
- 6.Markovitsi D, Talbot F, Gustavsson T, Onidas D, Lazzarotto E, Marguet S. Molecular Spectroscopy: Complexity of Excited-State Dynamics in DNA. Nature. 2006;441:E7. doi: 10.1038/nature04903. discussion E8. [DOI] [PubMed] [Google Scholar]
- 7.Vayá I, Gustavsson T, Miannay FA, Douki T, Markovitsi D. Fluorescence of Natural DNA: from the Femtosecond to the Nanosecond Time Scales. J Am Chem Soc. 2010;132:11834–11835. doi: 10.1021/ja102800r. [DOI] [PubMed] [Google Scholar]
- 8.Ullrich S, Schultz T, Zgierski MZ, Stolow A. Electronic Relaxation Dynamics in DNA and RNA Bases Studied by Time-Resolved Photoelectron Spectroscopy. Phys Chem Chem Phys. 2004;6:2796–2801. doi: 10.1021/ja030532q. [DOI] [PubMed] [Google Scholar]
- 9.Canuel C, Mons M, Piuzzi F, Tardivel B, Dimicoli I, Elhanine M. Excited States Dynamics of DNA and RNA bases: Characterization of a Stepwise Deactivation Pathway in the Gas Phase. J Chem Phys. 2005;122:074316. doi: 10.1063/1.1850469. [DOI] [PubMed] [Google Scholar]
- 10.Satzger H, Townsend D, Zgierski MZ, Patchkovskii S, Ullrich S, Stolow A. Primary Processes Underlying the Photostability of Isolated DNA Bases: Adenine. Proc Nat Acad Sci USA. 2006;103:10196–10201. doi: 10.1073/pnas.0602663103. [DOI] [PMC free article] [PubMed] [Google Scholar]
- 11.Perun S, Sobolewski A, Domcke W. Ab Initio Studies on the Radiationless Decay Mechanisms of the Lowest Excited Singlet States of 9H-Adenine. J Am Chem Soc. 2005;127:6257–6265. doi: 10.1021/ja044321c. [DOI] [PubMed] [Google Scholar]
- 12.Sobolewski AL, Domcke W, Dedonder-Lardeux C, Jouvet C. Excited-State Hydrogen Detachment and Hydrogen Transfer Driven by Repulsive 1πσ* States: A New Paradigm for Nonradiative Decay in Aromatic Biomolecules. Phys Chem Chem Phys. 2002;4:1093–1100. [Google Scholar]
- 13.Yamazaki S, Domcke W, Sobolewski AL. Nonradiative Decay Mechanisms of the Biologically Relevant Tautomer of Guanine. J Phys Chem A. 2008;112:11965–11968. doi: 10.1021/jp806622m. [DOI] [PubMed] [Google Scholar]
- 14.Barbatti M, Aquino AJA, Szymczak JJ, Nachtigallová D, Hobza P, Lischka H. Relaxation Mechanisms of UV-Photoexcited DNA and RNA Nucleobases. Proc Nat Acad Sci USA. 2010;107:21453–21458. doi: 10.1073/pnas.1014982107. [DOI] [PMC free article] [PubMed] [Google Scholar]
- 15.Ismail N, Blancafort L, Olivucci M, Kohler B, Robb MA. Ultrafast Decay of Electronically Excited Singlet Cytosine via a ππ* to nOπ* State Switch. J Am Chem Soc. 2002;124:6818–6819. doi: 10.1021/ja0258273. [DOI] [PubMed] [Google Scholar]
- 16.Matsika S. Radiationless Decay of Excited States of Uracil through Conical Intersections. J Phys Chem A. 2004;108:7584–7590. [Google Scholar]
- 17.Asturiol D, Lasorne B, Robb MA, Blancafort L. Photophysics of the π,π* and n,π* States of Thymine: MS-CASPT2 Minimum-Energy Paths and CASSCF on-the-Fly Dynamics. J Phys Chem A. 2009;113:10211–10218. doi: 10.1021/jp905303g. [DOI] [PubMed] [Google Scholar]
- 18.Gustavsson T, Bányász A, Lazzarotto E, Markovitsi D, Scalmani G, Frisch MJ, Barone V, Improta R. Singlet Excited-State Behavior of Uracil and Thymine in Aqueous Solution: a Combined Experimental and Computational Study of 11 Uracil Derivatives. J Am Chem Soc. 2006;128:607–619. doi: 10.1021/ja056181s. [DOI] [PubMed] [Google Scholar]
- 19.Hare PM, Crespo-Hernández CE, Kohler B. Internal Conversion to the Electronic Ground State Occurs via Two Distinct Pathways for Pyrimidine Bases in Aqueous Solution. Proc Nat Acad Sci USA. 2007;104:435–440. doi: 10.1073/pnas.0608055104. [DOI] [PMC free article] [PubMed] [Google Scholar]
- 20.Hudock HR, Levine BG, Thompson AL, Satzger H, Townsend D, Gador N, Stolow A, Martinez TJ. Ab Initio Molecular Dynamics and Time-Resolved Photoelectron Spectroscopy of Electronically Excited Uracil and Thymine. J Phys Chem A. 2007;111:8500–8508. doi: 10.1021/jp0723665. [DOI] [PubMed] [Google Scholar]
- 21.Nachtigallová D, Aquino AJA, Szymczak JJ, Barbatti M, Hobza P, Lischka H. Nonadiabatic Dynamics of Uracil: Population Split among Different Decay Mechanisms. J Phys Chem A. 2011;115:5247–5255. doi: 10.1021/jp201327w. [DOI] [PubMed] [Google Scholar]
- 22.Lan Z, Fabiano E, Thiel W. Photoinduced Nonadiabatic Dynamics of Pyrimidine Nucleobases: On-the-Fly Surface-Hopping Study with Semiempirical Methods. J Phys Chem B. 2009;113:3548–3555. doi: 10.1021/jp809085h. [DOI] [PubMed] [Google Scholar]
- 23.Selig U, Schleussner CF, Foerster M, Langhojer F, Nuernberger P, Brixner T. Coherent Two-Dimensional Ultraviolet Spectroscopy in Fully Noncollinear Geometry. Opt Lett. 2010;35:4178–4180. doi: 10.1364/OL.35.004178. [DOI] [PubMed] [Google Scholar]
- 24.Tseng CH, Sándor P, Kotur M, Weinacht TC, Matsika S. Two-Dimensional Fourier Transform Spectroscopy of Adenine and Uracil Using Shaped Ultrafast Laser Pulses in the Deep UV. J Phys Chem A. 2012;116:2654–2661. doi: 10.1021/jp207228b. [DOI] [PubMed] [Google Scholar]
- 25.West BA, Moran AM. Two-Dimensional Electronic Spectroscopy in the Ultraviolet Wavelength Range. J Phys Chem Lett. 2012;3:2575–2581. doi: 10.1021/jz301048n. [DOI] [PubMed] [Google Scholar]
- 26.Krebs N, Pugliesi I, Riedle E. Pulse Compression of Ultrashort UV Pulses by Self-Phase Modulation in Bulk Material. Appl Sci. 2013;3:153–167. [Google Scholar]
- 27.Widom JR, Johnson NP, von Hippel PH, Marcus AH. Solution Conformation of 2-Aminopurine Dinucleotide Determined by Ultraviolet Two-Dimensional Fluorescence Spectroscopy. New J Phys. 2013;15:025028. doi: 10.1088/1367-2630/15/2/025028. [DOI] [PMC free article] [PubMed] [Google Scholar]
- 28.West BA, Giokas PG, Molesky BP, Ross AD, Moran AM. Toward Two-Dimensional Photon Echo Spectroscopy with 200 nm Laser Pulses. Opt Express. 2013;21:2118–2125. doi: 10.1364/OE.21.002118. [DOI] [PubMed] [Google Scholar]
- 29.Anfinrud PA, Han C, Hochstrasser RM. Direct Observations of Ligand Dynamics in Hemoglobin by Subpicosecond Infrared Spectroscopy. Proc Nat Acad Sci USA. 1989;86:8387–8391. doi: 10.1073/pnas.86.21.8387. [DOI] [PMC free article] [PubMed] [Google Scholar]
- 30.Heyne K, Mohammed O, Usman A, Dreyer J, Nibbering E, Cusanovich M. Structural Evolution of the Chromophore in the Primary Stages of Trans/Cis Isomerization in Photoactive Yellow Protein. J Am Chem Soc. 2005;127:18100–18106. doi: 10.1021/ja051210k. [DOI] [PMC free article] [PubMed] [Google Scholar]
- 31.Mohammed OF, Pines D, Dreyer J, Pines E, Nibbering ETJ. Sequential Proton Transfer through Water Bridges in Acid-Base Reactions. Science. 2005;310:83–86. doi: 10.1126/science.1117756. [DOI] [PubMed] [Google Scholar]
- 32.Lim M, Jackson TA, Anfinrud PA. Binding of CO to Myoglobin from a Heme Pocket Docking Site to Form Nearly Linear Fe-C-O. Science. 1995;269:962–966. doi: 10.1126/science.7638619. [DOI] [PubMed] [Google Scholar]
- 33.Adamczyk K, Prémont-Schwarz M, Pines D, Pines E, Nibbering ETJ. Real-Time Observation of Carbonic Acid Formation in Aqueous Solution. Science. 2009;326:1690–1694. doi: 10.1126/science.1180060. [DOI] [PubMed] [Google Scholar]
- 34.Haiser K, Fingerhut BP, Heil K, Glas A, Herzog TT, Pilles BM, Schreier WJ, Zinth W, de Vivie-Riedle R, Carell T. Mechanism of UV-Induced Formation of Dewar Lesions in DNA. Angew Chem (Int Ed) 2012;51:408–411. doi: 10.1002/anie.201106231. [DOI] [PubMed] [Google Scholar]
- 35.Fingerhut BP, Herzog TT, Ryseck G, Haiser K, Graupner FF, Heil K, Gilch P, Schreier WJ, Carell T, de Vivie-Riedle R, Zinth W. Dynamics of Ultraviolet-Unduced DNA Lesions: Dewar Formation Guided by Pre-Tension Induced by the Backbone. New J Phys. 2012;14:065006. [Google Scholar]
- 36.Mohammed OF, Adamczyk K, Banerji N, Dreyer J, Lang B, Nibbering ETJ, Vauthey E. Direct Femtosecond Observation of Tight and Loose Ion Pairs upon Photoinduced Bimolecular Electron Transfer. Angew Chem (Int Ed) 2008;47:9044–9048. doi: 10.1002/anie.200803164. [DOI] [PubMed] [Google Scholar]
- 37.Kukura P, McCamant DW, Mathies RA. Femtosecond Stimulated Raman Spectroscopy. Ann Rev Phys Chem. 2007;58:461–488. doi: 10.1146/annurev.physchem.58.032806.104456. [DOI] [PubMed] [Google Scholar]
- 38.Umapathy S, Lakshmanna A, Mallick B. Ultrafast Raman Loss Spectroscopy. J of Raman Spect. 2009;40:235–237. [Google Scholar]
- 39.Kuramochi H, Takeuchi S, Tahara T. Ultrafast Structural Evolution of Photoactive Yellow Protein Chromophore Revealed by Ultraviolet Resonance Femtosecond Stimulated Raman Spectroscopy. J Phys Chem Lett. 2012;3:2025–2029. [Google Scholar]
- 40.Mukamel S, Biggs JD. Communication: Comment on the Effective Temporal and Spectral Resolution of Impulsive Stimulated Raman Signals. J Chem Phys. 2011;134:161101. doi: 10.1063/1.3581889. [DOI] [PMC free article] [PubMed] [Google Scholar]
- 41.Dorfman KE, Fingerhut BP, Mukamel S. Broadband Infrared and Raman Probes of Excited-State Vibrational Molecular Dynamics; Simulation Protocols Based on Loop Diagrams. Phys Chem Chem Phys. 2013 doi: 10.1039/c3cp51117k. submitted. [DOI] [PMC free article] [PubMed] [Google Scholar]
- 42.Reiher M, Neugebauer J. A Mode-Selective Quantum Chemical Method for Tracking Molecular Vibrations Applied to Functionalized Carbon Nanotubes. J Chem Phys. 2003;118:1634–1641. [Google Scholar]
- 43.Rahav S, Mukamel S. Ultrafast Nonlinear Optical Signals Viewed from the Molecules Perspective: Kramers-Heisenberg Transition Amplitudes vs. Susceptibilities. Adv At Mol, Opt Phys. 2010;59:223–263. [Google Scholar]
- 44.Cheng JX, Volkmer A, Book LD, Xie XS. Multiplex Coherent Anti-Stokes Raman Scattering Microspectroscopy and Study of Lipid Vesicles. J Phys Chem B. 2002;106:8493–8498. [Google Scholar]
- 45.Müller M, Schins JM. Imaging the Thermodynamic State of Lipid Membranes with Multiplex CARS Microscopy. J Phys Chem B. 2002;106:3715–3723. [Google Scholar]
- 46.Kee TW, Cicerone MT. Simple Approach to One-Laser, Broadband Coherent Anti-Stokes Raman Scattering Microscopy. Opt Lett. 2004;29:2701–2703. doi: 10.1364/ol.29.002701. [DOI] [PMC free article] [PubMed] [Google Scholar]
- 47.Volkmer A. Vibrational Imaging and Microspectroscopies Based on Coherent Anti-Stokes Raman Scattering Microscopy. J Phys D: Appl Phys. 2005;38:R59–R81. [Google Scholar]
- 48.von Vacano B, Meyer L, Motzkus M. Rapid Polymer Blend Imaging with Quantitative Broadband Multiplex CARS Microscopy. J Raman Spect. 2007;38:916–926. [Google Scholar]
- 49.Harsányi L, Császár P, Császár A, Boggs JE. Interpretation of the Vibrational Spectra of Matrix-Isolated Uracil from Scaled Ab Initio Quantum Mechanical Force Fields. Int J Quant Chem. 1986;29:799–815. [Google Scholar]
- 50.Delchev VB, Sobolewski A, Domcke W. Comparison of the Non-Radiative Decay Mechanisms of 4-Pyrimidinone and Uracil: an Ab Initio Study. Phys Chem Chem Phys. 2010;12:5007–5015. doi: 10.1039/b922505f. [DOI] [PubMed] [Google Scholar]
- 51.Fingerhut BP, Oesterling S, Haiser K, Heil K, Glas A, Schreier WJ, Zinth W, Carell T, de Vivie-Riedle R. ONIOM Approach for Non-Adiabatic On-The-Fly Molecular Dynamics Demonstrated for the Backbone Controlled Dewar Valence Isomerization. J Chem Phys. 2012;136:204307. doi: 10.1063/1.4720090. [DOI] [PubMed] [Google Scholar]
- 52.Hare PM, Middleton CT, Mertel KI, Herbert JM, Kohler B. Time-Resolved Infrared Spectroscopy of the Lowest Triplet State of Thymine and Thymidine. Chem Phys. 2008;347:383–392. doi: 10.1016/j.chemphys.2007.10.035. [DOI] [PMC free article] [PubMed] [Google Scholar]
- 53.Chong S, Min W, Xie XS. Ground-State Depletion Microscopy: Detection Sensitivity of Single-Molecule Optical Absorption at Room Temperature. J Phys Chem Lett. 2010;1:3316–3322. [Google Scholar]
- 54.Jung Y, Slipchenko MN, Liu CH, Ribbe AE, Zhong Z, Yang C, Cheng JX. Fast Detection of the Metallic State of Individual Single-Walled Carbon Nanotubes Using a Transient-Absorption Optical Microscope. Phys Rev Lett. 2010;105:217401. doi: 10.1103/PhysRevLett.105.217401. [DOI] [PubMed] [Google Scholar]
- 55.Sheps T, Brocious J, Corso BL, Gül OT, Whitmore D, Durkaya G, Potma EO, Collins PG. Four-Wave Mixing Microscopy with Electronic Contrast of Individual Carbon Nanotubes. Phys Rev B. 2012;86:235412. [Google Scholar]
- 56.Barbatti M, Granucci G, Persico M, Ruckenbauer M, Vazdar M, Eckert-Maksić M, Lischka H. The On-The-Fly Surface-Hopping Program System Newton-X: Application to Ab Initio Simulation of the Nonadiabatic Photodynamics of Benchmark Systems. J Photochem Photobiol A. 2007;190:228–240. [Google Scholar]
- 57.Warshel A. Bicycle-Pedal Model for the First Step in the Vision Process. Nature. 1976;260:679–683. doi: 10.1038/260679a0. [DOI] [PubMed] [Google Scholar]
- 58.Tully JC. Molecular Dynamics with Electronic Transitions. J Chem Phys. 1990;93:1061–1071. [Google Scholar]
- 59.Buchner M, Ladanyi BM, Stratt RM. The Short-Time Dynamics of Molecular Liquids. Instantaneous-Normal-Mode Theory. J Chem Phys. 1992;97:8522–8535. [Google Scholar]
- 60.Moore P, Keyes T. Normal Mode Analysis of Liquid CS2: Velocity Correlation Functions and Self-Diffusion Constants. J Chem Phys. 1994;100:6709–6717. [Google Scholar]
- 61.Nguyen PH, Stock G. Nonequilibrium Molecular-Dynamics Study of the Vibrational Energy Relaxation of Peptides in Water. J Chem Phys. 2003;119:11350–11358. [Google Scholar]
- 62.Bastida A, Soler MA, Zuniga J, Requena A, Kalstein A, Fernandez-Alberti S. Instantaneous Normal Modes, Resonances, and Decay Channels in the Vibrational Relaxation of the Amide I Mode of N-Methylacetamide-D in Liquid Deuterated Water. J Chem Phys. 2010;132:224501. doi: 10.1063/1.3435212. [DOI] [PubMed] [Google Scholar]
Associated Data
This section collects any data citations, data availability statements, or supplementary materials included in this article.