

Abstract
Short-term abstinent alcoholics have shown increased engagement of reward regions and reduced engagement of executive control regions. There is no report yet on whether these differences can predict relapse. This is the first study that investigates whether differences in resting-state networks can predict later relapse. Resting-state functional magnetic resonance imaging data were collected from 69 short-term abstinent alcoholics. Participants performed the affective go/no-go task outside of the scanner. At 6-month follow-up, participants were grouped as abstainers (N = 40; age: M = 46.70, standard deviation [SD] = 6.83) and relapsers (N = 29; age: M = 46.91, SD = 7.25). We examined baseline resting-state synchrony (RSS) using seed-based measures. Compared with abstainers, relapsers showed significantly decreased RSS within both the reward and executive control networks as well as within the visual network (P < 0.05). Lower RSS in relapsers could predict relapse (P < 0.05) and was significantly correlated with poor inhibitory control of emotional-laden stimuli (P < 0.017) and with alcohol use (P < 0.05). Results suggest that lower RSS during short-term abstinence may predict subsequent relapse. The association of lower RSS with poorer inhibitory control suggests that low RSS may constitute a faulty foundation for future responses to external cues, which can be manifested as the inability to inhibit behavior.
Keywords: abstinence, alcohol, fMRI, relapse, resting-state networks
Introduction
Alcohol dependence is a disorder with both an impulsive and compulsive “drive” toward alcohol consumption combined with an inability to inhibit its consumption despite negative consequences (Kamarajan et al. 2005). Specific brain networks mediate these behavioral components. Alcohol-dependent participants have shown increased engagement of regions in the bottom-up reward network when exposed to alcohol cues (Braus et al. 2001; Myrick et al. 2004) and have also shown decreased engagement of regions in the top-down inhibitory control network when required to inhibit prepotent responses (Goldstein and Volkow 2002; Goldstein et al. 2004; Akine et al. 2007; Li et al. 2009). There is evidence suggesting that the function of these neural networks mediates the maintenance of addictive behavior and is crucially involved in achieving and maintaining abstinence relapse in alcoholics who attempt recovery (Grüsser et al. 2004; Heinz et al. 2007; Sinha 2007; Park et al. 2010).
In a recent study by our group, we found specific differences in resting-state synchrony (RSS; temporal correlations of resting-state fluctuations) within the reward and the executive control networks in individuals with long-term abstinence (Camchong et al. forthcoming). We found that, in comparison with non-alcoholic controls, RSS in long-term abstinent alcoholics was characterized by an attenuated synchrony of regions that mediate reward processing and an enhanced synchrony of regions that mediate executive control of emotion and behavior. There is no report yet on whether RSS differences in subjects during early stages of abstinence predict relapse vulnerability. The current study examines RSS within the reward and executive control networks in short-term abstinent alcoholics with subsequent follow-up in which abstinence maintenance was determined.
Even though there have been no studies investigating resting-state networks in short-term abstinent alcoholics who subsequently relapse, neuroimaging studies have identified other potential neural markers for vulnerability to relapse. Structural brain data have provided evidence of an association between relapse and smaller brain volumes, lower cortical thickness, and lower cortical surface area in regions within the executive control networks (i.e. medial prefrontal and lateral prefrontal cortex; Cardenas et al. 2011; Durazzo et al. 2011; Rando et al. 2011). Frontal white-matter integrity (as measured with diffusion tensor imaging) has recently shown that alcoholics who subsequently relapse have lower white-matter integrity in frontal white-matter tracts than individuals that remain abstinent (at a 6-month follow-up; Sorg et al. 2012). Cortical perfusion data have shown that individuals that relapse to alcohol use have lower frontal gray-matter perfusion when compared with abstainers (Durazzo et al. 2010). Electrophysiological studies have found that alcoholics have increased beta power (a resting electroencephalogram rhythm previously associated with lack of inhibition) when compared with healthy controls (Porjesz et al. 2005), and these findings have been found to be more pronounced in relapsers than in abstainers (Saletu-Zyhlarz et al. 2004). Functional magnetic resonance imaging (fMRI) studies have reported that relapsers show increased activity in reward regions (i.e. putamen, nucleus accumbens (NAcc), and medial prefrontal cortex) when viewing alcohol cues (Grüsser et al. 2004) or reduced activity in reward regions (i.e. thalamus and NAcc) when viewing positive stimuli (Heinz et al. 2007). A recent study that examined synchrony of signal fluctuations, while nicotine addicts performed an emotional Stroop task, found that when compared with abstainers, relapsers had reduced synchrony of task-evoked signal fluctuations between insula and frontal regions (Janes et al. 2010). Taken together, these findings suggest that individuals that relapse have structural and functional differences within the reward and executive control networks.
The above findings of specific differences in neural functioning between subjects that relapse versus those who do not are based on differences in neural activation elicited by external stimuli. Brain activity in response to stimuli is influenced by the internal organization of ongoing brain activity during rest. There is evidence that the brain's internal functional organization, which can be measured by examining the synchrony of resting-state fluctuations, builds representations and updates information to serve as foundations for future responses to external stimuli (Gour et al. 2011; Koyama et al. 2011; Mennes et al. 2011; Zhu et al. 2011). Therefore, an increasing body of research on resting-state fluctuations has shown the importance of examining neural network synchrony during rest in clinical disorders such as substance dependence (Hong et al. 2009; Ma et al. 2010; Camchong, MacDonald, Nelson et al. 2011; Kelly et al. 2011). Individual differences in intrinsic neural activity during rest may reveal an ongoing mechanism that influences how alcohol-dependent subjects manage at-risk situations that could result in relapse.
Alcohol-dependent individuals with shorter periods of abstinence are more susceptible to relapse. Only one study by Chanraud et al. (2011) has examined RSS in short-term abstinent alcohol dependence (abstinent for 66.5 ± 32.4 days). In contrast with our previous study in which we examined RSS within the reward and executive control networks in long-term abstinent alcoholics (Camchong et al. forthcoming). Chanraud et al. (2011) examined RSS within the default mode network in short-term abstinent alcoholics. They found that short-term abstinent alcoholics' RSS between a posterior cingulate and cerebellar regions is lower during rest but higher during working memory task performance. Chanraud et al. (2011) reported that length of abstinence was correlated with the efficiency of the connectivity between regions in the default mode network. There is no report, however, on the relationship between resting-state fluctuations and relapse in alcohol dependence.
The high rate of relapse found in individuals attempting abstinence has been associated with an individual's inability to effectively inhibit alcohol consumption when confronted with high-risk situations. Numerous studies have shown that the common denominator of high-risk situations that precipitate relapse is the need to regulate emotion (i.e. negative affect). In a retrospective study, individuals with alcohol dependence have reported that the most frequent precipitants for relapse were problems with regulating negative emotional state (Hodgins et al. 1995). When examining the association between emotion-regulation skills and alcohol use during and after treatment in individuals with alcohol dependence, a recent study found that the ability to tolerate negative emotions predicted the inability to inhibit alcohol consumption after treatment (Berking et al. 2011). Taken together, an important behavioral factor related to relapse in individuals with alcohol dependence is the ability to inhibit a prepotent behavior (resume substance use) when presented with emotional laden situations (e.g. stress, anxiety, depression). The present study investigated the association between emotional response inhibition (measured with the affective go/no-go task [AGN]) and a resting-state network known to mediate emotional regulation (subgenual anterior cingulate cortex [sgACC]; Kelly et al. 2009). The AGN requires the inhibition of a motor response to emotional-laden stimuli and is known to be mediated by anterior cingulate cortex (Albert et al. 2011).
The aims for the present study are to investigate whether RSS during short-term abstinence is different in individuals that subsequently relapse versus individuals that do not and whether these differences are related to inhibitory control in the processing of emotion-laden stimuli. The present study examined RSS in short-term (6–15 weeks) abstinent alcoholics (M = 74.33 days of abstinence; standard deviation [SD] = 18.55). In a session prior to scanning, participants performed the AGN task. After 6 months, participants were contacted and asked whether they had abstained or relapsed and previously collected resting fMRI data were grouped according to outcome for comparisons. Relapse was defined as any use of alcohol or other substance (except nicotine) during any time after participating in the study. RSS within regions found to be significantly different between relapsers and abstainers was examined for its association with performance in a task requiring emotional inhibitory control (AGN task).
Based on our previous findings (Camchong et al. forthcoming), we hypothesized that RSS during early stages of abstinence in alcohol dependence would be different in subjects who subsequently relapse versus those who do not. We hypothesized that when compared with abstainers, relapsers will have: 1) An enhanced synchrony of limbic regions within the bottom-up reward network and 2) an attenuated synchrony of frontal regions within the top-down inhibitory control network when compared with alcohol dependents that remained abstinent. Finally, we hypothesized that RSS strength within the sgACC would be related to quality of performance in a task assessing inhibitory control when presented with emotion-laden stimuli (AGN task).
Materials and Methods
Participants
All subjects were recruited from the island of Oahu as part of a larger study conducted to compare samples of long-term abstinent alcoholics, short-term abstinent alcoholics, and non-substance abusing controls (NSAC). Because the present study focuses on identifying neural network differences in alcohol-dependent individuals that have relapsed, we focused on the short-term abstinent alcoholic sample and on the non-substance abusing control sample. All participants provided written informed consent and received monetary compensation for the time spent participating. The consent process and all procedures were reviewed and approved by the institutional review board at Queens Medical Center prior to initiating studies. Short-term abstinent alcoholics were required to have between 6 and 15 weeks of abstinence at study entry. A total of 100 short-term abstinent alcoholics were recruited for behavioral testing and interviews. From the 100 total subjects, 28 did not have a fMRI scan for the following reasons: 5 subjects were recruited at the beginning of the study when resting fMRI was not collected, 7 relapsed before the scanning session, 6 had metal in their body, 4 were claustrophobic, 2 were too big to fit in the scanner, 1 moved outside of the island before the scanning session, 2 did not show to the scanning session and were no longer reachable, and 1 had excessive motion artifacts during resting fMRI session resulting in unusable data. As a result, the resting fMRI data was available for 72 short-term abstinent individuals (Table 1). All subjects met DSM-IV lifetime criteria for alcohol dependence (American Psychiatric Association 1994) and 41 had lifetime comorbid drug dependence (Table 2). Subjects also completed the computerized diagnostic interview schedule (cDIS; Levitan et al. 1991) to ascertain externalizing, anxiety or mood disorder diagnoses, and symptom counts (Table 3).
Table 3.
Current and lifetime psychiatric diagnoses in relapsers (REL) and abstainers (ABS)
| Psychiatric diagnoses | Lifetime diagnoses |
Current diagnoses |
||||||
|---|---|---|---|---|---|---|---|---|
| REL (n = 29) |
ABS (n = 40) |
Odds ratio | Sig. | REL (n = 29) |
ABS (n = 40) |
Odds ratio | Sig. | |
| Count (n) | Count (n) | Count (n) | Count (n) | |||||
| Internalizing disorders | 16 | 25 | 0.64 | 0.54 | 9 | 17 | 0.53 | 0.33 |
| Mood | 12 | 23 | 0.52 | 0.19 | 8 | 17 | 0.47 | 0.20 |
| Dysthymia | 1 | 0 | 1 | 0.24 | 1 | 0 | ∞ | 0.23 |
| Manic episode | 1 | 4 | 0.25 | 0.30 | 0 | 4 | ∞ | 0.08 |
| Hypomanic | 0 | 0 | N/A | N/A | 0 | 0 | N/A | N/A |
| Major depressive disorder | 9 | 19 | 0.47 | 0.17 | 6 | 13 | 0.46 | 0.28 |
| Bipolar | 2 | 4 | 0.5 | 0.65 | 1 | 4 | 0.25 | 0.30 |
| Anxiety | 9 | 11 | 0.82 | 0.75 | 5 | 6 | 0.83 | 0.80 |
| Agoraphobia | 3 | 1 | 3 | 0.17 | 0 | 0 | N/A | N/A |
| Obsessive compulsive | 0 | 0 | N/A | N/A | 0 | 0 | N/A | N/A |
| Panic disorder | 1 | 1 | 1 | 0.82 | 0 | 0 | N/A | N/A |
| Social phobia | 0 | 0 | N/A | N/A | 0 | 0 | N/A | N/A |
| Post-traumatic stress disorder | 7 | 10 | 0.7 | 0.93 | 5 | 6 | 0.83 | 0.80 |
| Externalizing disorders | 10 | 7 | 1.43 | 0.11 | 3 | 1 | 3 | 0.17 |
| Attention deficit hyperactivity disorder | 4 | 2 | 2 | 0.20 | 3 | 1 | 3 | 0.17 |
| Antisocial personality disorder | 8 | 5 | 1.6 | 0.25 | 5 | 2 | 2.5 | 0.20 |
| Conduct disorder | 0 | 0 | N/A | N/A | 0 | 0 | N/A | N/A |
Note: Group differences were tested with χ2 test. χ2 significance is shown in Sig. column.
Table 1.
Demographics, treatment information and alcohol use measures in short-term abstinent alcoholics
| Characteristic | Abstainers (n = 40) |
Relapsers (n = 29) |
t | Sig. (2-tailed) | Effect size partial η2 | Odds ratio | ||
|---|---|---|---|---|---|---|---|---|
| Mean or n | SD or % | Mean or n | SD or % | |||||
| Age (years) | 46.70 | 6.83 | 46.91 | 7.25 | 0.12 | 0.90 | 0.0002 | — |
| Education (years) | 13.98 | 2.33 | 13.21 | 2.14 | 1.42 | 0.16 | 0.028 | — |
| Female, n (%) | 20 | 50.00% | 9 | 31.03% | — | — | — | 2.22 |
| Mandated for abstinence by court, n (%) | 17 | 42.50% | 7 | 24.14% | — | — | — | 2.42 |
| Attended residential treatment, n (%) | 14 | 35.00% | 8 | 27.59% | — | — | — | 1.75 |
| Attended intensive outpatient treatment, n (%) | 6 | 15.00% | 5 | 17.24% | — | — | — | 1.20 |
| Alcohol lifetime dose (standard drinks per month) | 184.83 | 207.85 | 196.82 | 152.97 | 0.28 | 0.78 | 0.001 | — |
| Alcohol lifetime use duration (months) | 318.53 | 98.12 | 346.55 | 87.11 | 0.63 | 0.53 | 0.022 | |
| Dose during peak use (number of drinks per month) | 381.94 | 344.62 | 371.38 | 325.06 | 0.13 | 0.90 | 0.0002 | — |
| Length of abstinence until MRI session (number of days) | 76.65 | 18.24 | 71.14 | 18.82 | 1.22 | 0.23 | 0.022 | — |
Note: SD, standard deviation.
Table 2.
Mean symptom counts of lifetime and current dependence of alcohol and other drugs in (A) all STAA participants, (B) STAA participants with history of alcohol dependence only, and (C) STAA participants with history of alcohol and drug dependence
| Alcohol |
Cocaine |
METH |
Marihuana |
Nicotine |
||||||
|---|---|---|---|---|---|---|---|---|---|---|
| LSx* | CSx* | LSx* | CSx | LSx | CSx | LSx | CSx | LSx | CSx | |
| (A) | ||||||||||
| Abstainers (N = 40) | 5.80 | 5.20 | 2.28 | 0.68 | 2.50 | 1.98 | 1.38 | 0.57 | 1.98 | 1.55 |
| Relapsers (N = 29) | 6.38 | 6.07 | 0.79 | 0.28 | 2.48 | 1.38 | 1.24 | 0.52 | 1.52 | 1.21 |
| LSx | CSx | LSx | CSx | LSx | CSx | LSx | CSx | LSx | CSx | |
| (B) | ||||||||||
| Abstainers (N = 16) | 5.81 | 5.31 | 0.00 | 0.00 | 0.00 | 0.00 | 0.44 | 0.00 | 1.38 | 1.25 |
| Relapsers (N = 12) | 6.42 | 6.17 | 0.08 | 0.08 | 0.00 | 0.00 | 0.67 | 0.00 | 0.75 | 0.75 |
| LSx | CSx | LSx** | CSx | LSx | CSx | LSx | CSx | LSx | CSx | |
| (C) | ||||||||||
| Abstainers (N = 24) | 5.79 | 5.13 | 3.79 | 1.13 | 4.17 | 3.29 | 2.00 | 0.96 | 2.38 | 1.75 |
| Relapsers (N = 17) | 6.35 | 6.00 | 1.29 | 0.41 | 4.24 | 2.35 | 1.65 | 0.88 | 2.06 | 1.53 |
Note:METH, methamphetamine; LSx, lifetime symptom count; CSx, current symptom count; short-term abstinent alcoholics.
*Significant group differences with P < 0.05.
**Significant group differences with P < 0.01.
Table 4.
List of substances that individuals in the relapsing group reported to have used when they relapsed
| Relapsers | Relapsed to | Specific substance information |
|---|---|---|
| Subject 1 | Alcohol only | 15 beers |
| Subject 2 | Alcohol only | 10 standard mixed drinks |
| Subject 3 | Alcohol only | 6 beers + 4 shots |
| Subject 4 | Alcohol only | 2 standard mixed drinks |
| Subject 5 | Alcohol only | 10 standard mixed drinks |
| Subject 6 | Alcohol only | 6 standard mixed drinks |
| Subject 7 | Alcohol only | 12 standard mixed drinks |
| Subject 8 | Alcohol only | 9 standard mixed drinks |
| Subject 9 | Alcohol only | 15 standard mixed drinks |
| Subject 10 | Alcohol only | 40 standard mixed drinks |
| Subject 11 | Alcohol only | 4 standard mixed drinks |
| Subject 12 | Alcohol only | 40 standard mixed drinks |
| Subject 13 | Alcohol only | 10 standard mixed drinks |
| Subject 14 | Alcohol only | 6 standard mixed drinks |
| Subject 15 | Alcohol only | 3 standard mixed drinks |
| Subject 16 | Alcohol only | 4 standard mixed drinks |
| Subject 17 | Alcohol only | 8 standard mixed drinks |
| Subject 18 | Alcohol only | 6 standard mixed drinks |
| Subject 19 | Alcohol + drugs | 10 beers + 0.5 g marihuana |
| Subject 20 | Alcohol + drugs | 4 standard mixed drinks + 0.75 g of methamphetamine |
| Subject 21 | Alcohol + drugs | 14 standard mixed drinks + 0.33 g of marihuana |
| Subject 22 | Alcohol + drugs | 6 standard mixed drinks + 0.5 g of methamphetamine + 0.5 g of marihuana |
| Subject 23 | Alcohol + drugs | 6 standard mixed drinks + 1 g of methamphetamine |
| Subject 24 | Drugs only | 0.5 oz cocaine |
| Subject 25 | Drugs only | 5 g methamphetamine |
| Subject 26 | Drugs only | 1.5 g of methamphetamine |
| Subject 27 | Drugs only | 0.25 g of methamphetamine |
| Subject 28 | Drugs only | 1 g methamphetamine |
| Subject 29 | Drugs only | 0.25 g of methamphetamine |
A breathalyzer test to screen for alcohol (Alco-Sensor IV, Intoximeters, Inc., Saint Louis, MO, United States of America) and a saliva screen for drugs (Oral Fluid Drug Screen Device, Innovacon, Inc., San Diego, CA, United States of America) were performed for all subjects on each testing day, with negative findings required for participation (no subjects failed the screens). Participants received monetary compensation for their participation. All subjects' substance use history was gathered using the Lifetime Drinking History instrument designed by Skinner and Sheu (1982) using the timeline follow-back methodology and administered separately for alcohol and for each other substance used (excluding caffeine). Exclusion criteria for both groups included: 1) Significant history of head trauma or cranial surgery; 2) current or lifetime history of diabetes, stroke, or hypertension that required medical intervention; 3) current or lifetime history of a significant neurological disorder; 4) clinical or laboratory evidence of active hepatic disease; 5) clinical evidence for Wernicke–Korsakoff syndrome, and 6) lifetime diagnosis of schizophrenia or schizophreniform disorder (as assessed by the cDIS). Nicotine use was recorded but use was not an exclusion criterion.
Six months after the scanning session, the 72 short-term abstinent alcoholic subjects were contacted and asked whether they abstained or relapsed. Because 3 subjects were no longer reachable (4.17% attrition), 69 of the remaining subjects were classified as either relapsers or abstainers. Subjects were considered to have relapsed if they had consumed at least one drink, or used any other illegal substance (i.e. methamphetamine, marihuana, cocaine, Table 4). Twenty-nine subjects reported to have relapsed and 40 reported to have remained abstinent. From the 29 individuals that relapsed, 62.07% relapsed to alcohol only, 17.24% relapsed to a combination of alcohol and drugs, and 20.69% relapsed to drugs only (Table 4). Relapsers and abstainers did not differ by age, gender, years of education, alcohol lifetime dose, dose during peak use, or length of alcohol abstinence prior to the initial functional connectivity magnetic resonance imaging (fcMRI) session (Table 1). In addition, abstainers and relapsers did not have significant differences in the number of first- or second-degree relatives with alcohol (t(1,67) = 0.73, P = 0.47) or drug (t(1,67) = 0.84, P = 0.41) use problems. Relapsers had higher lifetime and current alcohol dependence symptom count at the initial assessment (Table 2A). When comparing subjects with lifetime history of alcohol dependence only (Table 2B) and those with comorbidity with other drugs only (Table 2C), these differences were not observed.
Affective Go/No-Go Task Performance
All subjects performed the AGN (from the Cambridge Automated Neuropsychological Test Battery [Cambridge Cognition Ltd.]) test outside of the scanner. AGN task performance involves emotion-modulated response inhibition as is known to be mediated by frontal networks including anterior cingulate cortex (Albert et al. 2011). During the AGN task, series of words were rapidly presented in the center of a computer screen. Words fell into 3 valences: Positive (e.g. joyful, warmth, courage), negative (e.g. mistake, hopeless, burden), or neutral (e.g. pause, item, element). Each block contained words of only 2 valences, either: Positive and negative, positive and neutral, or neutral and negative. Each word within each series was presented for 300 ms with an interval between the words of 900 ms. There were twenty 18-word blocks. Before each series of words was presented, subjects were given a target valence (positive, neutral, or negative) and were asked to respond by pressing the pad as quickly as possible when they see a word that matches the target valence (go trial). Subjects needed to inhibit their response when a distractor valence (not target valence) was presented (no-go trial).
Three metrics can be measured from performance in the AGN task: Latency, commission errors (incorrect button press to a distractor stimulus), and omission errors (missed button press to a target stimulus). Each of these metrics was measured under each valence (positive, negative, and neutral). Because we were interested in examining how emotional inhibitory control was related to differences in RSS during alcohol abstinence, we focused our analysis on commission errors, or the inability to inhibit a prepotent response when a distractor stimulus was presented.
Imaging Data Acquisition
Imaging acquisition and pre-processing sections are very similar to our previous study of long-term abstinent alcoholics (Camchong et al. 2012). Resting-state fcMRI data were collected using a 12-channel head coil on a Siemens Tim Trio 3.0 T scanner (Siemens Medical Solutions, Erlangen, Germany) located at Queen's Medical Center in Honolulu. Subjects were instructed to lay motionless in the scanner with their eyes closed. The imaging sequence was a gradient-echo spiral in/out sequence with parameters of echo time (TE) = 30 ms, repetition time (TR) = 2000 ms, flip angle = 60°, 28 interleaved axial 5-mm thick contiguous slices, field of view (FOV) = 22 cm, and a 3.44 × 3.44-mm in-plane resolution (64 × 64 matrix size; Noll et al. 1995; Glover and Law 2001). Images were reconstructed using a custom gridding reconstruction program with a field map-based off-resonance correction (Jackson et al. 1991; Noll et al. 1991). Spiral-in and spiral-out images were magnitude squared summed to improve signal-to-noise and to recover signal loss caused by susceptibility variations in the brain. The fcMRI scan acquired a total of 123 volumes with a total scan time of 4:06. The first 3 volumes were discarded from the data analysis to ensure magnetization reached steady state. The last volume was acquired (TE = 31 ms) for field-map measurement and was excluded from fcMRI analysis.
A high-resolution T1-weighted structural image was acquired using an MPRAGE sequence with parameters of TE = 4.11 ms TR = 2200 ms, flip angle = 12°, 160 sagittal slices, slice thickness = 1 mm, slice gap = 0.5 mm, FOV = 256 mm. The T1-weighted image was used in the data analysis for image registration purposes.
fcMRI Data Preprocessing
All imaging data was preprocessed using analysis of functional neuroimages (AFNI) and FMRIB Software Libraries (FSL; Oxford, United Kingdom). Preprocessing consisted of: Dropping first 3 TRs to account for magnetic field homogenization; slice time correction; 3-dimensional motion correction (AFNI: 3dvolreg); skull stripping; temporal despiking; spatial smoothing (full-width at half-maximum [FWHM] = 6 mm); mean-based intensity normalization; temporal band-pass filtering (0.009–0.1 Hz); and linear and quadratic detrending. Three-dimensional motion correction calculation provided motion correction parameters for each participant for translation in the x, y, and z planes and for rotation (pitch, roll, and yaw). Groups did not differ in averaged motion correction parameters for translation (t(1,67) = 0.092, P = 0.925) or rotation (t(1,67) = 0.426, P = 0.717).
Probabilistic independent component analysis was conducted for each individual to denoise an individual data by removing components that represented noise such as head motion (i.e. “rim-like” artifacts around the brain), scanner artifacts (i.e. slice dropouts, high-frequency noise, field inhomogeneities), and physiological noise (i.e. respiration, cardiac frequencies, white matter, cerebrospinal fluid fluctuations). Noise components were selected by spatial and temporal characteristics detailed in the MELODIC (FSL) manual (http://fmrib.ox.ac.uk/fslcourse/lectures/melodic.pdf), based on Kelly et al. (2010) and applied in our previous papers (Camchong, MacDonald, Bell et al. 2011; Camchong, MacDonald, Nelson et al. 2011). A between-groups t-test conducted to look for differences in the sum of total percent variance accounted for by components removed showed greater noise in relapsers versus abstinence maintainers (t(1,67) = 2.21, P = 0.03)). An analysis of covariance (ANCOVA) controlling for this measure was conducted to investigate whether differences in percent variance due to noise affected group differences in RSS.
All image registrations were conducted with FSL-FLIRT (FMRIB's Linear Image Registration Tool) which uses an automated linear (affine) registration (Jenkinson et al. 2002). First, each individual's preprocessed and denoised fcMRI data was registered to individual's high-resolution T1-weighted structural image (with 6 degrees of freedom) which generated a transformation matrix file. The high-resolution T1-weighted structural image was then registered to a standard Montreal Neurological Institute (MNI-152) brain (with 12 degrees of freedom) which generated a second transformation matrix file. These 2 transformation matrices were used to register each individual's preprocessed and denoised fcMRI data to MNI standard space to be used for group analysis.
Region of Interest Selection and Seed Generation
A previous study from our group reported significant differences between long-term abstinent alcoholics and NSAC in resting-state networks generated with seeds in NAcc and sgACC. The present study used these same regions as seeds to generate the reward and executive control networks, respectively (Camchong et al. forthcoming).
To examine RSS within the bottom-up network, a spherical seed with 3.5-mm radius was placed at left and right NAcc based on the Talaraich Daemon atlas from AFNI (Lancaster et al. 2000; center of mass MNI coordinates: x = ±12, y = 10, z = −9 mms). The left and right NAcc were first analyzed separately, but because results were highly similar (e.g. r = 0.81, P = 7.47E-12), left and right seeds were combined. To examine RSS within the top-down network, a spherical seed with 3.5-mm radius was placed at the sgACC region with the same coordinates as previously described in Kelly et al. (2009; center of mass MNI coordinates: x = 5, y = 25, z = −10 mms).
Resting-State Individual-Level Analysis
For each participant and for each seed (sgACC and NAcc), an average time-series was extracted (3dROIstats, AFNI). A multiple regression analysis (3dfim+, AFNI) on the denoised data was performed between the extracted average time-series from the seed and all voxels in the brain. This analysis generated a correlational map with a correlation coefficient r for each voxel, for each individual, and for each seed. Correlation coefficients (r) were transformed to standardized z values (3dcalc, AFNI). All voxels in the resulting standardized z-maps showed the degree of positive or negative correlations with the corresponding seed averaged time-series for each seed for each participant.
Resting-State Group-Level Analysis
Group-level analyses were carried out on individual standardized z-maps by conducted an independent-samples t-test (3dttest, AFNI). Group-level analyses produced t-statistics maps showing between group differences at each voxel for each seed. To control for false-positive findings, a threshold/cluster method derived from Monte Carlo simulations (AlphaSim, AFNI; Ward 2000) was applied to all maps generated in the group-level analysis. Monte Carlo simulations (1000 iterations) accounted for the FWHM Gaussian filter for each t-map (i.e. 6 FWHM; 3dFWHMx, AFNI) with a connectivity radius of 7.1 mm. On the basis of these simulations, the family-wise ± of 0.05 was preserved with an a priori voxel-wise probability of 0.001 and 3-dimensional clusters with a minimum volume of 1204 ± μL (151 voxels). Resulting clustered and thresholded t-maps corrected for multiple comparisons showed differences in RSS between abstainers and relapsers.
A second-level analysis was conducted to investigate whether RSS differences between groups were due to differences in the percent of variance accounted for by noise. The mean z-scores from the regions where significant differences were found between groups were extracted. An ANCOVA was conducted using strength of RSS (mean z-scores) within regions found to be significantly different between groups (Tables 6 and 7) as the dependent variables, group membership as an independent variable, and the sum of total percent variance accounted for by components removed (see above under section fcMRI Data Preprocessing) as a covariate.
Table 6.
Identification of anatomy, hemispheric location (L/R), coordinates (x, y, z) in MNI space (mm), analysis of covariance results statistics, and effect size for the difference within clusters in which relapsers showed significantly lower RSS than abstainers within the (A) NAcc RSS map and (B) sgACC RSS map
| Anatomy of regions within identified clusters | L/R | x | y | z | F | Sig. (2-tailed) | Effect size partial η2 |
|---|---|---|---|---|---|---|---|
| (A) NAcc network differences | |||||||
| Inferior temporal gyrus and fusiform gyrus | R | 50 | −40 | −24 | 16.023 | 0.0002*** | 0.20 |
| Insula/putamen/lentiform nucleus | L | −34 | −22 | 0 | 18.48 | 0.0001*** | 0.22 |
| R | 30 | −12 | 14 | ||||
| Dorsal ACC and dorsolateral prefrontal cortex | L | −12 | 40 | 6 | 11.73 | 0.0011** | 0.15 |
| Thalamus/lentiform nucleus | L | −14 | −14 | −2 | 14.83 | 0.0003*** | 0.18 |
| Precuneus | L | −16 | −52 | 34 | 16.17 | 0.0002*** | 0.20 |
| (B) SgACC network differences | |||||||
| Temporal gyrus | L | −43 | −9 | −37 | 10.31 | 0.002** | 0.14 |
| R | 44 | −11 | −37 | ||||
| Dorsolateral prefrontal Cortex | L | −23 | 54 | −4 | 10.22 | 0.002** | 0.13 |
| Insula | L | −44 | −27 | 13 | 11.37 | 0.001** | 0.15 |
| R | 39 | −29 | 16 | ||||
| 39 | −15 | −7 | |||||
| Lentiform nucleus/putamen | L | −18 | −16 | −6 | 9.33 | 0.003** | 0.12 |
| Thalamus | R | 20 | −17 | 4 | 8.16 | 0.006** | 0.11 |
| Middle occipital gyrus | L | −28 | −74 | 13 | 7.69 | 0.007** | 0.10 |
Note: Significant group differences with **P < 0.01 and ***P < 0.001. L, left; R, right; MNI, Montreal Neurological Institute; NAcc, nucleus accumbens; sgACC, subgenual anterior cingulate cortex; ACC, anterior cingulate cortex; RSS, resting-state synchrony; ANCOVA, analysis of covariance.
Table 7.
Identification of anatomy, hemispheric location (L/R), coordinates (x, y, z) in MNI space (mm), analysis of covariance (ANCOVA) results statistics, and effect size for the difference within clusters in which relapsers showed significantly lower RSS than abstainers within the (A) middle occipital gyrus RSS map. ANCOVA results showed a trend of lower RSS in relapsers than abstainers within the (B) insula RSS map
| Anatomy of regions within identified clusters | L/R | x | y | z | F | Sig. (2-tailed) | Effect size partial η2 |
|---|---|---|---|---|---|---|---|
| (A) Middle occipital gyrus network differences | |||||||
| Caudate tail, STG, and insula | L | −42 | −24 | −6 | 18.20 | 0.0001*** | 0.22 |
| Insula | R | 40 | −22 | 20 | 12.99 | 0.0006*** | 0.16 |
| Insula and IPL | L | −54 | −36 | 39 | 21.62 | 0.00002**** | 0.25 |
| (B) Insular network differences | |||||||
| Parahippocampal gyrus and hippocampus | L | −34 | −20 | −28 | 3.00 | 0.088 | 0.04 |
Note: Significant group differences with ***P < 0.001 and ****P < 0.0001. L, left; R, right; MNI, Montreal Neurological Institute; STG, superior temporal gyrus; IPL, inferior parietal lobule.
Logistic Regression Analysis to Identify RSS Differences That Predict Relapse
To explore whether RSS measures alone or in combination with behavioral measures best predicted relapse, logistic regression analysis consisted of 3 separate analyses. First, we conducted a binary logistic regression analysis with average RSS within each network as predictors and relapse as the dependent variable. This analysis allowed us to compare the predictive strength of RSS in each network during baseline recordings in predicting subsequent abstinence versus relapse. Secondly, we used binary logistic regression with behavioral variables as predictors and relapse as the dependent variable. Behavioral variables included measures from Table 1 (age, years of education, gender, alcohol lifetime dose, alcohol lifetime use duration, dose during peak use, length of abstinence before resting fMRI scan, alcohol lifetime abuse count), as well as lifetime abuse count for cocaine, methamphetamine, marihuana, and nicotine. This analysis allowed us to compare the predictive strength of only behavioral measures such as demographics and substance use history for predicting subsequent abstinence versus relapse. Thirdly, we conducted a hierarchical binary logistic regression analysis combining predictors from the 2 analyses above (RSS and behavioral measures) and relapse as the dependent variable. This analysis allowed us to examine the combined predictive strength of resting-state neural organization as well as behavioral measures in predicting subsequent abstinence versus relapse.
Correlates of RSS
The strength of RSS (extracted z-scores) within the sgACC network was correlated with AGN task commission errors for both the abstaining and relapsing groups separately. RSS within each network examined was correlated with alcohol use measures such as lifetime substance use (number of drinks), lifetime use duration (number of months used), and duration of abstinence prior to the baseline scan for both the abstaining and relapsing groups separately. Finally, RSS was correlated with relapse measures: Time to relapse and amount of alcohol consumption during relapse within the relapsing group only.
Results
Affective Go/No-Go Task Performance
Abstainers and relapsers did not differ in commission errors during AGN task performance metrics (Table 5).
Table 5.
Affective go/no-go task performance and its correlation to RSS within the SgACC Network
| (A) | ||||
|---|---|---|---|---|
| Abstainers | Relapsers | t | Sig | |
| Commission errors during positive block | 8.20 (4.78) | 10.10 (9.79) | 0.97 | 0.34 |
| Commission errors during negative block | 5.38 (4.42) | 7.38 (8.29) | 1.19 | 0.24 |
| Commission errors during neutral block | 12.03 (6.60) | 11.62 (7.98) | 0.22 | 0.82 |
| (B) | ||||
| Abstainers | Relapsers | |||
| Correlation between sgACC RSS and commission errors during positive blocks | 0.003, (0.984) | −0.46, (0.013*) | ||
| Correlation between sgACC RSS and commission errors during negative blocks | −0.091, (0.578) | −0.45, (0.014*) | ||
| Correlation between sgACC RSS and commission errors during neutral blocks | −0.264 (0.100) | −0.37, (0.047) | ||
Note: (A) Mean total number of incorrect responses to a distractor (commission errors) during positive, negative, and neutral target blocks. Values in parentheses are for standard deviations. (B) Pearson r correlation values showing the relationship between resting state synchrony (RSS) within the subgenual anterior cingulate cortex (sgACC) network and commission errors during the AGN task (positive, negative and neutral target blocks). Values in parentheses represent P (2-tailed significance). *Significant correlations at P < 0.05 are in bold.
Resting-State Synchrony Between Groups
There were no regions in which relapsers had significantly higher strength of RSS than abstainers within the reward and executive control networks. One-sample t-tests within groups showed that groups had similar spatial characteristics of RSS network maps (Fig. 1).
Figure 1.
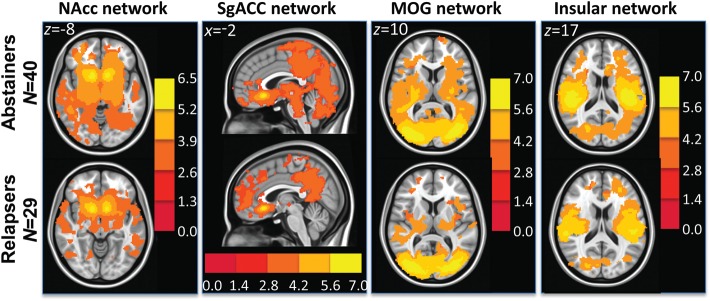
t-Maps showing within group t-test results in abstainers (top row) and relapsers (bottom row) in the NAcc (reward), sgACC (executive control), middle occipital gyrus (MOG) (visual), and insular networks.
RSS in the Reward Network
Independent samples t-test showed that relapsers had significantly lower strength of RSS than abstainers between the bilateral NAcc and clusters shown in Figure 2. ANCOVA results showed that after controlling for the effects of differences in the sum of percent of variance accounted for by noise, differences in all clusters shown in Figure 2 were still significant (see F- and P-values in Table 6A).
Figure 2.

(A) Left: NAcc seeds in green. Right: Resulting t-map showing regions in which abstainers had significantly higher strength of RSS than relapsers within the nucleus accumbens network. t-Map is overlaid on a MNI brain in radiological orientation (right is left). (B) Bar graphs (with ±1 standard error bars) showing strength of RSS between subgenual ACC and regions with significant differences between abstainers (blue bars) and relapsers (green bars). ANCOVA analysis showed that differences in all regions showed were still significant after controlling for noise (see F and Sig. values in Table 6A). RSS, resting-state synchrony; NAcc, nucleus accumbens; LN, lentiform nucleus; ACC, anterior cingulate cortex; DLPFC, dorsolateral prefrontal cortex.
RSS in the Executive Control Network
Independent samples t-test showed that relapsers had significantly lower strength of RSS than abstainers between the sgACC and clusters shown in Figure 3. ANCOVA results showed that after controlling for the effects of differences in the sum of percent of variance accounted for by noise, differences in all clusters shown in Figure 3 were still significant (see F- and P-values in Table 6B).
Figure 3.

(A) Left: sgACC seed in green. Right: Resulting t-map showing regions in which abstainers had significantly higher strength of RSS than relapsers within the sgACC network. t-Map is overlaid on a MNI brain in radiological orientation (right is left). (B) Bar graphs (with ±1 standard error bars) showing strength of RSS between sgACC and regions with significant differences between abstainers (blue bars) and relapsers (green bars). ANCOVA analysis showed that differences in all regions showed were still significant after controlling for noise (see F and Sig. values in Table 6B). RSS, resting-state synchrony; sgACC, subgenual anterior cingulate cortex; DLPFC, dorsolateral prefrontal cortex; LN, lentiform nucleus; MOG, middle occipital gyrus.
RSS in the Visual and Insular Networks
Because relapsers showed lower RSS than abstainers in both the reward and executive control networks, we conducted additional analyses using 2 other seeds: Bilateral middle occipital gyrus (center of mass in MNI coordinates: x = ±38, y = −80, z = 6 mms) and bilateral insula (center of mass in MNI coordinates: x = ±40, y = 2, z = 4 mms), to assess whether RSS reduction in relapsers was generalized to other networks. Seeds were defined by the Talairach Damon atlas provided by AFNI (Cox 2011). The visual cortex seed was chosen with the assumption that because the resting-state scan was collected, while all subjects had their eyes closed, groups should show little differences in a visual network. The insula seed was chosen with the assumption that because insula is involved in internal states such as craving (Naqvi et al. 2007; Janes et al. 2010), relapsers may show higher RSS in the insular network. These analyses were conducted with same procedures as with NAcc and sgACC.
Independent samples t-test showed that relapsers had significantly lower RSS within both the visual (Fig. 4 and Table 7A) and insular (Fig. 5 and Table 7B) networks. There were no regions in which relapsers had significantly higher strength of RSS than abstainers within either the visual or insular networks. ANCOVA results showed that after controlling for the effects of differences in the sum of percent of variance accounted for by noise, relapsers still showed significantly lower RSS within the visual network (see F- and P-values in Table 7A). Within the insular network, only a trend of lower RSS in relapsers was found (see F- and P-values in Table 7B, respectively). Taken together, even though relapsers showed similar synchrony maps within observed RSS networks (Fig. 1), they consistently show reduced RSS when compared with abstainers.
Figure 4.

(A) Left: MOG seed in green. Right: Resulting t-map showing regions in which abstainers had significantly higher strength of RSS than relapsers within the MOG network. t-Map is overlaid on a MNI brain in radiological orientation (right is left). (B) Bar graphs (with ±1 standard error bars) showing strength of RSS between MOG and regions with significant differences between abstainers (blue bars) and relapsers (green bars). ANCOVA analysis showed that differences in all regions showed were still significant after controlling for noise (see F and Sig. values in Table 7A). RSS, resting-state synchrony; MOG, middle occipital gyrus; STG, superior temporal gyrus; IPL, inferior parietal lobule.
Figure 5.
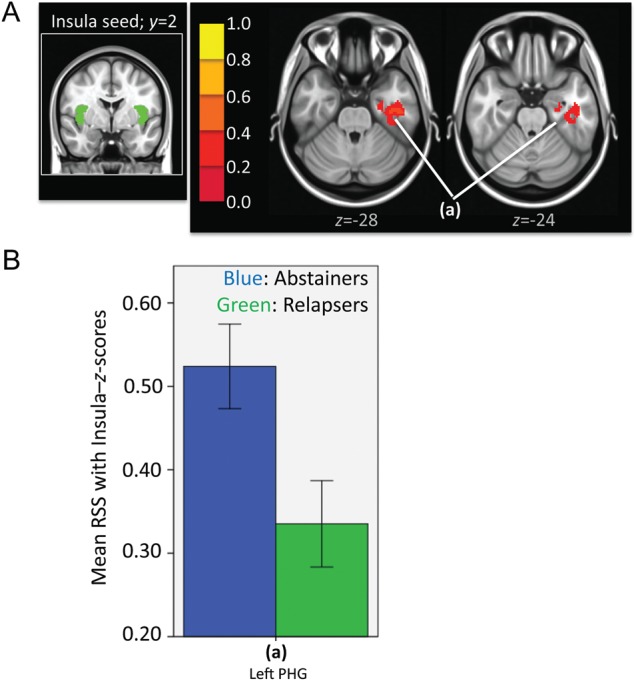
(A) Left: Insula seed in green. Right: Resulting t-map showing regions in which abstainers had significantly higher strength of RSS than relapsers within the insular network. t-Map is overlaid on a MNI brain in radiological orientation (right is left). (B) Bar graphs (with ±1 standard error bars) showing strength of RSS between insula and regions with significant differences between abstainers (blue bars) and relapsers (green bars). ANCOVA analysis showed that differences did not reach significance after controlling for noise (see F and Sig. values in Table 7B). RSS, resting-state synchrony; PHG, parahippocampal gyrus.
Logistic Regression Analysis
When examining the capacity of RSS to predict group membership, results showed that a model containing variables representing RSS strength in all networks examined could accurately predict group membership 85.5% of the time, compared with 58% accuracy in a null model (Table 8A). When examining each RSS predictor (RSS in each network) alone, logistic regression analysis results showed that all predictors had a significant effect on group membership (Table 9A).
Table 8.
(A) Logistic regression analysis results showing the classification table illustrating capacity of a model containing variables representing RSS strength for each network to predict relapse during short-term abstinence. (B) Logistic regression analysis results showing the classification table illustrating capacity of a model containing behavioral variables to predict relapse during short-term abstinence. (C) Logistic regression analysis results showing the classification table illustrating capacity of a model containing variables representing RSS strength for each network examined as well as behavioral variables to predict relapse during short-term abstinence.
|
(A) RSS as outcome predictors | |||
|---|---|---|---|
| Predicted outcome |
Percentage correct | ||
| Observed outcome | ABS | REL | |
| Abstinence | 37 | 3 | 92.5 |
| Relapse | 7 | 22 | 75.9 |
| Overall accuracy percentage of RSS strength | 85.5 | ||
|
(B) Behavioral measures as outcome predictors | |||
| Predicted outcome |
Percentage correct | ||
| Observed outcome | ABS | REL | |
| Abstinence | 34 | 6 | 85.0 |
| Relapse | 13 | 16 | 55.2 |
| Overall accuracy percentage of RSS strength | 72.5 | ||
|
(C) RSS and Behavioral Measures as Outcome Predictors | |||
| Predicted outcome |
Percentage correct | ||
| Observed outcome | ABS | REL | |
| Abstinence | 40 | 0 | 100.0 |
| Relapse | 0 | 29 | 100.0 |
| Overall accuracy percentage of RSS strength | 100.0 | ||
Note: Model coded 1 for Relapsers and 0 for Abstainers. For a list of RSS predictors and behavioral measure predictors, please see Table 9. ABS, abstainers; REL, relapsers; RSS, resting state synchrony.
Table 9.
(A) Summary of Logistic Regression Analysis for each individual RSS network examined as a predictor of relapse. (B) Summary of Logistic Regression Analysis for each behavioral measure used as a predictor of relapse.
|
(A) Resting state synchrony as outcome predictors | ||||
|---|---|---|---|---|
| Predictor | B | SE B | Standardized B | Wald |
| RSS in NAcc network | −6.16 | 1.546 | −0.383 | 15.888*** |
| RSS in sgACC network | −4.13 | 1.157 | −0.277 | 12.774** |
| RSS in MOG network | −6.47 | 1.633 | −0.427 | 15.702*** |
| RSS in Insular network | −1.90 | 0.899 | −0.138 | 4.48* |
|
(B) Behavioral measures as outcome predictors | ||||
| Predictor | B | SE B | Standardized B | Wald |
| Age, (yrs) | 0.004 | 0.035 | 0.007 | 0.016 |
| Education, (yrs) | −0.162 | 0.118 | −0.089 | 1.885 |
| Gender | −0.799 | 0.511 | −0.0964 | 2.442 |
| Alcohol Lifetime Dose | 0.0003 | 0.001 | 0.0158 | 0.071 |
| Alcohol Lifetime Use Duration | 0.003 | 0.003 | 0.0685 | 1.671 |
| Dose During Peak Use | −0.0001 | 0.001 | −0.0079 | 0.017 |
| Length of Abstinence until MRI session | −0.016 | 0.014 | −0.0721 | 1.485 |
| Alcohol Lifetime Abuse Count | 0.126 | 0.204 | 0.0377 | 0.382 |
| Cocaine Lifetime Abuse Count | −0.452 | 0.228 | −0.1504 | 3.950* |
| Methamphetamine Lifetime Abuse Count | −0.006 | 0.145 | −0.0024 | 0.002 |
| Marihuana Lifetime Abuse Count | −0.235 | 0.209 | −0.0812 | 1.462 |
Note: B, raw Beta coefficient; SE B, standard error for raw Beta coefficient; eB, exponentiated B or odds ratio; Standardized B, standardized beta coefficient; RSS, resting state synchrony; sgACC, subgenual anterior cingulate cortex; NAcc, nucleus accumbens; MOG, middle occipital gyrus. Model coded 1 for Relapsers and 0 for Abstainers.
*P < 0.05
**P < 0.001
***P < 0.0001
When examining the capacity of behavioral measures to predict group membership, results showed that a model containing variables representing subjects' demographics and substance use history could accurately predict group membership 72.5% of the time, compared with 58% accuracy in a null model (Table 8B). When examining each behavioral measure alone, logistic regression analysis results showed that only cocaine lifetime abuse count had a significant effect on group membership (Table 9B).
When examining the capacity of the combination of RSS strength and behavioral measures to predict group membership, results showed that a model containing both sets of variables (RSS strength and behavioral measures) could accurately predict group membership 100.0% of the time, compared with 58% accuracy in a null model (Table 8C).
Correlates of RSS
Relapsers showed significant negative correlations between AGN task performance and RSS in the sgACC network (Table 5B; Fig. 6). Abstainers did not show significant correlations. P-value to determine correlation significance was adjusted to correct for multiple comparisons (positive, negative, and neutral blocks in the AGN task) with a Bonferroni correction (3 AGN measures = 0.05/3 = 0.017).
Figure 6.
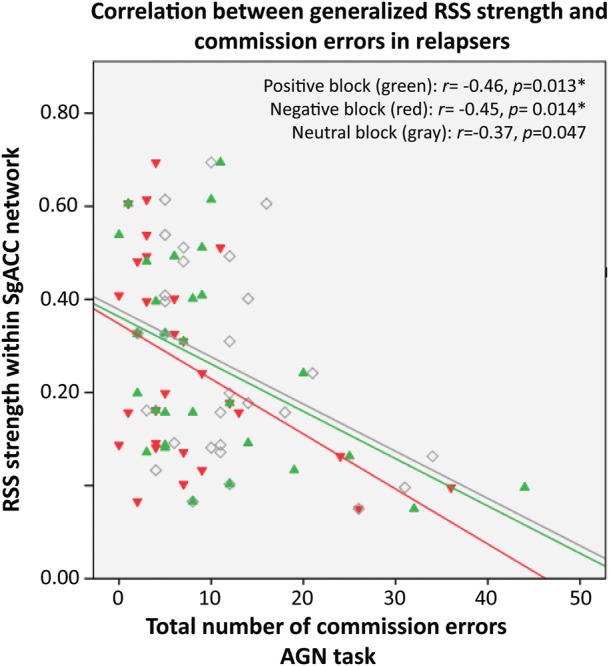
Scatterplot showing correlations between generalized RSS strength and commission errors (response to a distractor stimulus) during positive (green), negative (red), and neutral (gray) target blocks in relapsers. Each dot is an individual subject. RSS, resting-state synchrony; AGN, affective go/no-go task.
Relapsers showed significant negative correlations between amount of drinks consumed in their lifetime and RSS in NAcc (Table 10). The relapsing group also showed significant negative correlations between lifetime use duration and RSS in the NAcc, sgACC, and visual networks. Relapsers did not show correlations between RSS and length of abstinence up to the day of the resting fMRI scan. Abstainers did not show any significant correlations between RSS and the above mentioned measures.
Table 10.
Relationship between Resting State Synchrony in examined networks (columns show each RSS network examined) and alcohol lifetime use, alcohol lifetime use duration, and abstinence duration.
| NAcc | sgACC | Visual | Insular | |
|---|---|---|---|---|
| Alcohol Lifetime Use (number of drinks) | −0.43, (0.021*) | −0.18, (0.358) | −0.14, (0.485) | −0.13, (0.495) |
| Alcohol Lifetime Use Duration (number of months) | −0.44, (0.018*) | −0.39, (0.036*) | −0.41, (0.027*) | −0.32, (0.089) |
| Abstinence Duration(number of days) | 0.28, (0.142) | 0.10, (0.590) | 0.26 (.892) | 0.05 (0.810) |
Note: Values represent r (Pearson Correlation), values in parentheses represent P (2-tailed significance). Significant correlations at P < 0.05 are in bold.
The relapsing group did not show significant correlations between relapsing measures during the follow-up period (such as time to relapse and amount of alcohol consumption) and strength of RSS in each of the networks examined.
Discussion
RSS, which ostensibly reflects the organized interaction of brain regions during rest (Mennes et al. 2011), was found to be generally reduced in short-term abstinent alcohol-dependent individuals who later relapsed compared with those who did not. Regression analysis showed that reduced RSS at 6–15 weeks abstinence could significantly predict relapse over the ensuing half year. The a priori hypotheses of the present study was that we would find that compared with abstainers, relapsers had increased RSS in the reward network and reduced RSS in the executive control network. Results showed lower RSS in the executive control network in short-term abstinent alcoholics who later relapsed when compared with abstainers. Results, however, did not show higher RSS in the reward network in relapsers than in abstainers; in fact, we found generally lower RSS across all networks examined in individuals who later relapsed compared with those who maintained abstinence. Our correlational analysis further showed that the generalized lower strength of RSS is related to poor inhibitory control. Present findings suggest that a generalized lower functional neural organization during rest may differentiate future abstainers from relapsers during short-term abstinence.
The present study adds to the neuroimaging literature on alcoholism by identifying differences in RSS specific to relapse. A previous study that examined RSS in alcohol-dependent individuals reported important results in short-term abstinent alcoholics (Chanraud et al. 2011). They found that short-term abstinent alcohol individuals had lower RSS within the default mode network than controls. Our study is an important addition to the findings reported by Chanraud et al. (2011), because we expanded the investigation to other resting-state networks that may play a role in the maintenance of abstinence, and we also compared RSS between abstainers and relapsers to identify specific differences that may indicate relapse vulnerability during short-term abstinence.
Because of its potential for elucidating brain organization (Raichle and Snyder 2007; Fox and Greicius 2010), differences in RSS found in the present study suggest that during short-term abstinence, individuals that later relapse had a generalized lower network organization than individuals that maintained abstinence. It is unlikely that identified RSS differences in the current study are due to inherent motion or artifacts (i.e. physiological noise) specific to the relapsers because lower RSS remained to be significant (except for the insular network which still showed a trend of lower RSS in relapsers) after controlling for percent of variance accounted for by noise. We propose that a lack of organization evident during rest constitutes a faulty foundation for future responses to external cues (Mennes et al. 2011), which can consequently disrupt the ability for short-term abstinent individuals to regulate responses to external triggers, resulting in relapse. This claim is supported when reviewing the roles that the specific networks found to have lower RSS in the present study have in addiction.
First, within the reward network, RSS between the NAcc seed and both the left and right insula had the largest group difference (Table 6A). Previous research has hypothesized that insula plays a key role in the ability to remain abstinent because it is part of a network involved in the enhancement of the awareness of the negative consequences of drug use and the weakening of the awareness of the positive reinforcing effects of drug use (Naqvi and Bechara 2010). Because the NAcc is ostensibly involved in the representation of the positive reinforcing effects of drug use (Everitt and Robbins 2005), lower RSS between NAcc and insula found in relapsers may indicate a lack of interaction needed to enhance the awareness of the negative consequences of drug use and to suppress the positive reinforcing effects of drug use (Janes et al. 2010).
Secondly, lower RSS within the executive control network that regulates emotion (Kelly et al. 2009) was significantly lower in the dorsolateral prefrontal cortex (DLPFC) and insula clusters (Table 6B). Lower white-matter structural organization in frontal regions has been recently reported in alcoholics that later relapse versus those who remain abstinent (Sorg et al. 2012). Given the DLPFC's role in executive control (MacDonald et al. 2000; Swick et al. 2008; Sharp et al. 2010), current results may indicate a compromised ability to integrate executive control on emotion in relapsers. Due to the insula's anatomical connections to frontal regions (such as sgACC and DLPFC), it has also been hypothesized that the insula is involved in the decision-making processes that precede drug seeking and drug use by integrating information between internal states and the external world to help evaluate possible risks associated with positive or negative consequences (Seeley et al. 2007; Bossaerts 2010; Naqvi and Bechara 2010). Lower interaction between sgACC and insula may mediate relapsers' inability to integrate awareness of internal states and their consequences for proper decision-making.
Evidence for the relationship between resting-state network organization within the sgACC network and behavior outcome (abstinence vs. relapse) is further supported by our correlational results, which showed that lower strength of RSS within the sgACC network was associated with an inability to inhibit a prepotent behavior when presented with emotional-laden stimuli (assessed by the AGN task performance; Fig. 6). Lower RSS related to poor performance in an affective inhibitory control task provides evidence that relapsers' poor executive control of emotion processing is associated with a generalized lack of organization (even during rest) of brain regions that mediate executive control of emotion processing. It is interesting to note that this association was only specific to relapsers, since abstainers did not show a significant relationship.
Thirdly, within the visual network, RSS strength in a cluster comprised of left insula and inferior parietal lobule (IPL) best predicted group membership (Table 7A). Research suggests that the middle occipital gyrus is involved in processing information such as visual perception and the distinction of one's own versus others' bodies and actions (David et al. 2007; Myers and Sowden 2008; Takahashi et al. 2008), the insula is involved in awareness of consequences (Craig 2009), and IPL is involved in attention allocation and assessment of decisions (Hopfinger et al. 2000; Ernst et al. 2002). Results from the present study suggest that relapsers have lower organization in a network involved in sensory awareness and attention, processes that are needed for proper decision-making and assessment, such as the decision to inhibit drug consumption to avoid relapse.
It is important to note that there were common brain regions in which relapsers showed reduced RSS across the networks examined such as insula and DLPFC. Relapsers showed reduced RSS of insula within all networks examined. A previous study by Padula et al. (2011) provided specific evidence of the relationship between alcohol consumption and its effect on bilateral insula. When healthy subjects performed a task that required emotional processing, they showed an attenuation of insula activation after ingesting a moderate dose of alcohol, which was not affected when ingesting a placebo beverage. In addition, it has been proposed that damage to insula facilitates abstinence in nicotine addicts who reported diminished urge to smoke and abstinence without relapse (Naqvi et al. 2007). We believe that previous reports and current results provide evidence on the important role that insula plays in addiction (Naqvi and Bechara 2010) as well as in the ability to remain abstinent (Naqvi et al. 2007). Relapsers also showed reduced RSS of DLPFC within the reward and executive control networks. In a previous study from our group, we report that individuals that have been able to achieve long-term abstinence from alcohol (abstinent for 7.91 ± 7.80 years) had increased synchrony of DLPFC within both the reward and executive control networks (Camchong et al. forthcoming). Present and previous results from our lab suggest that reduced synchrony of this region within both the reward and executive control networks may be linked to relapsers' inability to remain abstinent.
The current study also provides evidence for the relationship between measures of alcohol use and quality of RSS in networks examined in relapsers. Larger amounts of alcohol used during a lifetime seem to be related to a reduced strength of RSS of regions within the NAcc network. Longer length of alcohol use during a lifetime seems to be related to a more generalized reduction of strength of RSS in regions within the NAcc, sgACC, and visual networks.
Given the above review of the functional implications of these networks in substance dependence, current findings suggest that lower synchronization in regions within resting-state networks may play a key role in mediating successful abstinence. Logistic regression results suggest that the combined effect of lower organized synchronization within the networks examined together with behavioral measures, best predicted group membership indicating that a combination of both RSS as well as behavioral measures may be a potential neurological marker for relapse. The cognitive and emotional processes that these networks mediate are needed for proper decision-making, such as the decision to inhibit drug consumption to avoid relapse. Because RSS alone still predicted group membership with high accuracy, we propose that lack of interaction within resting-state networks may be a sign of vulnerability for relapse in the current sample of short-term abstinent alcoholics. This claim needs to be further explored with other samples.
A parallel finding has already been reported in nicotine addicts in which reduced synchrony within a network involved in emotion and decision-making was found to be a predictor for later relapse (Janes et al. 2010). Synchrony within this network, however, was examined during performance of an emotional Stroop task in the scanner. An important future direction of the results currently reported would be to examine both RSS and task-related synchrony in the same sample to further characterize markers of brain organization in relapsers.
A previous study has suggested that smaller frontal and posterior gray-matter volumes can also be predictive of relapse (Rando et al. 2011). Differences in gray-matter volumes in the current study need to be determined in future studies. In addition, because RSS was not significantly correlated with history of alcohol consumption, there is a possibility that lower RSS synchrony found in relapsers is not related to chronic alcohol consumption but to a preexisting or premorbid factor not assessed within the scope of this study. Future longitudinal studies need to be conducted examining RSS in individuals at risk of becoming alcoholics (offspring of alcoholics).
To examine the extent to which RSS differences found in relapsers represent deviations from a normative healthy control sample, we conducted a supplementary analysis to include a group of 45 NSAC. The NSAC sample was not significantly different in age [analysis of variance (ANOVA) results: F2,111 = 0.569, P = 0.568] or gender (χ2 results: χ2(2,114) = 2.69, P = 0.260) when compared with abstainers and relapsers. Using the same analysis methodology as described in the section Materials and Methods, mean z-scores from regions where significant differences were found between abstainers and relapsers for each RSS examined (Tables 6 and 7) were extracted for each NSAC subject. An analysis of variance conducted to examine group differences in RSS within each network showed that abstainers were not significantly different than NSAC, whereas relapsers showed significantly reduced RSS in all clusters within all resting-state networks when compared with NSAC (Fig. 7). Current results confirm that lower RSS strength during short-term abstinence not only differentiates subsequent relapsers from abstainers, but is also different between subsequent relapsers and NSAC. The pattern found in the abstainers, with similar levels of RSS when compared with controls, may suggest that abstainers either underwent recovery of RSS strength after a short period of time, or they never lost strength of RSS despite alcoholism. Although abstainers' stronger RSS cannot be discriminated within the scope of this study, current findings point to the important relationship between RSS strength and ability to maintain abstinence. Relapsers, on the other hand, do not seem to recover RSS strength despite abstinence, suggesting there is a perseverant lack of interaction of brain regions in relapsers, which may be associated with their inability to remain abstinent.
Figure 7.

Bar graphs showing mean RSS for NSAC (brown), abstainers (blue), and relapsers (green) in specific clusters within the (A) NAcc, (B) sgACC, (C) visual, and (D) insular networks shown in Tables 6 and 7. ANOVA results showed that relapsers were significantly different from both abstainers and NSAC. Abstainers were only significantly different from relapsers. NSAC, non-substance abuse controls.
In conclusion, regardless of the network examined, results suggest that short-term abstinent alcoholic individuals that later relapsed consistently show lower synchronization within resting-state networks when compared with those that maintained abstinence over the subsequent half year. This generalized lower RSS was significantly correlated with inhibitory control performance. Present results provide potentially useful information for future intervention studies to implement treatments designed to prevent relapse in alcohol-dependent individuals, by suggesting the need to increase RSS on potential relapsers. Further research needs to be conducted to confirm present findings. Taken together, resting-state fMRI data may become an important tool to both identify individuals at risk for relapse and potentially serve as a treatment target in short-term abstinent alcohol-dependent individuals.
Funding
This work was supported by the National Institutes for Health (NIH; grant numbers 5R01AA016944, 3R01AA016944-02S1). NIH had no further involvement in the collection, analysis, interpretation, writing, or submission of this article.
Notes
We thank Patti Ludlow and the NRI staff for subject recruitment and data collection. We also thank the subjects for contributing with their time and effort. Conflict of Interest: None declared.
References
- Akine Y, Kato M, Muramatsu T, Umeda S, Mimura M, Asai Y, Tanada S, Obata T, Ikehira H, Kashima H, et al. Altered brain activation by a false recognition task in young abstinent patients with alcohol dependence. Alcohol Clin Exp Res. 2007;31:1589–1597. doi: 10.1111/j.1530-0277.2007.00453.x. doi:10.1111/j.1530-0277.2007.00453.x. [DOI] [PubMed] [Google Scholar]
- Albert J, Lopez-Martin S, Tapia M, Montoya D, Carretie L. The role of the anterior cingulate cortex in emotional response inhibition. Hum Brain Mapp. 2011 doi: 10.1002/hbm.21347. doi:10.1002/hbm.21347. [DOI] [PMC free article] [PubMed] [Google Scholar]
- American Psychiatric Association. Diagnostic and Statistical Manual of Mental Disorders, 4th ed. (DSM-IV) Washington (DC): American Psychiatric Association Press; 1994. [Google Scholar]
- Berking M, Margraf M, Ebert D, Wupperman P, Hofmann SG, Junghanns K. Deficits in emotion-regulation skills predict alcohol use during and after cognitive-behavioral therapy for alcohol dependence. J Consult Clin Psychol. 2011;79:307–318. doi: 10.1037/a0023421. doi:10.1037/a0023421. [DOI] [PMC free article] [PubMed] [Google Scholar]
- Bossaerts P. Risk and risk prediction error signals in anterior insula. Brain Struct Funct. 2010;214:645–653. doi: 10.1007/s00429-010-0253-1. doi:10.1007/s00429-010-0253-1. [DOI] [PubMed] [Google Scholar]
- Braus D, Wrase J, Grüsser S, Hermann D, Ruf M, Flor H, Mann K, Heinz A. Alcohol-associated stimuli activate the ventral striatum in abstinent alcoholics. J Neural Transm. 2001;108:887–894. doi: 10.1007/s007020170038. doi:10.1007/s007020170038. [DOI] [PubMed] [Google Scholar]
- Camchong J, MacDonald AW, 3rd, Bell C, Mueller BA, Lim KO. Altered functional and anatomical connectivity in schizophrenia. Schizophr Bull. 2011;37:640–650. doi: 10.1093/schbul/sbp131. doi:10.1093/schbul/sbp131. [DOI] [PMC free article] [PubMed] [Google Scholar]
- Camchong J, MacDonald AW, 3rd, Nelson B, Bell C, Mueller BA, Specker S, Lim KO. Frontal hyperconnectivity related to discounting and reversal learning in cocaine subjects. Biol Psychiatry. 2011;69:1117–1123. doi: 10.1016/j.biopsych.2011.01.008. doi:10.1016/j.biopsych.2011.01.008. [DOI] [PMC free article] [PubMed] [Google Scholar]
- Camchong JC, Stenger A, Fein G. Resting state synchrony in long-term abstinent alcoholics. Alcohol Clin Exp Res. 2012 doi: 10.1111/j.1530-0277.2012.01859.x. doi:10.1111/j.1530-0277.2012.01859.x. [DOI] [PMC free article] [PubMed] [Google Scholar]
- Cardenas VA, Durazzo TC, Gazdzinski S, Mon A, Studholme C, Meyerhoff DJ. Brain morphology at entry into treatment for alcohol dependence is related to relapse propensity. Biol Psychiatry. 2011;70:561–567. doi: 10.1016/j.biopsych.2011.04.003. doi:10.1016/j.biopsych.2011.04.003. [DOI] [PMC free article] [PubMed] [Google Scholar]
- Chanraud S, Pitel AL, Pfefferbaum A, Sullivan EV. Disruption of functional connectivity of the default-mode network in alcoholism. Cereb Cortex. 2011;21:2272–2281. doi: 10.1093/cercor/bhq297. doi:10.1093/cercor/bhq297. [DOI] [PMC free article] [PubMed] [Google Scholar]
- Cox RW. AFNI: what a long strange trip it's been. Neuroimage. 2011;62:743–747. doi: 10.1016/j.neuroimage.2011.08.056. [DOI] [PMC free article] [PubMed] [Google Scholar]
- Craig A. How do you feel–now? The anterior insula and human awareness. Nat Rev Neurosci. 2009;10:59–70. doi: 10.1038/nrn2555. doi:10.1038/nrn2555. [DOI] [PubMed] [Google Scholar]
- David N, Cohen MX, Newen A, Bewernick BH, Shah NJ, Fink GR, Vogeley K. The extrastriate cortex distinguishes between the consequences of one's own and others' behavior. Neuroimage. 2007;36:1004–1014. doi: 10.1016/j.neuroimage.2007.03.030. doi:10.1016/j.neuroimage.2007.03.030. [DOI] [PubMed] [Google Scholar]
- Durazzo TC, Gazdzinski S, Mon A, Meyerhoff DJ. Cortical perfusion in alcohol-dependent individuals during short-term abstinence: relationships to resumption of hazardous drinking after treatment. Alcohol. 2010;44:201–210. doi: 10.1016/j.alcohol.2010.03.003. doi:10.1016/j.alcohol.2010.03.003. [DOI] [PMC free article] [PubMed] [Google Scholar]
- Durazzo TC, Tosun D, Buckley S, Gazdzinski S, Mon A, Fryer SL, Meyerhoff DJ. Cortical thickness, surface area, and volume of the brain reward system in alcohol dependence: relationships to relapse and extended abstinence. Alcohol Clin Exp Res. 2011;35:1187–1200. doi: 10.1111/j.1530-0277.2011.01452.x. doi:10.1111/j.1530-0277.2011.01452.x. [DOI] [PMC free article] [PubMed] [Google Scholar]
- Ernst M, Bolla K, Mouratidis M, Contoreggi C, Matochik JA, Kurian V, Cadet JL, Kimes AS, London ED. Decision-making in a risk-taking task: a PET study. Neuropsychopharmacology. 2002;26:682–691. doi: 10.1016/S0893-133X(01)00414-6. doi:10.1016/S0893-133X(01)00414-6. [DOI] [PubMed] [Google Scholar]
- Everitt BJ, Robbins TW. Neural systems of reinforcement for drug addiction: from actions to habits to compulsion. Nat Neurosci. 2005;8:1481–1489. doi: 10.1038/nn1579. doi:10.1038/nn1579. [DOI] [PubMed] [Google Scholar]
- Fox MD, Greicius M. Clinical applications of resting state functional connectivity. Front Syst Neurosci. 2010;4:19. doi: 10.3389/fnsys.2010.00019. [DOI] [PMC free article] [PubMed] [Google Scholar]
- Glover GH, Law CS. Spiral-in/out BOLD fMRI for increased SNR and reduced susceptibility artifacts. Magn Reson Med. 2001;46:515–522. doi: 10.1002/mrm.1222. doi:10.1002/mrm.1222. [DOI] [PubMed] [Google Scholar]
- Goldstein RZ, Leskovjan AC, Hoff AL, Hitzemann R, Bashan F, Khalsa SS, Wang GJ, Fowler JS, Volkow ND. Severity of neuropsychological impairment in cocaine and alcohol addiction: association with metabolism in the prefrontal cortex. Neuropsychologia. 2004;42:1447–1458. doi: 10.1016/j.neuropsychologia.2004.04.002. doi:10.1016/j.neuropsychologia.2004.04.002. [DOI] [PubMed] [Google Scholar]
- Goldstein RZ, Volkow ND. Drug addiction and its underlying neurobiological basis: neuroimaging evidence for the involvement of the frontal cortex. Alcohol Clin Exp Res. 2002;159:1642–1652. doi: 10.1176/appi.ajp.159.10.1642. [DOI] [PMC free article] [PubMed] [Google Scholar]
- Gour N, Ranjeva JP, Ceccaldi M, Confort-Gouny S, Barbeau E, Soulier E, Guye M, Didic M, Felician O. Basal functional connectivity within the anterior temporal network is associated with performance on declarative memory tasks. Neuroimage. 2011;58:687–697. doi: 10.1016/j.neuroimage.2011.05.090. doi:10.1016/j.neuroimage.2011.05.090. [DOI] [PubMed] [Google Scholar]
- Grüsser SM, Wrase J, Klein S, Hermann D, Smolka MN, Ruf M, Weber-Fahr W, Flor H, Mann K, Braus DF, et al. Cue-induced activation of the striatum and medial prefrontal cortex is associated with subsequent relapse in abstinent alcoholics. Psychopharmacology (Berl) 2004;175:296–302. doi: 10.1007/s00213-004-1828-4. doi:10.1007/s00213-004-1828-4. [DOI] [PubMed] [Google Scholar]
- Heinz A, Wrase J, Kahnt T, Beck A, Bromand Z, Grusser SM, Kienast T, Smolka MN, Flor H, Mann K. Brain activation elicited by affectively positive stimuli is associated with a lower risk of relapse in detoxified alcoholic subjects. Alcohol Clin Exp Res. 2007;31:1138–1147. doi: 10.1111/j.1530-0277.2007.00406.x. doi:10.1111/j.1530-0277.2007.00406.x. [DOI] [PubMed] [Google Scholar]
- Hodgins DC, el-Guebaly N, Armstrong S. Prospective and retrospective reports of mood states before relapse to substance use. J Consult Clin Psychol. 1995;63:400–407. doi: 10.1037//0022-006x.63.3.400. doi:10.1037/0022-006X.63.3.400. [DOI] [PubMed] [Google Scholar]
- Hong LE, Gu H, Yang Y, Ross TJ, Salmeron BJ, Buchholz B, Thaker GK, Stein EA. Association of nicotine addiction and nicotine's actions with separate cingulate cortex functional circuits. Arch Gen Psychiatry. 2009;66:431–441. doi: 10.1001/archgenpsychiatry.2009.2. doi:10.1001/archgenpsychiatry.2009.2. [DOI] [PMC free article] [PubMed] [Google Scholar]
- Hopfinger J, Buonocore M, Mangun G. The neural mechanisms of top-down attentional control. Nat Neurosci. 2000;3:284–291. doi: 10.1038/72999. doi:10.1038/72999. [DOI] [PubMed] [Google Scholar]
- Jackson JI, Meyer CH, Nishimura DG, Macovski A. Selection of a convolution function for Fourier inversion using gridding [computerised tomography application] IEEE Trans Med Imaging. 1991;10:473–478. doi: 10.1109/42.97598. doi:10.1109/42.97598. [DOI] [PubMed] [Google Scholar]
- Janes AC, Pizzagalli DA, Richardt S, de BFB, Chuzi S, Pachas G, Culhane MA, Holmes AJ, Fava M, Evins AE, et al. Brain reactivity to smoking cues prior to smoking cessation predicts ability to maintain tobacco abstinence. Biol Psychiatry. 2010;67:722–729. doi: 10.1016/j.biopsych.2009.12.034. doi:10.1016/j.biopsych.2009.12.034. [DOI] [PMC free article] [PubMed] [Google Scholar]
- Jenkinson M, Bannister P, Brady M, Smith S. Improved optimization for the robust and accurate linear registration and motion correction of brain images. Neuroimage. 2002;17:825–841. doi: 10.1016/s1053-8119(02)91132-8. doi:10.1006/nimg.2002.1132. [DOI] [PubMed] [Google Scholar]
- Kamarajan C, Porjesz B, Jones KA, Choi K, Chorlian DB, Padmanabhapillai A, Rangaswamy M, Stimus AT, Begleiter H. Alcoholism is a disinhibitory disorder: neurophysiological evidence from a Go/No-Go task. Biol Psychol. 2005;69:353–373. doi: 10.1016/j.biopsycho.2004.08.004. doi:10.1016/j.biopsycho.2004.08.004. [DOI] [PMC free article] [PubMed] [Google Scholar]
- Kelly AM, Di Martino A, Uddin LQ, Shehzad Z, Gee DG, Reiss PT, Margulies DS, Castellanos FX, Milham MP. Development of anterior cingulate functional connectivity from late childhood to early adulthood. Cereb Cortex. 2009;19:640–657. doi: 10.1093/cercor/bhn117. doi:10.1093/cercor/bhn117. [DOI] [PubMed] [Google Scholar]
- Kelly C, Zuo XN, Gotimer K, Cox CL, Lynch L, Brock D, Imperati D, Garavan H, Rotrosen J, Castellanos FX, et al. Reduced interhemispheric resting state functional connectivity in cocaine addiction. Biol Psychiatry. 2011;69:684–692. doi: 10.1016/j.biopsych.2010.11.022. doi:10.1016/j.biopsych.2010.11.022. [DOI] [PMC free article] [PubMed] [Google Scholar]
- Kelly RE, Jr, Alexopoulos GS, Wang Z, Gunning FM, Murphy CF, Morimoto SS, Kanellopoulos D, Jia Z, Lim KO, Hoptman MJ. Visual inspection of independent components: defining a procedure for artifact removal from fMRI data. J Neurosci Methods. 2010;189:233–245. doi: 10.1016/j.jneumeth.2010.03.028. doi:10.1016/j.jneumeth.2010.03.028. [DOI] [PMC free article] [PubMed] [Google Scholar]
- Koyama MS, Di Martino A, Zuo XN, Kelly C, Mennes M, Jutagir DR, Castellanos FX, Milham MP. Resting-state functional connectivity indexes reading competence in children and adults. J Neurosci. 2011;31:8617–8624. doi: 10.1523/JNEUROSCI.4865-10.2011. doi:10.1523/JNEUROSCI.4865-10.2011. [DOI] [PMC free article] [PubMed] [Google Scholar]
- Lancaster JL, Woldorff MG, Parsons LM, Liotti M, Freitas CS, Rainey L, Kochunov PV, Nickerson D, Mikiten SA, Fox PT. Automated Talairach atlas labels for functional brain mapping. Hum Brain Mapp. 2000;10:120–131. doi: 10.1002/1097-0193(200007)10:3<120::AID-HBM30>3.0.CO;2-8. doi:10.1002/1097-0193(200007)10:3<120::AID-HBM30>3.0.CO;2-8. [DOI] [PMC free article] [PubMed] [Google Scholar]
- Levitan RD, Blouin AG, Navarro JR, Hill J. Validity of the computerized DIS for diagnosing psychiatric inpatients. Can J Psychiatry. 1991;36:728–731. [PubMed] [Google Scholar]
- Li CS, Luo X, Yan P, Bergquist K, Sinha R. Altered impulse control in alcohol dependence: neural measures of stop signal performance. Alcohol Clin Exp Res. 2009;33:740–750. doi: 10.1111/j.1530-0277.2008.00891.x. doi:10.1111/j.1530-0277.2008.00891.x. [DOI] [PMC free article] [PubMed] [Google Scholar]
- Ma N, Liu Y, Li N, Wang CX, Zhang H, Jiang XF, Xu HS, Fu XM, Hu X, Zhang DR. Addiction related alteration in resting-state brain connectivity. Neuroimage. 2010;49:738–744. doi: 10.1016/j.neuroimage.2009.08.037. doi:10.1016/j.neuroimage.2009.08.037. [DOI] [PMC free article] [PubMed] [Google Scholar]
- MacDonald AW, 3rd, Cohen JD, Stenger VA, Carter CS. Dissociating the role of the dorsolateral prefrontal and anterior cingulate cortex in cognitive control. Science. 2000;288:1835–1838. doi: 10.1126/science.288.5472.1835. doi:10.1126/science.288.5472.1835. [DOI] [PubMed] [Google Scholar]
- Mennes M, Zuo XN, Kelly C, Di Martino A, Zang YF, Biswal B, Castellanos FX, Milham MP. Linking inter-individual differences in neural activation and behavior to intrinsic brain dynamics. Neuroimage. 2011;54:2950–2959. doi: 10.1016/j.neuroimage.2010.10.046. doi:10.1016/j.neuroimage.2010.10.046. [DOI] [PMC free article] [PubMed] [Google Scholar]
- Myers A, Sowden PT. Your hand or mine? The extrastriate body area. Neuroimage. 2008;42:1669–1677. doi: 10.1016/j.neuroimage.2008.05.045. doi:10.1016/j.neuroimage.2008.05.045. [DOI] [PubMed] [Google Scholar]
- Myrick H, Anton RF, Li X, Henderson S, Drobes D, Voronin K, George MS. Differential brain activity in alcoholics and social drinkers to alcohol cues: relationship to craving. Neuropsychopharmacology. 2004;29:393–402. doi: 10.1038/sj.npp.1300295. doi:10.1038/sj.npp.1300295. [DOI] [PubMed] [Google Scholar]
- Naqvi NH, Bechara A. The insula and drug addiction: an interoceptive view of pleasure, urges, and decision-making. Brain Struct Funct. 2010;214:435–450. doi: 10.1007/s00429-010-0268-7. doi:10.1007/s00429-010-0268-7. [DOI] [PMC free article] [PubMed] [Google Scholar]
- Naqvi NH, Rudrauf D, Damasio H, Bechara A. Damage to the insula disrupts addiction to cigarette smoking. Science. 2007;315:531. doi: 10.1126/science.1135926. doi:10.1126/science.1135926. [DOI] [PMC free article] [PubMed] [Google Scholar]
- Noll DC, Cohen JD, Meyer CH, Schneider W. Spiral K-space MR imaging of cortical activation. J Magn Reson Imaging. 1995;5:49–56. doi: 10.1002/jmri.1880050112. doi:10.1002/jmri.1880050112. [DOI] [PubMed] [Google Scholar]
- Noll DC, Meyer CH, Pauly JM, Nishimura DG, Macovski A. A homogeneity correction method for magnetic resonance imaging with time-varying gradients. IEEE Trans Med Imaging. 1991;10:629–637. doi: 10.1109/42.108599. doi:10.1109/42.108599. [DOI] [PubMed] [Google Scholar]
- Padula CB, Simmons AN, Matthews SC, Robinson SK, Taprtt SF, Schuckit MA, Paulus MP. Alcohol attenuates activation in the bilateral anterior insula during an emotional processing task: a pilot study. Alcohol Alcohol. 2011;2011:547–552. doi: 10.1093/alcalc/agr066. [DOI] [PMC free article] [PubMed] [Google Scholar]
- Park SQ, Kahnt T, Beck A, Cohen MX, Dolan RJ, Wrase J, Heinz A. Prefrontal cortex fails to learn from reward prediction errors in alcohol dependence. J Neurosci. 2010;30:7749–7753. doi: 10.1523/JNEUROSCI.5587-09.2010. doi:10.1523/JNEUROSCI.5587-09.2010. [DOI] [PMC free article] [PubMed] [Google Scholar]
- Porjesz B, Rangaswamy M, Kamarajan C, Jones KA, Padmanabhapillai A, Begleiter H. The utility of neurophysiological markers in the study of alcoholism. Clin Neurophysiol. 2005;116:993–1018. doi: 10.1016/j.clinph.2004.12.016. doi:10.1016/j.clinph.2004.12.016. [DOI] [PubMed] [Google Scholar]
- Raichle ME, Snyder AZ. A default mode of brain function: a brief history of an evolving idea. Neuroimage. 2007;37:1083–1090. doi: 10.1016/j.neuroimage.2007.02.041. discussion 1097–1089 doi:10.1016/j.neuroimage.2007.02.041. [DOI] [PubMed] [Google Scholar]
- Rando K, Hong KI, Bhagwagar Z, Li CS, Bergquist K, Guarnaccia J, Sinha R. Association of frontal and posterior cortical gray matter volume with time to alcohol relapse: a prospective study. Alcohol Clin Exp Res. 2011;168:183–192. doi: 10.1176/appi.ajp.2010.10020233. [DOI] [PMC free article] [PubMed] [Google Scholar]
- Saletu-Zyhlarz GM, Arnold O, Anderer P, Oberndorfer S, Walter H, Lesch OM, Boning J, Saletu B. Differences in brain function between relapsing and abstaining alcohol-dependent patients, evaluated by EEG mapping. Alcohol Alcohol. 2004;39:233–240. doi: 10.1093/alcalc/agh041. [DOI] [PubMed] [Google Scholar]
- Seeley WW, Menon V, Schatzberg AF, Keller J, Glover GH, Kenna H, Reiss AL, Greicius MD. Dissociable intrinsic connectivity networks for salience processing and executive control. J Neurosci. 2007;27:2349–2356. doi: 10.1523/JNEUROSCI.5587-06.2007. doi:10.1523/JNEUROSCI.5587-06.2007. [DOI] [PMC free article] [PubMed] [Google Scholar]
- Sharp DJ, Bonnelle V, De Boissezon X, Beckmann CF, James SG, Patel MC, Mehta MA. Distinct frontal systems for response inhibition, attentional capture, and error processing. Proc Natl Acad Sci USA. 2010;107:6106–6111. doi: 10.1073/pnas.1000175107. doi:10.1073/pnas.1000175107. [DOI] [PMC free article] [PubMed] [Google Scholar]
- Sinha R. The role of stress in addiction relapse. Curr Psychiatry Rep. 2007;9:388–395. doi: 10.1007/s11920-007-0050-6. doi:10.1007/s11920-007-0050-6. [DOI] [PubMed] [Google Scholar]
- Skinner HA, Sheu WJ. Reliability of alcohol use indices. The lifetime drinking history and the MAST. J Stud Alcohol. 1982;43:1157–1170. doi: 10.15288/jsa.1982.43.1157. [DOI] [PubMed] [Google Scholar]
- Sorg SF, Taylor MJ, Alhassoon OM, Gongvatana A, Theilmann RJ, Frank LR, Grant I. Frontal white matter integrity predictors of adult alcohol treatment outcome. Biol Psychiatry. 2012;71:262–268. doi: 10.1016/j.biopsych.2011.09.022. doi:10.1016/j.biopsych.2011.09.022. [DOI] [PMC free article] [PubMed] [Google Scholar]
- Swick D, Ashley V, Turken AU. Left inferior frontal gyrus is critical for response inhibition. BMC Neurosci. 2008;9:102. doi: 10.1186/1471-2202-9-102. doi:10.1186/1471-2202-9-102. [DOI] [PMC free article] [PubMed] [Google Scholar]
- Takahashi H, Shibuya T, Kato M, Sassa T, Koeda M, Yahata N, Suhara T, Okubo Y. Enhanced activation in the extrastriate body area by goal-directed actions. Psychiatry Clin Neurosci. 2008;62:214–219. doi: 10.1111/j.1440-1819.2008.01757.x. doi:10.1111/j.1440-1819.2008.01757.x. [DOI] [PubMed] [Google Scholar]
- Ward B. 2000 AlphaSim program documentation for AFNI, simultaneous inference for fMRI data: medical College of Wisconsin, Milwaukee. Available from: http://afni.nimh.nih.gov/pub/dist/doc/program_help/AlphaSim.html . Accessed August 4, 2011. [Google Scholar]
- Zhu Q, Zhang J, Luo YL, Dilks DD, Liu J. Resting-state neural activity across face-selective cortical regions is behaviorally relevant. J Neurosci. 2011;31:10323–10330. doi: 10.1523/JNEUROSCI.0873-11.2011. doi:10.1523/JNEUROSCI.0873-11.2011. [DOI] [PMC free article] [PubMed] [Google Scholar]