

Abstract
Socioeconomic disadvantage confers risk for aspects of ill health that may be mediated by systemic inflammatory influences on the integrity of distributed brain networks. Following this hypothesis, we tested whether socioeconomic disadvantage related to the structural integrity of white matter tracts connecting brain regions of distributed networks, and whether such a relationship would be mediated by anthropometric, behavioral, and molecular risk factors associated with systemic inflammation. Otherwise healthy adults (N= 155, aged 30–50 years, 78 men) completed protocols assessing multilevel indicators of socioeconomic position (SEP), anthropometric and behavioral measures of adiposity and cigarette smoking, circulating levels of C-reactive protein (CRP), and white matter integrity by diffusion tensor imaging. Mediation modeling was used to test associations between SEP indicators and measures of white matter tract integrity, as well as indirect mediating paths. Measures of tract integrity followed a socioeconomic gradient: individuals completing more schooling, earning higher incomes, and residing in advantaged neighborhoods exhibited increases in white matter fractional anisotropy and decreases in radial diffusivity, relative to disadvantaged individuals. Moreover, analysis of indirect paths showed that adiposity, cigarette smoking, and CRP partially mediated these effects. Socioeconomic inequalities may relate to diverse health disparities via inflammatory pathways impacting the structural integrity of brain networks.
Keywords: diffusion tensor imaging, inflammation, social health disparities, socioeconomic inequality, stress, white matter fractional anisotropy
Introduction
Socioeconomic position (SEP) is a multidimensional and multilevel construct that reflects a person's relative access to social and material resources (Adler et al. 1994; Braveman 2006). Hence, educational, occupational, and financial dimensions of SEP can be measured at the level of the individual, as well as at the levels of households, residential communities, and higher social assemblies. Across these levels, “socioeconomic disadvantage” restricts one's relative access to resources and life opportunities that can impact physical, mental, and neurocognitive health via biological, behavioral, psychosocial, and environmental pathways (Adler and Rehkopf 2008; Miller et al. 2009; Matthews et al. 2010; Braveman et al. 2011). Socioeconomic disadvantage also exposes people to unfavorable life circumstances that can further undermine health through similarly complex pathways that engender disease risk (McEwen and Gianaros 2010).
As evidence, socioeconomic disadvantage confers risk not only for premature death, but also for chronic medical conditions, psychopathologies of mood, and impairments in several neurocognitive functions over the lifespan (Adler et al. 1994; Hackman et al. 2010; Raizada and Kishiyama 2010; Matthews and Gallo 2011). Moreover, socioeconomic disadvantage predicts the preclinical expression of biological and behavioral risk factors for diverse aspects of ill health. These risk factors include the increased expression of inflammatory molecules and proteins (Alley et al. 2006; Petersen et al. 2008; Friedman and Herd 2010; Kershaw et al. 2010), transcriptional changes in genes and intracellular signaling cascades that promote systemic inflammation (Irwin and Cole 2011; Miller et al. 2011), and detrimental health behaviors that are inflammatory—particularly cigarette smoking and habits of energy balance that precipitate adiposity and obesity (Sobal and Stunkard 1989; McLaren 2007; Pampel et al. 2010).
Yet despite long documented socioeconomic inequalities in health and associated risk factors, the neurobiological pathways linking multilevel dimensions of SEP to these inequalities remain unclear. It is speculated that because of the diverse array of health outcomes and neurocognitive endpoints associated with socioeconomic disadvantage, such pathways may encompass distributed neural circuitries whose integrity is important for integrative cognitive, emotional, and visceral homeostatic control processes, as well as self-regulatory behaviors arising from adaptive decision-making (Gianaros and Manuck 2010; Hackman et al. 2010; Miller et al. 2011). In extension, such emergent processes and behaviors are assumed to relate to aspects of health and disease risk that track a socioeconomic gradient. Notwithstanding such assumptions, however, few studies have tested whether indicators of SEP (or socioeconomic disadvantage) relate directly to measures of neural circuit integrity, as revealed by computational morphometric methodologies. Moreover, existing studies in this area have focused mostly on gross reductions in brain tissue volume in association with socioeconomic disadvantage (e.g., Gianaros et al. 2007; Butterworth et al. 2012; Hanson et al. 2011; Staff et al. 2012). Consequently, it is still unknown whether the inflammatory risk factors noted above might account for (or “partially mediate”) the associations of socioeconomic disadvantage to more precise measures of neural network integrity throughout the brain or within particular circuits.
Accordingly, this study tested whether multilevel and multidimensional indicators of socioeconomic disadvantage (measured by individual-level educational attainment, household-level income, and community-level SEP assessed from US census data) relate uniquely to decreases in the structural integrity of distributed white matter tracts in the brain, specifically via mediating risk factors previously linked to both SEP and systemic inflammation (smoking status, adiposity, and high-sensitivity C-reactive protein, CRP). Study questions were addressed by quantitative mediational modeling of white matter fractional anisotropy in a cohort of 155 otherwise healthy adults who completed a multipart protocol involving diffusion tensor imaging (DTI), as well as assessments of socioeconomic, anthropometric, behavioral, psychological, and molecular factors linked to systemic inflammation.
Materials and Methods
Participants
Participants were 155 community-dwelling adults (78 men, 77 women; M age, 40.7 ± 6.2 standard deviation, SD, range = 30–50 years) who were recruited via mass mailings to residents of Allegheny County, Pennsylvania, PA. The Epidemiology Recruitment Health Studies Office at the University of Pittsburgh coordinated mass mailings, as well as eligibility screening. Eligibility criteria included no 1) history of a cardiovascular disease (including any prior or current treatment for or diagnoses of hypertension, stroke, myocardial infarction, congestive heart failure, and arrhythmias); 2) prior cardiovascular or cerebrovascular surgery; 3) chronic kidney or liver conditions, Type I or II diabetes, or any pulmonary or respiratory diseases; 4) current diagnoses of a substance abuse or mood disorder, as confirmed by an in-person interview and the Patient Health Questionnaire (Spitzer et al. 1999), an epidemiological inventory validated in community samples (Martin et al. 2006) against the Diagnostic and Statistical Manual of Mental Disorders IV (Lowe, Grafe, et al. 2004; Lowe, Spitzer, et al. 2004); 5) prior head trauma involving loss of consciousness; 6) prior neurosurgery or any neurological condition; 7) pregnancy (verified in females by urine test); 8) claustrophobia or metallic implants; and 9) any use of psychotropic, lipid lowering, or cardiovascular medications. All participants cleared for eligibility gave their informed consent after receiving a study explanation. They were also tested in compliance with the Code of Ethics of the World Medical Association (Declaration of Helsinki), and with University of Pittsburgh Institutional Review Board approval.
At testing, 142/155 participants reported full- or part-time employment, with 7 individuals reporting that they were unemployed and seeking employment, 4 reporting being a homemaker, 1 being disabled, 1 on public assistance and not seeking employment, and 2 receiving supplemental security income. And of the 155 participants, 11 were completing graduate or postgraduate studies. (Given the limited variability in these proportions [e.g., 8.4% unemployment rate], employment was not used as an SEP indicator). Ninety-nine participants were homeowners, 46 were renting, and 10 had living arrangements wherein they were dependent on someone else for housing. The ethnicity of the sample was Caucasian (70.3%), African American (21.9%), Asian (5.8%), and multiracial/other (1.9%). Participants' average general intellectual ability, as estimated by the North American Adult Reading Test (Blair and Spreen 1989), was 113.7 (SD = 8.7; range = 88–127).
Assessment of Socioeconomic Indicators
Three indicators of SEP were used as the primary predictor (independent) variables of white matter (dependent) variables. These predictor variables, detailed below, included 1) individual-level educational attainment, reflected by years of schooling; 2) household-level and occupant-weighted income; and 3) community-level SEP. All independent and dependent variables were treated as continuous (linear) variables in statistical analyses.
To assess educational attainment, participants reported the number of years of schooling they had completed prior to the time of testing (M = 17.12, SD = 3.2, range = 11–24 years, with 6.5% attaining a high-school diploma or equivalent; 27.7% completing some college, but attaining no degree or attaining an Associate Degree or a technical degree; 29.7% earning a Bachelor's degree; and 36.1% attaining a graduate or advanced degree).
To assess pretax income, participants indicated their annual household earnings in US dollars on a 15-point scale. This scale ranged from less than $10 000/year (or $0–833/month) to more than $185 000/year (or more than $15 417/month). There were 13 income brackets between these anchors, which were spaced in $15 000 increments (M = 6.4, SD = 3.1, range = 1–5, with 10.3% earning less than $10 000/year and 1.2% earning $170 000 or more per year). To compute occupant-weighted household income, annual earnings were taken as the midpoint of the income brackets (with the highest annual earning being scaled to 25% above $185 000). Income midpoints were then weighted by the square root of the number of occupants in the participants' households (M occupants = 2.7, SD = 1.4). This income indicator was then cube root transformed to normalize the income distribution, conforming to prior recommendations and epidemiological studies of SEP (Schwartz 1985; Matthews et al. 2011).
To assess community-level SEP, participants' street addresses of residence were submitted to a geographical coding procedure to derive US Census Bureau variables measured at the level of census tracts. Conforming to prior work on community SEP and inflammation (Petersen et al. 2008) and for all residential tracts, the following variables were extracted from the Year 2000 Census Report (http://factfinder.census.gov): 1) median household income; 2) median housing value; 3) percentage of households receiving public financial assistance; 4) percentage of households with incomes beneath the federal poverty line; 5) percentage of working-aged adults who are unemployed; 6) percentage of adults over the age of 25 without a high-school diploma or equivalent degree; and 7) median gross rent, as percentage of household income. To confirm that a single-factor structure was present in our census data for the greater Allegheny county, Pennsylvania, PA area, the above variables from all tracts within Allegheny county (N= 416) were entered into a minimum residual factor analysis using oblimin rotation. Prior to this, all variables were natural log transformed to correct non-normal distributions. As expected, a single-factor denoting community SEP at the residential level emerged, although median gross rent was not strongly related to this factor (loading = 0.26) and was therefore removed. The remaining six variables formed a single factor (loadings: 0.56–0.96), accounting for 65% of the total factor variance. Accordingly, a composite indicator of community-level SEP was calculated for each participant by averaging the log and z-transformed values for the 6 remaining census variables, as well as by adjusting variables for loading direction (median factor score = 0.12, SD = 0.85, interquartile range = −0.38–0.61). Consequently, “lower” community-level SEP values represent relative socioeconomic disadvantage at the census tract level of residence. We note here that the Year 2010 Census was in progress, and key variables for the present analyses were not yet released, at the times of study execution, data analysis, and writing. Further, there is cumulative evidence that census indicators of community-level SEP are stable over several decades, even under national conditions of economic transitions and recession trends affecting employment rates and associated income variables (Geronimus and Bound 1998).
All three SEP indicator variables were correlated, with rs = 0.32–0.41, Ps < 0.001. But, consistent with epidemiological convention, analyses were performed separately for each SEP indicator (i.e., years of schooling, household income, and community-SEP), not only to avoid model multicollinearity in statistical analyses, but also because it is understood that different SEP indicators may relate to the same health or neurobiological endpoints through unique pathways or more or less so in extent via the same mediating factors (Gianaros and Manuck 2010). In other words, different indicators of SEP are not redundant or interchangeable across levels of analysis and are not recommended to be aggregated (Braveman et al. 2005).
Assessment of Mediators and Alternative Explanatory Factors
To test whether anthropometric, behavioral, and molecular factors linked to systemic inflammation partially mediated any observed associations between SEP indicators and white matter variables, participants completed assessment protocols distributed over 3 visits, all scheduled within a median of 6 weeks.
At the first visit, we reconfirmed eligibility by a medical history interview, and asked for demographic and socioeconomic information. In remaining visits, we administered protocols to assess health behaviors, anthropometric measures, fasting blood draws by phlebotomy of the antecubital vein (occurring between 7 and 11 AM), psychosocial factors, including current levels of life stress and depressive symptoms, and general intellectual ability.
The three primary mediator variables tested in this study were 1) waist circumference (an anthropometric indicator of relative adiposity, measured at end-expiration to the nearest 1/2 in with a tape measure centered at the umbilicus) (M = 35.64, SD = 5.17 inches), 2) smoking history [coded as never smoked {0, N= 99}, formerly smoked {1, N= 31}, and currently smoke {2, N= 25}], and 3) circulating levels of high-sensitivity CRP in mg/dL, which was assayed by a CRPH reagent on a SYNCHRON LX System (Beckman Coulter, Inc., with precision values of 5.0%CV within-run and 7.5%CV total for serum assays) in the Clinical Services Laboratory of the Department of Psychiatry at the University of Pittsburgh (certified by federal Clinical Laboratory Improvement Amendments). Prior to analyses, CRP values (M = 0.28, SD = 0.47, range = 0.02–3.7) were natural-log transformed because of a skewed distribution. It is important to note that high-sensitivity CRP levels are stable over periods appreciably exceeding our median study visit-completion interval of 6 weeks (e.g., 1–5 years; Ridker 2007). Further, no subjects who were tested reported or exhibited symptoms of an acute illness that could plausibly affect CRP values.
For ancillary analyses of potential alternative explanatory factors, we tested the possibility that two putative psychosocial correlates of socioeconomic disadvantage, life stress and depressive symptoms, impacted (partially accounted for) associations between SEP indicators and white matter variables. To this end, recent levels of life stress, defined as the extent to which an individual appraised life situations over the last month as unpredictable, uncontrollable, and overloading, were assessed by the 10-point, Perceived Stress Scale (Cohen et al. 1983), M = 1.34, SD = 0.60, α = 0.87. Participants also completed the Beck Depression Inventory (BDI-II) to assess depressive symptoms (Beck et al. 1996), M = 3.6, SD = 3.6, α = 0.69.
Diffusion Tensor Imaging Acquisition
At the second study visit, magnetic resonance imaging (MRI) was performed on a 3-Tesla Trio TIM whole-body MRI scanner (Siemens), equipped with a 12-channel phased-array head coil. DTI was performed using a pair of pulsed-gradient, spin-echo sequences with a single-shot echo-planar imaging readout. A parallel imaging algorithm (generalized autocalibrating partial-parallel acquisition; GRAPPA) was applied during diffusion imaging to reduce echo-planar distortion. DTI parameters were: time-to-repetition (TR) = 5800 ms; time-to-inversion (TI) = 2500 ms; time-to-echo (TE) = 91 ms; flip angle = 90°; pixel size = 2 × 2 mm; resolution = 128 × 128 [with field-of-view {FOV} = 256 × 256 mm]; 43 slices of 3 mm thickness with no gap; and total imaging time = 6 min and 19 s. Diffusion-sensitizing gradient encoding was applied in 30 uniform angular directions with a diffusion weighting of b = 1000 s/mm2. A reference image with no diffusion gradient (b = 0) was also acquired. The acquisition sequence was repeated twice to improve the DTI signal-to-noise ratio.
Diffusion Tensor Imaging Processing and Analysis
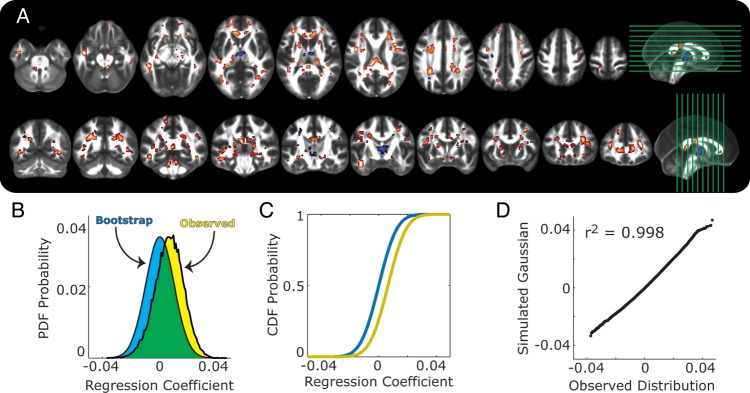
DTI data were first processed using the FSL Diffusion Toolbox (v2.0; http://www.fmrib.ox.ac.uk/fsl/fdt/index.html), which encompassed the following steps: correction for motion and eddy current distortions by affine registration to the reference image, removal of skull and nonbrain tissue, and calculation of diffusion parameters by fitting the diffusion images to a diffusion tensor model. Specifically, the voxelwise eigenvalues λ1, λ2, and λ3 and the eigenvectors of the diffusion tensor were computed from each participant's image. Fractional anisotropy (FA) values were computed from the eigenvalues by the following equation:
 |
1 |
where λ1 corresponds to the largest eigenvalue reflecting water diffusivity parallel to the principle fiber direction (axial diffusivity, AD), and where λ2 and λ3 correspond to perpendicular water diffusivity (radial diffusivity, RD).
FA is a common white matter measure derived from DTI, and it represents the “shape” of the underlying water diffusion in each voxel. As barriers, like axons, neurofilaments, and myelin restrict water movement, water diffusion becomes more anisotropic (Hagmann et al. 2006). Hence, an FA value of 0 indicates perfectly spherical diffusion (i.e., no barriers), whereas an FA value of 1 indicates water that moves in a perfect line as constrained by surrounding barriers. In this way, larger FA values presumably reflect a greater “integrity” of the barriers constraining the directional diffusion of water.
For the analyses presented first, we used the FSL tract-based spatial statistics toolbox (TBSS; v1.2, http://www.fmrib.ox.ac.uk/fsl/tbss/index.html) to compute a skeleton-projected FA map for each participant following prior guidelines (Smith et al. 2007). For these analyses, FA images were eroded to remove likely outliers from the diffusion tensor-fitting step. Second, FA images were normalized to the 1 × 1 × 1-mm MNI152 stereotaxic space via the FSL FA template (FMRIB58_FA). This was done by combining two transformations: 1) a nonlinear registration of each participant's FA image to the FMRIB59_FA template, and 2) an affine transformation of the template to MNI152 space. Third, a mean FA image of all participants was computed and “thinned” to create a skeleton, or a single surface line corresponding to the center of the tracts common to all participants. Fourth, a threshold was applied to the mean skeleton according to convention (Smith et al. 2007) to retain FA values above 0.2. Finally, each participant's FA map was projected onto the mean FA skeleton by searching for the local center of the relevant white matter tract (i.e., the location of the local maximum of FA values). This was done to account for residual misalignments uncorrected by the nonlinear registration described above. After processing, each image was smoothed with a 2-mm3 Gaussian smoothing kernel.
After these TBSS procedures, the mean FA was computed for the entire white matter skeleton of each participant to first examine “global” white matter characteristics in association with SEP indicators by correlational analyses (skeleton FA M = 0.46, SD = 0.17). These initial, global analyses were followed by regression analyses described below to further test the distributional extent of global effects, as well as to characterize “regional” white matter associations with SEP indicators and mediation (path) effects accounted for by inflammatory factors (waist circumference, smoking status, and CRP).
Regression Modeling for Multiple Mediator Testing
Mediation analyses were performed by a regression approach with bootstrapping (Preacher and Hayes 2008) using the Bootstrap Regression Analysis of Voxelwise Observations (BRAVO) toolbox. Documentation and tutorials for this new toolbox, which is described for the first time in this report, are available at: https://sites.google.com/site/bravotoolbox.
For regression and mediation analyses, white matter voxels were selected from the raw DTI images (not processed using the TBSS procedures above) by identifying voxels with FA values >0.3 to increase the likelihood of excluding gray matter voxels. And only data from the smoothed FA maps were used for mediational regression analyses (4-mm full-width half-maximum smoothing kernel). Processing and analysis were then performed iteratively for each white matter voxel and began by extracting FA values for each participant.
All variables were z-scored prior to analysis, permitting a comparison of effect sizes across mediation models. “Total path” effects (c paths) were modeled using ordinary least squares regressions of FA values on each SEP indicator, after controlling for age and sex (i.e., by a similar model as in eq. 3 below, but without mediation terms). “Direct path” effects (c′ paths) were modeled as the associations of SEP predictors with FA values, after controlling for age, sex, and mediator variables corresponding to the indirect paths. “Indirect path” effects were modeled as the product of the association of each SEP indicator (a paths) with the mediating variables and the associations of the mediating variables with FA values (b paths). In every indirect path (a*b path) test of an SEP indicator, smoking and waist circumference values were treated as mediators in the same model (i.e., their terms were entered simultaneously for multiple mediator modeling). Then, a second set of multiple mediator analyses was performed to determine the indirect influences of smoking and waist circumference on FA through CRP in white matter areas where significant mediation effects were detected for SEP indicator variables.
The parameters a, b, and c′ were determined by the following ordinary least squares regression models
| 2 |
| 3 |
where YFA is the n × 1 vector of FA values, and where n is the number of subjects with viable FA images (N = 145, see below). M is the n × m vector of mediator variables, where m is the number of mediating factors being evaluated. When m> 1, M is a matrix, and thus, the first equation is a multivariate regression problem wherein b becomes a 1 × m vector instead of a scalar value. The vectors CAge and CSex are nuisance covariates, with effect sizes φ1 and φ2, respectively, and η is the residual error in each model. Hence, the strength of the indirect pathway is determined as the product of the a and b coefficients (i.e., a*b).
A bootstrap permutation test approach was used to evaluate the significance of the direct and indirect pathways at each voxel (Manly 1997; Preacher and Hayes 2008). For each iteration of the algorithm, the values in the variable vectors (XSEP, YFA, and M) were scrambled independently. The values for a, b, c′, and a*b from these permuted models were stored in a separate matrix, and this process was repeated for 500 iterations per voxel. The significance of the direct and indirect paths was determined from the distribution of bootstrapped values using a bias-corrected and accelerated method (DiCiccio and Efron 1996) at a one-tailed criterion of α of 0.025. The advantage of this bootstrap permutation approach over conventional parametric mediation tests (e.g., Sobel's Z; MacKinnon et al. 2002; Preacher and Hayes 2008) is that it is a nonparametric statistical inference method—meaning that the non-Gaussian characteristics of the smoking, waist circumference, and CRP vectors will not bias inferential assumptions of the tests.
The influence of each factor in M on the relationship between the independent and dependent variable pair was summarized as the percentage of voxels wherein the indirect paths (i.e., a*b) were significant at α = 0.05 (2-tailed). In this case, our analysis focused on the probability of detecting a significant indirect pathway effect in any voxel within the entire set of white matter voxels, making this probability the measure of whole-brain mediation effects. Hence, with the α level used, spurious significant detections would be observed in approximately 5% of voxels showing significant mediation effects (2.5% positive effects and 2.5% negative). Because the unit of analysis was the percentage of voxels with significant mediating pathways, the number of comparisons for each test was at most two (i.e., smoking and waist circumference in the SEP tests). Therefore, the whole-brain Bonferonni-corrected chance levels would increase to a maximum of 7.53% detection of spurious mediation effects in the most conservative case.
To determine the spatial distribution of FA effects in voxelwise regression models, we identified clusters of voxels using an edge-based connectivity approach (Thurfjell et al. 1992). To this end, we employed a corrected false-discovery rate and cluster-level threshold of 0.05 using an extent threshold of k ≥20 contiguous voxels to account for multiple comparisons (Genovese et al. 2002).
Region-of-Interest Analysis
To enable a regionally specific characterization of SEP associations with DTI variables, we used an a priori, 48-tract white-matter atlas (Mori et al. 2005) (http://cmrm.med.jhmi.edu/). For bilateral tracts, values were combined across hemispheres. And, for each region-of-interest (ROI) tract, FA values across all voxels were extracted. In the first stage of this analysis for SEP indicators, we calculated the percentage of voxels within each ROI that had a bootstrap-estimated P< 0.05, with the directionality of the relationship ignored (for each SEP indicator). To compute chance detection ranges, we determined the multiple-comparison-corrected 95% confidence intervals (CIs) based on the across-ROI results from the random noise regressor term (see above). To do this, we determined the upper and lower bounds of the CI as:
| 4 |
where μ is the mean correlation across ROIs for the random noise model, σ is the variance, n is the number of ROIs in the set (i.e., 27, with 6 being unilateral and the remaining being the combination of 42 bilateral tracts) and α = 0.05. This resulted in an upper and lower bound estimate of 11.1% and 1.8%, respectively. For the second stage of the ROI tract analyses, we calculated the mean and 95% CI of the simple regression coefficients for each SEP indicator across voxels in each ROI. A similar adjustment for multiple comparisons was performed on the α term for these CIs, as shown in equation 4; however, the sample size n used in the denominator term was the number of voxels in the ROI.
Missing Data
Reduced sample sizes for some analyses were due to variables missing at random. These included missing DTI data due to motion artifacts or participant withdrawal during scanning (N = 10), missing income data due to nondisclosure (N = 4), missing CRP data due to problems with phlebotomy or CRP values below the minimum sensitivity threshold (N = 11), and missing community-level SEP data due to indeterminate residential addresses within the census database (N = 4). Accordingly, degrees of freedom are reported for each analysis, with samples sizes ranging from N = 136 to N = 145. Critically, the 145 participants with complete DTI data did not differ from those without DTI data in any of the 3 primary SEP indicators used as predictor variables (all P > 0.37). Finally, despite missing data, all regression analyses were statistically powered to detect mediated effects that were medium-to-large in magnitude (Fritz and Mackinnon 2007).
Results
White Matter Fractional Anisotropy Associates with Socioeconomic Indicators
We first tested for positive associations between individual, household, and community indicators of SEP and a global (whole-brain) indicator of white matter integrity derived from DTI; namely, the mean fractional anisotropy (FA) value computed across an entire white matter skeleton.
Mean FA values were positively associated with each SEP indicator variable: years of schooling (r= 0.20, P= 0.02), household income (r= 0.24, P= 0.005), and community-level SEP (r= 0.17, P= 0.045), with N = 141–145. After statistically controlling for age and sex, the association between mean FA values and years of schooling trended toward significance (partial correlation (pr)= 0.15, P= 0.08), but persisted for household income (pr= 0.19, P= 0.02) and community-level SEP (pr= 0.19, P= 0.03), with all df = 134. Moreover, results were unchanged after controlling not only for age and sex, but also for the influence of two potential alternative explanatory factors: reported levels of life stress and depressive symptoms. Hence, the association between mean FA values and years of schooling again trended toward significance (pr= 0.15, P= 0.09), but persisted for household income (pr= 0.19, P= 0.03) and community-level SEP (pr= 0.20, P= 0.02), with all df = 132. And it is noteworthy here that in partial correlation analyses controlling for age and sex, mean FA values were not significantly associated with reported levels of life stress or depressive symptoms (rs ranged from −0.09 to −0.01, P > 0.32,), with df = 134.
Thus, individual, household, and community SEP indicators were positively associated with a global indicator of white matter integrity, as reflected by mean FA values. The reported levels of life stress and depressive symptoms (which were unrelated to mean FA) did not appear to represent plausible alternative explanatory factors.
Inflammatory Variables Associate with Socioeconomic Indicators and White Matter Fractional Anisotropy
Prior to mediational testing, the relationships between individual, household, and community SEP indicators and targeted inflammatory mediator variables were examined in correlation and nonparametric analyses that controlled for age and sex. As expected, smoking status (never smoked, 0; formerly smoked, 1; currently smoke, 2) was inversely related to each SEP indicator: years of schooling (Kendall's tau-b= −0.38, P< 0.001), household income (Kendall's tau-b= −0.20, P= 0.002), and community-level SEP (Kendall's tau-b= −0.25, P< 0.001), with all df = 147–151. Waist circumference was also inversely associated with years of schooling (pr= −0.20, P= 0.02) and community-level SEP (pr= −0.25, P= 0.002), but waist circumference's inverse association with household income did not reach significance when controlling for age and sex (pr= −0.08, P= 0.31), with all df = 147–151. Further, CRP was inversely associated with years of schooling (pr= −0.21, P= 0.01), household income (pr= −0.17, P= 0.04), and community-level SEP (pr= −0.16, P= 0.05), with all df = 136–140. And again, accounting for reported life stress and depressive symptoms did not change the direction or statistical significance of any of these associations. Accordingly, the latter two variables were omitted from further consideration (see Discussion).
Finally, we examined associations of each targeted inflammatory mediator variable with mean FA values while accounting for age and sex. FA values were inversely and significantly associated with smoking status (Kendall's tau-b= −0.14, P= 0.04) and CRP (pr= −0.17, P= 0.05), and marginally with waist circumference (pr= −0.15, P= 0.08), with df = 136–145.
Socioeconomic Indicators Associate with a Positive Shift in the Distribution of Voxelwise Fractional Anisotropy Values
The observations above suggested that individual, household, and community SEP indicators relate positively to mean FA at a global (whole-brain) level, and that these relationships were unlikely to be explained by age, sex, life stress, and depressive symptoms. Also, targeted inflammatory mediators showed inverse associations with SEP indicators and mean FA values. Accordingly, to test the distributional range of SEP associations with white matter throughout the brain, as well as to test the regional specificity and mediated effects of these associations, we next performed a series of voxelwise regression analyses to capture interindividual variation at the group level of analysis (cf. Beckmann et al. 2003). Thus, for each SEP indicator (predictor variable), we first identified clusters of voxels showing total path associations (the “c path” in mediational terminology, see Materials and Methods; Preacher and Hayes 2008) with white matter FA while controlling for multiple comparisons engendered by voxelwise testing.
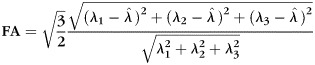
Figure 1A shows the spatial distribution of regression coefficients reflecting the association of years of schooling and FA values (c path at a 2-tailed threshold of P < 0.05, clusterwise false-discovery rate of 0.05) across white matter voxels, after controlling for age and sex. Consistent with the mean FA value analyses above, more educational schooling related positively to FA (warm voxels in Fig. 1A).
Figure 1.
Shown are associations between years of schooling and fractional anisotropy (FA). (A) Clusters of voxels where increased years of schooling exhibited associations with FA. Warm-colored voxels reflect positive associations, and cool-colored voxels show negative associations. Side panels show slice placements. All voxels were adjusted for multiple testing at the cluster level, with a minimal cluster size of 20 voxels. (B) Probability density functions of regression coefficients for the total effects of schooling on FA, after controlling for age and sex. Yellow shows the observed distribution, and the blue shows the average distribution from the bootstrap permutation tests. (C) Cumulative distribution functions for the same data as in B. Same color terms used for observed and bootstrapped data. (D) Q–Q plot comparing the observed distribution in B to a Gaussian distribution with the same mean and variance.
To evaluate the global extent of these education-FA associations, we examined the distribution of c path regression coefficients across white matter voxels. If years of educational schooling was only associated with changes in a small number of white matter voxels, then one would expect the distribution of coefficients to be skewed or to have heavy tails (e.g., a t-distribution), but have the first moment centered near zero. Conversely, if schooling has a more global association with white matter FA values, then the distribution of coefficients should be normally distributed and shifted away from the expectations of chance. Our analysis confirmed the latter pattern: the distribution of total c path coefficients was positively shifted (Fig. 1B,C; yellow histogram and lines) from the expectations of chance, as estimated by the average bootstrap distribution of coefficients (Fig. 1B,C; blue histogram and lines). Indeed, the observed education-FA distribution had an 87% overlap with a chance distribution (green area in Fig. 1B), indicating that 13% of voxels (ca. 7095 voxels, corresponding to a volume of 14 190 mm3 of brain tissue) disconfirmed chance expectations. Moreover, a quartile–quartile (Q–Q) plot comparison confirms that the distribution of regression coefficients for the c path matched the expectations of a Gaussian distribution (Fig. 1D).
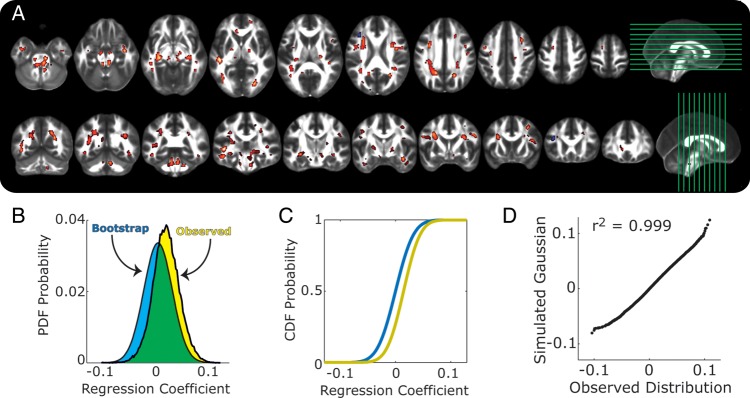
Figure 2A shows the spatial distribution of regression coefficients reflecting the association of occupant-adjusted household income and FA values (c path at a 2-tailed threshold of P <0.05, false-discovery rate of 0.05) across white matter voxels, after controlling for age and sex. As for years of educational schooling, higher household incomes were associated with higher FA values (warm voxels in Fig. 2A). Moreover, the regression coefficients corresponding to the total c path effects relating household income to FA values across all white matter voxels showed an overall and positive distributional shift (Fig. 2B,C; yellow). Finally, the distribution of the coefficients for the income-FA associations overlapped with 81% of a chance distribution (Fig. 2B; green area), meaning that 19% of white matter voxels (ca. 10 370 voxels, corresponding to 20 740 mm3 of brain tissue) fell outside of chance ranges. Finally, the distribution of total income effects conformed to the expectations of a normal Gaussian distribution (Fig. 2D).
Figure 2.
Aassociations of occupant-adjusted household income and FA are shown, with the same plotting conventions as in Figure 1A–D.
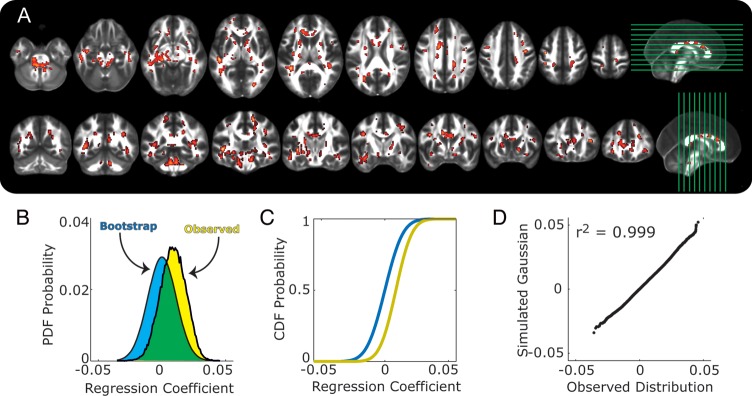
Figure 3A shows the spatial distribution of regression coefficients reflecting the association of community-level SEP derived from US census data corresponding to areas of participant residence and FA values (c path at a 2-tailed threshold of P < 0.05, false-discovery rate of 0.05) across white matter voxels, after controlling for age and sex. Similar to the associations described above, FA values were mostly positively related to community-level SEP (warm voxels in Fig. 3A). And, as found for the individual and household level SEP indicators, the distribution of regression coefficients was shifted in a positive direction away from chance expectations (Fig. 3A,C), with 15% of voxels (ca. 8180, corresponding to 16 360 mm3 of brain tissue) falling outside of chance ranges. Also as found above, the distribution of effects fit normal Gaussian expectations according to a Q–Q comparison (Fig. 3D).
Figure 3.
Associations of community-level SEP and FA are shown, with the same plotting conventions as in Figures 1 and 2A–D.
Distributed Socioeconomic Associations with Fractional Anisotropy are Unlikely to be an Artifact of the Voxelwise Analysis Approach
Individual, household, and community SEP indicators were associated with a positive shift in the distribution of FA values (panel B of Figs. 1–3), suggesting a global or widespread association with white matter integrity. The similarity in the pattern of results across these SEP indicators could, however, suggest an artifact of the analysis process itself (i.e., perhaps any random variable would positively correlate with FA on a voxelwise basis). To test this possibility, we repeated the analysis steps for the total or c path effects using a random variable from a Gaussian distribution that was not correlated with any of the SEP indicators (max r= 0.034). In contrast to the global and positive shift observed for the three SEP variables, this random noise term resulted in nearly equal positive and negative “significant” voxels (Supplementary Fig. S1). Moreover, the distribution of regression coefficients had a greater (96%) overlap with the chance distribution estimated from bootstrapping (Supplementary Fig. S1B,C) than any of the SEP predictor variables themselves. Given that this was a Gaussian noise term, it is not surprising that the Q–Q analysis confirmed the normality of these effects (Supplementary Fig. S1D); however, it does confirm that the c path effects of SEP were as normally distributed as empirically possible (Figs. 1D, 2D, and 3D). Thus, control analyses confirmed that the distributions of the observed SEP associations reflecting total c path effects are greater than what would be expected from random chance and not an artifact of the analysis approach.
Axial versus Radial Diffusivity as Determinants of Fractional Anisotropy Changes
By the nature of its calculation (Methods and Materials), FA can be affected by changes in AD and RD, but proportional changes in both components are known to have little or no effect on resulting FA values. Put differently, FA can be more positively correlated with AD or more negatively correlated with RD. These are important considerations because changes in AD or RD themselves can reveal more precise information about white matter architecture than FA alone. Hence, immunohistochemical evidence shows that decreases in “axonal” integrity largely affect (decrease) AD (with minimal effects on RD) and that decreases in “myelin” integrity largely affect (increase) RD (without affecting AD) (Budde et al. 2009; Klawiter et al. 2011).
To probe the potential determinants of the SEP-FA associations revealed above, we examined suprathreshold voxels from the SEP analyses and correlated the FA in each voxel with its AD and RD components. Figure 4 shows the distribution of these correlations for individual, household, and community SEP indicators. In each case, FA was more strongly correlated with RD than with AD (all t > 59.90), meaning that RD exerted stronger influences on overall FA changes than did AD. Further, in all cases, the mean of the RD correlations was approximately 1 SD away from 0, and the upper bounds of the 99.9% CIs on the mean correlation values were all >0 (years of schooling: negative voxels mean = −0.1137, 99% CI = −0.1124 to −0.1129; positive voxels mean = −0.1812, 99% CI = −0.1812 to −0.1811; household income: negative voxels mean = −0.1543, 99% CI = −0.1504 to −0.1582; positive voxels mean = −0.1775, 99% CI = −0.1774 to −0.1775; community-level SEP: negative voxels mean = −0.1998, 99% CI = −0.1989 to −0.2006; positive voxels mean = −0.1764, 99% CI = −0.1763 to −0.1764). Thus, FA variation appeared to be more strongly accounted for by RD than AD in those voxels exhibiting significant total SEP-FA (c path) relationships in analyses accounting for multiple comparisons.
Figure 4.

Correlations between FA and axial diffusivity (AD; open bars) and radial diffusivity (RD, filled bars). Data were analyzed separately for voxels with significant positive or negative total path effects for years of schooling (A), household income (B), and community-level SEP (C). Error bars show standard deviation of the distributions.
Socioeconomic Associations with Fractional Anisotropy in Specific White Matter Tracts
Figures 1–3 show widespread or globally distributed and positive associations between individual, household, and community SEP indicators and FA. However, based on the distributions of suprathreshold clusters of voxels, it is possible that FA values within some white matter tracts may be more strongly or consistently associated with SEP indicators than others. To test this possibility, we used an a priori set of white matter tracts (ROIs) based on previous neuroanatomical studies (Mori et al. 2005) to characterize the associations of each SEP indicator with regional (tract based) FA. After controlling for multiple statistical testing and the influences of age and sex, we found that the number of ROIs exhibiting significant FA associations exceeded the 5% predictions of chance (52% of the ROIs for years of schooling, 85% for household income, and 67% for community-level SEP). Moreover, the FA in 9 of 27 ROI tracts exhibited consistent and significant associations with “all three” indicators. These tracts were the pontine crossing tract, the cerebellar and cerebral peduncles, corona radiata, thalamic radiation, sagittal stratum, stria terminalis, superior longitudinal fasciculus, and the uncinate (Table 1).
Table 1.
Associations between white matter fractional anisotropy and socioeconomic indicator variables controlling for age and sex
| Education |
Income |
Community socioeconomic variable from census data |
||||||||||
| Tract |
% Sig. |
Coeff. |
UB |
LB | % Sig. | Coeff. | UB | LB | % Sig. | Coeff. | UB | LB |
| Middle cerebellar peduncle | 5.3 | 0.010 | 0.012 | 0.009 | 9.6 | 0.008 | 0.008 | 0.007 | 1.2 | 0.024 | 0.028 | 0.021 |
| Pontine crossing tract | 12.6 | 0.011 | 0.016 | 0.006 | 8.7 | 0.008 | 0.009 | 0.006 | 11.5 | 0.048 | 0.065 | 0.031 |
| Corpus callosum (genu) | 7.6 | 0.018 | 0.020 | 0.017 | 38.9 | 0.017 | 0.017 | 0.016 | 34.0 | 0.143 | 0.149 | 0.138 |
| Corpus callosum (body) | 1.2 | 0.010 | 0.011 | 0.009 | 36.9 | 0.015 | 0.015 | 0.014 | 20.6 | 0.102 | 0.107 | 0.097 |
| Corpus callosum (splenium) | 6.7 | 0.010 | 0.011 | 0.008 | 11.0 | 0.005 | 0.006 | 0.004 | 24.0 | 0.102 | 0.107 | 0.096 |
| Fornix | 0.0 | 0.006 | 0.009 | 0.004 | 0.0 | 0.001 | 0.003 | 0.000 | 2.5 | −0.059 | −0.044 | −0.074 |
| Corticospinal | 23.4 | 0.020 | 0.029 | 0.011 | 32.5 | 0.016 | 0.018 | 0.014 | 4.2 | −0.032 | −0.009 | −0.054 |
| Medial lemniscus | 24.9 | 0.024 | 0.031 | 0.017 | 32.5 | 0.013 | 0.016 | 0.009 | 7.7 | −0.012 | 0.012 | −0.036 |
| Inferior cerebellar peduncle | 6.5 | 0.025 | 0.028 | 0.021 | 11.2 | 0.011 | 0.013 | 0.009 | 2.2 | 0.034 | 0.050 | 0.017 |
| Superior cerebellar peduncle | 52.5 | 0.047 | 0.053 | 0.041 | 47.1 | 0.019 | 0.021 | 0.017 | 23.8 | 0.102 | 0.128 | 0.076 |
| Cerebral peduncle | 17.5 | 0.025 | 0.030 | 0.020 | 30.5 | 0.014 | 0.016 | 0.012 | 12.2 | 0.065 | 0.085 | 0.044 |
| Internal capsule (anterior limb) | 6.3 | 0.010 | 0.015 | 0.004 | 28.2 | 0.013 | 0.016 | 0.011 | 34.9 | 0.122 | 0.146 | 0.099 |
| Internal capsule (posterior limb) | 16.6 | 0.028 | 0.032 | 0.023 | 18.4 | 0.012 | 0.014 | 0.010 | 2.9 | 0.030 | 0.048 | 0.012 |
| Internal capsule (retrolenticular) | 8.0 | 0.010 | 0.017 | 0.004 | 9.9 | 0.008 | 0.010 | 0.006 | 9.1 | 0.041 | 0.064 | 0.017 |
| Corona radiata (anterior) | 5.4 | 0.005 | 0.010 | −0.001 | 5.6 | 0.007 | 0.009 | 0.005 | 14.5 | 0.083 | 0.106 | 0.059 |
| Corona radiata (superior) | 10.7 | 0.019 | 0.024 | 0.014 | 4.9 | 0.003 | 0.006 | 0.001 | 12.9 | 0.034 | 0.062 | 0.007 |
| Corona radiata (posterior) | 22.9 | 0.028 | 0.033 | 0.023 | 12.5 | 0.009 | 0.011 | 0.006 | 21.4 | 0.082 | 0.108 | 0.055 |
| Thalamic radiation (posterior) | 11.1 | 0.022 | 0.027 | 0.018 | 13.4 | 0.009 | 0.011 | 0.007 | 12.2 | 0.064 | 0.087 | 0.041 |
| Sagittal stratum | 10.8 | 0.015 | 0.021 | 0.009 | 23.7 | 0.011 | 0.014 | 0.008 | 15.9 | 0.073 | 0.097 | 0.048 |
| External capsule | 3.7 | 0.015 | 0.020 | 0.010 | 15.3 | 0.011 | 0.013 | 0.009 | 7.5 | 0.076 | 0.096 | 0.057 |
| Cingulum (cingulate gyrus) | 6.5 | 0.007 | 0.013 | 0.001 | 12.0 | 0.007 | 0.010 | 0.005 | 11.9 | 0.056 | 0.083 | 0.029 |
| Cingulum (hippocampus) | 9.2 | 0.025 | 0.030 | 0.021 | 19.4 | 0.013 | 0.016 | 0.011 | 4.6 | 0.071 | 0.089 | 0.054 |
| Fornix stria terminalis | 38.4 | 0.033 | 0.042 | 0.025 | 26.8 | 0.012 | 0.015 | 0.009 | 29.6 | 0.120 | 0.143 | 0.097 |
| Superior longitudinal fasciculus | 22.9 | 0.025 | 0.031 | 0.020 | 18.0 | 0.011 | 0.013 | 0.008 | 16.5 | 0.059 | 0.087 | 0.031 |
| Superior fronto-occipital fasciculus | 2.6 | 0.013 | 0.017 | 0.008 | 9.6 | 0.009 | 0.011 | 0.007 | 1.8 | 0.035 | 0.057 | 0.013 |
| Uncinate fasciculus | 9.4 | 0.008 | 0.015 | 0.002 | 9.4 | 0.011 | 0.012 | 0.009 | 10.4 | 0.106 | 0.121 | 0.090 |
| Tapetum | 4.7 | 0.013 | 0.018 | 0.007 | 6.0 | 0.004 | 0.006 | 0.002 | 14.1 | −0.022 | 0.011 | −0.055 |
A summary of a priori white matter tract analyses is shown. For each white matter tract, we first computed the percentage of voxels that were significantly associated with each SEP predictor variable, after controlling for age and sex. Tracts in bold reflect tracts where these percentages are greater than the upper bound (UB) of the 95% CI (adjusted for multiple comparisons) calculated from the across-tract pattern revealed by the random control variable described in Materials and Methods. Note that the lower bound (LB) of the 95% CIs on these regression values, across all tract-based voxels, typically did not include the 0 term. This is true for 96.5% of the regional associations with years-of-schooling and household income, and 85.2% of regional associations with the community-level SEP.
We note that these ROI analyses identify several white matter tracts appearing to exhibit consistent FA associations with SEP. However, it is notable that the associations were positive in nearly all ROIs (Table 1). Thus, while the regional associations of SEP were particularly consistent and positive in several white matter tracts, this effect was generally expressed on a widespread basis across nearly all white matter regions tested, as consistent with the mean FA analyses presented first and the voxelwise analyses detailed above.
Inflammatory Factors Mediate Socioeconomic Associations with Fractional Anisotropy
For each SEP indicator and following the total (c path) effects described above and shown in Figures 1–3, we used regression modeling with bootstrapping (Manly 1997) to determine the indirect paths (or a*b paths in mediation terminology, see Materials and Methods) that partially mediated (Preacher and Hayes 2008) the SEP-FA associations using the BRAVO toolbox (https://sites.google.com/site/bravotoolbox/). These analyses fall within the class of linear modeling procedures that quantify interindividual variation in brain imaging data at the group level (cf. Beckmann et al. 2003).
To first determine the degree of partial mediation exhibited by the behavioral factor, smoking, and the anthropometric factor, adiposity (as estimated by waist circumference), in the relationship between SEP indicators and FA, we quantified the percentage of voxels showing significant mediating path effects (P < 0.05, wherein 5% detection reflects the false positive detection rate) in a multiple mediator model.
Figure 5 illustrates the results of this multiple mediator analysis. As shown, for each of the three SEP indicators, smoking was a robust indirect mediator of the relationships with FA (56.1–66.4% of white matter voxels had significant mediation paths). By contrast, adiposity (measured as waist circumference) was a robust mediator for only years-of-schooling and community-level SEP (35.0–47.3% of voxels), while the number of significant mediating voxels for income was weaker, but above chance expectations (13.8% of voxels). For all three SEP indicators, voxels with significant mediating paths were not isolated in specific white matter tracts, but appeared to be widely distributed throughout the brain, as consistent with the total path effects reported above (Fig. 5C). The average coefficient value across all white matter voxels for all these indirect paths was positive, reflecting the combination of the two negative indirect mediator paths (SEP indicator to smoking or adiposity and smoking/adiposity to FA), fitting with the direction predicted by the hypothesis that lower SEP (relative socioeconomic disadvantage) would associate with reduced FA via the paths of increased levels of smoking and adiposity.
Figure 5.

Results of mediation analysis. (A) Diagram of indirect path effects of smoking and adiposity (waist circumference) for each of the three SEP indicators. Line thickness denotes the percentage of white matter voxels with significant effects. These percentages are shown on the left along with the average path coefficient across all white matter voxels in the brain. (B) Direct and indirect path effects for smoking status and adiposity factors through the CRP term, with the same plotting conventions as in A. (C) Distribution of voxels with significant indirect paths for the results shown in A. These maps were adjusted for multiple-testing at the cluster level with a minimum cluster size of 20 voxels.
It is well established that smoking and adiposity are associated with increases in systemic inflammation, as confirmed in this sample by positive correlations of circulating high-sensitivity CRP with smoking status (Kendall's tau-b= 0.17, P= 0.01) and waist circumference (pr= 0.40, P< 0.001) after controlling for age and sex. Accordingly, we next tested the extent to which circulating CRP accounted for (mediated) the associations of the smoking status and adiposity with FA values. We found that both smoking and adiposity had robust indirect mediating paths to FA values through CRP (Fig. 5B; 51–82% of voxels, respectively). Indeed, this accounted for variance in the direct (c) paths between smoking and adiposity on white matter FA values (6–10% of voxels). And interestingly, after controlling for this direct path, CRP had significant and unique associations with FA in almost a quarter of the voxels in the brain by itself (24%). Notably, the average direct and indirect paths to FA were negative across all white matter voxels. Hence, the negative indirect path reflects the combination of a positive association between smoking/adiposity and CRP levels, with a negative direct path from CRP to FA.
These results appear to confirm the prediction that behavioral (smoking) and anthropometric (waist circumference) factors associated with systemic inflammation (as reflected by CRP) statistically and partially mediate the cross-sectional associations of individual, household, and community SEP indicators and indicators of white matter integrity. To further test the implications of this prediction, we repeated the mediation analysis between each SEP indicator and smoking and adiposity, but also included the CRP term in the models. For comparison, we repeated these analyses with a random white noise predictor term, with the same mean and variance as the CRP variable so that we could directly compare the indirect path coefficients (i.e., the models have the same number of parameters). These random white noise terms were chosen to not be correlated with any of the SEP, smoking, or waist circumference variables. Figure 6 shows the percentage of voxels that no longer exhibited indirect path effects for either smoking (white) or adiposity (gray) after controlling for CRP. The dashed lines show the 95% CIs from the results with the random white noise regressors (N = 6 models).
Figure 6.

Change in the percent of significant voxels for each indirect path shown in Figure 5A when the CRP term is included as a covariate in the model. Dashed lines show the upper and lower 95% CIs from the control analysis, wherein a random noise term was included instead of CRP. Solid line shows the mean value of these control analyses. Percentages are from all white matter voxels. Change from within the subset of originally significant voxels is reported in the text.
In all, including CRP in the models thus accounted for the indirect effects of smoking in about 16.4% of all white matter voxels across all three SEP indicators (15.0%, 16.8%, and 17.5% of voxels that originally had significant indirect effects for years of schooling, household income, and community-level SEP, respectively). These values are outside the 95% CI of chance (11.9% upper bound; dashed lines in Fig. 6). Note here that slightly stronger effects were observed in the mediation paths from years of educational schooling and community-level SEP through adiposity. On average, including CRP in the model removed significant indirect mediation path effects in approximately 22.1% of white matter voxels (25.1%, 13.6%, and 27.5% for years of schooling, household income, and community-level SEP, respectively). In sum, controlling for CRP accounts for a large portion of the variance in the indirect behavioral (smoking) and anthropometric (adiposity) paths from SEP to white matter integrity, as reflected by FA values.
Ancillary Post hoc Findings
An unpredicted and post hoc observation in the present sample was that a modest inverse and univariate association between higher averaged whole-brain FA values derived from the TBSS procedure described above (see Materials and Methods) and fewer errors on the North American Adult Reading Test (r = −0.20, P= 0.01, N = 145), which was used to characterize average general intellectual ability, was reduced by approximately 50% and no longer significant when controlling for the influences of individual education, household income, and community-level SEP indicator variables in a partial correlation analysis (pr = −0.11, P = 0.23). It therefore appeared that more favorable performance on a standard neuropsychological test related to greater white matter integrity (as reflected by higher mean FA values); however, this relationship was no longer significant when accounting for the influences of multilevel socioeconomic indicators.
Discussion
Among middle-aged men and women, reduced white matter integrity, as reflected by reduced FA, related to 1) fewer years of schooling, 2) lower household incomes, and 3) residing in communities characterized by relatively unfavorable financial, employment, and educational circumstances (Figs. 1–3). Further, self-reports of recent life stress and depressed mood did not appear to explain the associations of socioeconomic disadvantage with white matter integrity. Rather, the two modifiable risk factors for chronic illnesses (cigarette smoking and having a larger waist circumference) partially mediated the associations of individual, household, and community socioeconomic indicators with white matter integrity, with mediation effect sizes being largest for cigarette smoking (Fig. 5). Moreover, high-sensitivity CRP, a marker of systemic inflammation and predictor of premature morbidity and mortality (Ridker 2007), accounted for appreciable variance in the smoking and waist circumference mediational paths linking socioeconomic indicators to FA (Fig. 6). Together, these findings agree with some, but not all, predictions of neurobiological models of the complex pathways linking socioeconomic disadvantage and risk for ill health across the lifespan (e.g., Shonkoff et al. 2009; Gianaros and Manuck 2010; Hackman et al. 2010; Miller et al. 2011).
These findings also extend the few existing studies of the neural correlates of socioeconomic disadvantage (reviewed recently in Hackman et al. 2010; Raizada and Kishiyama 2010). Of the most recent, those focused on “morphological” correlates have observed reductions in hippocampal tissue volume among financially disadvantaged children (Hanson et al. 2011), as well as reductions in hippocampal and amygdala volumes among disadvantaged adults experiencing financial hardships (Butterworth et al. 2012). Moreover, reduced hippocampal volume among older adults was shown recently to be predicted uniquely by unfavorable childhood socioeconomic conditions, suggesting that socioeconomic disadvantage may exert long-term or possibly neurodevelopmental effects on brain morphology that persist across the lifespan (Staff et al. 2012). As yet, however, the functional implications of these morphological changes have not been clarified. But recently, more educational schooling among adolescents was associated with better performance on a Stroop color-word interference task (an indicator of executive control), and this functional association was mediated by FA in the cingulum bundle, anterior corona radiata, and superior longitudinal fasciculus (Noble et al. forthcoming). Hence, from a lifespan perspective, our observations in middle-aged adults would appear to extend these recent observations among adolescents. And in further support of this view, a post hoc finding in the present sample was that the inverse association between higher mean, whole-brain FA values and fewer errors on the North American Adult Reading Test was attenuated by (and no longer significant) after controlling for the influences of individual education, household income, and community-level SEP indicator variables. Thus, it would provisionally appear that the present observations have functional implications, insofar as more favorable neurocognitive performance on a standard neuropsychological test is associated with greater white matter integrity (as reflected by higher mean FA values) and that this cross-sectional association among adults relates to socioeconomic inequalities.
In agreement with cumulative epidemiological evidence, indicators of socioeconomic disadvantage in the present study were associated with cigarette smoking, increased visceral adiposity (as reflected by waist circumference), and systemic inflammation (as reflected by CRP) (for reviews, see McLaren 2007; Adler and Rehkopf 2008; Pampel et al. 2010; Braveman et al. 2011; Irwin and Cole 2011). Moreover, lower FA values related to current and former cigarette smoking, larger waist circumferences, and higher CRP levels, which also agree with existing work (Wersching et al. 2010; Gons et al. 2011; Stanek et al. 2011; Verstynen et al. forthcoming). And, demonstrated for the first time to our awareness, the associations of socioeconomic disadvantage with lower FA values were largely accounted for (indirectly mediated) by smoking and waist circumference, with effect sizes being statistically significant—but the least robust—for the path linking years of schooling to FA (Fig. 5). The latter pattern in particular may suggest a greater importance of financial resources and environmental (community level) factors in the prediction of white matter integrity, when compared with educational factors per se. And extending these observations, a systemic inflammatory indicator, CRP, partially mediated the associations of smoking and waist circumference with FA (Fig. 6).
It is noteworthy here that animal evidence indicates that several circulating peripheral markers of systemic inflammation—which are influenced by smoking and levels of adiposity—can breach periventricular blood–brain boundaries and bind with receptors on endothelial cells in brain microvasculature to adversely affect brain morphology and circuit functioning (Irwin and Cole 2011; Rosano et al. 2012; Yirmiya and Goshen 2011). Peripheral inflammatory factors and immune challenges can also engage autonomic afferents to stimulate the production of central cytokines and related signaling molecules by microglial cells (McAfoose and Baune 2009; Yirmiya and Goshen 2011), which can ultimately impact processes such as long-term potentiation (Bellinger et al. 1995), neurogenesis (Monje et al. 2003), synaptic plasticity (Tancredi et al. 2000), dendritic branching (Richwine et al. 2008), and neurotrophic factor expression (Lapchak et al. 1993; Guan and Fang 2006). Human work also shows that levels of peripheral inflammation associate with the morphology of brain regions where central proinflammatory cytokines and related immune receptors are expressed. Hence, an inverse association has been found between interleukin-6, a proinflammatory cytokine that stimulates CRP production by hepatocytes, and hippocampal and prefrontal volumes (Marsland et al. 2008). Thus, modifiable risk factors (smoking and waist circumference) and an associated molecular marker of systemic inflammation (CRP) would appear to be biologically plausible paths linking socioeconomic disadvantage to white matter integrity, with the precise cellular or putative neuroinflammatory mechanisms of action and functional outcomes remaining to be determined.
It is important to note here that previous findings linking socioeconomic indicators to brain morphology, as well as functional outcomes, have often been interpreted from theoretical models emphasizing the adverse role(s) of stress and negative emotions, which may be occasioned by socioeconomic disadvantage (Shonkoff et al. 2009; Gianaros and Manuck 2010; Hackman et al. 2010; Miller et al. 2011). Indeed, socioeconomic disadvantage relates to increased exposure to life stressors, as well as aversive emotional mood states; however, little evidence supports the arguably intuitive notion that psychological stress and related emotional factors fully moderate or mediate the associations of socioeconomic disadvantage to particular behavioral, biological, or neural endpoints (Matthews and Gallo 2011; Matthews et al. 2010). Moreover, in prior neuroimaging studies, psychological stress and negative emotionality have not been tested to our knowledge as candidate mediators of the associations between socioeconomic indicators and measures of brain morphology or neural activity patterns that are presumptively related to neurocognitive processes or other functional outcomes. In view of existing work and based on our null findings regarding life stress and depressed mood, it thus appears that other candidate mediators (e.g., behavioral habits, cognitive enrichment, pathogenic environmental exposures in residential communities) may represent more parsimonious explanations of how socioeconomic disadvantage relates to biobehavioral health outcomes and neurobiological endpoints. However, we recognize the possibility that measures of life stress, depressed mood, emotionality, and even dimensions of sociality such as the quality and quantity of social ties that are linked to socioeconomic inequalities and inflammation (cf. Eisenberger and Cole 2012) could exert explanatory effects that could be more detectable in a larger or more diverse sample than that of the present study. Finally, life stress and depressive symptoms are complex and multidimensional constructs that can be measured at multiple levels of analysis. Hence, it is possible that our short-term and self-report measurements of stress and depressive symptoms captured only limited interindividual variation in these constructs in our otherwise healthy adult sample, limiting our ability to detect associations with socioeconomic indicators and brain morphology. In extension of this point, parental socioeconomic disadvantage was shown recently to predict functional alterations in the prefrontal cortex during rule learning among children, and this effect was mediated not only by the complexity of the home language environment (an indicator of cognitive enrichment), but also by a measure of the stress hormone, cortisol (Sheridan et al. 2012). Accordingly, we maintain that our null findings regarding stress and depressive symptoms should be interpreted with caution, and not as strong evidence against the open question of whether different measures of these factors and their correlates may partially comprise the pathways linking socioeconomic inequalities to neurobiological and health outcomes.
We also appreciate that our cross-sectional study leaves several other questions unanswered. One is whether (or how) socioeconomic and white matter variables are causally or temporally related across the lifespan, spanning from early development to later adulthood. Indeed, the correlational and mediational findings reported in this cross-sectional study do not permit causal inferences. And while it is unfeasible (if not unethical) to randomly assign individuals to different socioeconomic strata to address causality or temporal ordering issues, it is possible that quasi-experimental study designs implemented at the individual, family, or community levels and employing, for example, income and related supplemental programs to improve socioeconomic mobility, may help clarify such issues. We further acknowledge that we studied a relatively well-educated sample, with less than approximately 7% having a high-school diploma or equivalent as their highest degree and approximately 92% being employed at the time of testing. Further, approximately 64% of our sample owned a home. These sample characteristics leave open the questions of whether the present findings will generalize to populations with greater socioeconomic variation, and whether the magnitudes of our correlational and mediational effect sizes would increase or decrease with an increased distributional representation of disadvantaged individuals. Another open and applied question is whether interventions examining the effects of weight loss and smoking cessation on brain morphology and activity could help clarify the nature of the present associations and temporal ordering of directional path effects by measuring socioeconomic indicators and incorporating them as effect modifiers. In this regard, promoting health behaviors, such as physical activity, that reduce adiposity and inflammation may be especially important for disadvantaged individuals, households, and communities. In concert with this suggestion, it is important to note that physical activity interventions to reduce adiposity and obesity have proliferative effects on brain tissue volumes, as well as positive effects on cognition (Voss et al. 2010; Erickson et al. 2011), but it remains unknown as to whether these beneficial effects extend to connective white matter architecture, are moderated by socioeconomic indicators, or mediated by reduced systemic inflammation.
Also unclear is whether an unmeasured “third” variable (e.g., a genetic factor) partially accounted for some of the present associations. In point, higher incomes and more educational schooling have been shown to covary positively with serotonergic neurotransmission in adults, and this covariation is moderated by polymorphic variation in the serotonin transporter gene—such that disadvantaged individuals exhibit blunted serotonergic responsivity to pharmacologic challenge if they posses at least one “short” (or deletion) allele of this polymorphism, which reduces the transcriptional efficiency of the transporter gene (Manuck et al. 2004) and associates with brain morphology in humans and nonhuman primates (Jedema et al. 2010). Thus, future work should consider the plausible and modifying role of heritable or other moderating and mediating factors in predicting brain morphology and related neural outcome variables in the context of SEP. And finally, it will be important to further test the functional significance of the white matter alterations observed in association with SEP indicators, as well as the significance that RD, but not AD, had with respect to putative dysmyelination-like FA alterations in the context of socioeconomic disadvantage (Fig. 4). It may be that white matter alterations partly explain some of the socioeconomic inequalities in specific neurocognitive (e.g., language and executive functions) and related outcomes reported at the epidemiological level (Hackman and Farah 2009; Gianaros and Manuck 2010; Hackman et al. 2010; Noble et al. forthcoming). To elaborate, it is noteworthy that 9 tracts exhibited consistent associations with all 3 SEP indicators studied: the pontine crossing tract, cerebellar and cerebral peduncles, corona radiata, thalamic radiation, sagittal stratum, stria terminalis, superior longitudinal fasciculus, and uncinate (Table 1). These tracts support a broad range of executive, affective, polymodal sensory, language, visceral, and motor control functions. But an open question is whether a core facet of socioeconomic inequality that is common across multiple levels of analysis (individual, household, and community) relates to alterations in these diverse functions by impacting the integrity of the above tracts through inflammatory pathways.
Supplementary Material
Supplementary material can be found at: http://www.cercor.oxfordjournals.org/.
Author contributions
P.J.G. designed research; P.J.G. and L.K.S. performed research; P.J.G., L.K.S., and T.D.V. analyzed data; P.J.G., T.D.V., A.L.M., and K.I.E. wrote the paper. P.J.G. and T.D.V. contributed equally to the writing of this report.
Funding
This work was funded by National Institutes of Health Grants HL089850 and HL101421 to P.J.G.
Supplementary Material
Notes
Sara Snyder and Dr. Israel Christie assisted in data collection and reduction. Dr Daniel Hackman provided constructive comments on a draft of this report. Conflict of Interest: None declared.
References
- Adler NE, Boyce T, Chesney MA, Cohen S, Folkman S, Kahn RL, Syme SL. Socioeconomic status and health: the challenge of the gradient. Am Psychol. 1994;49:15–24. doi: 10.1037//0003-066x.49.1.15. [DOI] [PubMed] [Google Scholar]
- Adler NE, Rehkopf DH. U.S. disparities in health: descriptions, causes, and mechanisms. Ann Rev Public Health. 2008;29:235–252. doi: 10.1146/annurev.publhealth.29.020907.090852. [DOI] [PubMed] [Google Scholar]
- Alley DE, Seeman TE, Ki Kim J, Karlamangla A, Hu P, Crimmins EM. Socioeconomic status and C-reactive protein levels in the US population: NHANES IV. Brain Behav Immun. 2006;20:498–504. doi: 10.1016/j.bbi.2005.10.003. [DOI] [PubMed] [Google Scholar]
- Beck AT, Steer RA, Ball R, Ranieri W. Comparison of Beck Depression Inventories -IA and -II in psychiatric outpatients. J Pers Assess. 1996;67:588–597. doi: 10.1207/s15327752jpa6703_13. [DOI] [PubMed] [Google Scholar]
- Beckmann CF, Jenkinson M, Smith SM. General multilevel linear modeling for group analysis in FMRI. NeuroImage. 2003;20:1052–1063. doi: 10.1016/S1053-8119(03)00435-X. [DOI] [PubMed] [Google Scholar]
- Bellinger FP, Madamba SG, Campbell IL, Siggins GR. Reduced long-term potentiation in the dentate gyrus of transgenic mice with cerebral overexpression of interleukin-6. Neurosci Lett. 1995;198:95–98. doi: 10.1016/0304-3940(95)11976-4. [DOI] [PubMed] [Google Scholar]
- Blair JR, Spreen O. Predicting premorbid IQ: A revision of the national adult reading test. Clin Neuropsychol. 1989;3:129–136. [Google Scholar]
- Braveman P. Health disparities and health equity: concepts and measurement. Ann Rev Public Health. 2006;27:167–194. doi: 10.1146/annurev.publhealth.27.021405.102103. [DOI] [PubMed] [Google Scholar]
- Braveman P, Egerter S, Williams DR. The social determinants of health: coming of age. Ann Rev Public Health. 2011;32:381–398. doi: 10.1146/annurev-publhealth-031210-101218. [DOI] [PubMed] [Google Scholar]
- Braveman PA, Cubbin C, Egerter S, Chideya S, Marchi KS, Metzler M, Posner S. Socioeconomic status in health research: one size does not fit all. J Am Med Assoc. 2005;294:2879–2888. doi: 10.1001/jama.294.22.2879. [DOI] [PubMed] [Google Scholar]
- Budde MD, Xie M, Cross AH, Song SK. Axial diffusivity is the primary correlate of axonal injury in the experimental autoimmune encephalomyelitis spinal cord: a quantitative pixelwise analysis. J Neurosci. 2009;29:2805–2813. doi: 10.1523/JNEUROSCI.4605-08.2009. [DOI] [PMC free article] [PubMed] [Google Scholar]
- Butterworth P, Cherbuin N, Sachdev P, Anstey KJ. The association between financial hardship and amygdala and hippocampal volumes: results from the PATH through life project. Soc Cog Affect Neurosci. 2012;7:548–556. doi: 10.1093/scan/nsr027. [DOI] [PMC free article] [PubMed] [Google Scholar]
- Cohen S, Kamarck T, Mermelstein R. A global measure of perceived stress. J Health Soc Behav. 1983;24:385–396. [PubMed] [Google Scholar]
- DiCiccio TJ, Efron B. Bootstrap confidence intervals. Stat Sci. 1996;11:189–228. [Google Scholar]
- Eisenberger NI, Cole SW. Social neuroscience and health: neurophysiological mechanisms linking social ties with physical health. Nat Neurosci. 2012;15:669–674. doi: 10.1038/nn.3086. [DOI] [PubMed] [Google Scholar]
- Erickson KI, Voss MW, Prakash RS, Basak C, Szabo A, Chaddock L, Kim JS, Heo S, Alves H, White SM, et al. Exercise training increases size of hippocampus and improves memory. Proc Natl Acad Sci U S A. 2011;108:3017–3022. doi: 10.1073/pnas.1015950108. [DOI] [PMC free article] [PubMed] [Google Scholar]
- Friedman EM, Herd P. Income, education, and inflammation: differential associations in a national probability sample (The MIDUS study) Psychosom Med. 2010;72:290–300. doi: 10.1097/PSY.0b013e3181cfe4c2. [DOI] [PMC free article] [PubMed] [Google Scholar]
- Fritz MS, Mackinnon DP. Required sample size to detect the mediated effect. Psychol Sci. 2007;18:233–239. doi: 10.1111/j.1467-9280.2007.01882.x. [DOI] [PMC free article] [PubMed] [Google Scholar]
- Genovese CR, Lazar NA, Nichols T. Thresholding of statistical maps in functional neuroimaging using the false discovery rate. Neuroimage. 2002;15:870–878. doi: 10.1006/nimg.2001.1037. [DOI] [PubMed] [Google Scholar]
- Geronimus AT, Bound J. Use of census-based aggregate variables to proxy for socioeconomic group: evidence from national samples. Am J Epidemiol. 1998;148:475–486. doi: 10.1093/oxfordjournals.aje.a009673. [DOI] [PubMed] [Google Scholar]
- Gianaros PJ, Horenstein JA, Cohen S, Matthews KA, Brown SM, Flory JD, Critchley HD, Manuck SB, Hariri AR. Perigenual anterior cingulate morphology covaries with perceived social standing. Soc Cog Affect Neurosci. 2007;2:161–173. doi: 10.1093/scan/nsm013. [DOI] [PMC free article] [PubMed] [Google Scholar]
- Gianaros PJ, Manuck SB. Neurobiological pathways linking socioeconomic position and health. Psychosom Med. 2010;72:450–461. doi: 10.1097/PSY.0b013e3181e1a23c. [DOI] [PMC free article] [PubMed] [Google Scholar]
- Gons RA, van Norden AG, de Laat KF, van Oudheusden LJ, van Uden IW, Zwiers MP, Norris DG, de Leeuw FE. Cigarette smoking is associated with reduced microstructural integrity of cerebral white matter. Brain. 2011;134:2116–2124. doi: 10.1093/brain/awr145. [DOI] [PubMed] [Google Scholar]
- Guan Z, Fang J. Peripheral immune activation by lipopolysaccharide decreases neurotrophins in the cortex and hippocampus in rats. Brain Behav Immun. 2006;20:64–71. doi: 10.1016/j.bbi.2005.04.005. [DOI] [PubMed] [Google Scholar]
- Hackman DA, Farah MJ. Socioeconomic status and the developing brain. Trends Cogn Sci. 2009;13:65–73. doi: 10.1016/j.tics.2008.11.003. [DOI] [PMC free article] [PubMed] [Google Scholar]
- Hackman DA, Farah MJ, Meaney MJ. Socioeconomic status and the brain: mechanistic insights from human and animal research. Nat Rev Neurosci. 2010;11:651–659. doi: 10.1038/nrn2897. [DOI] [PMC free article] [PubMed] [Google Scholar]
- Hagmann P, Jonasson L, Maeder P, Thiran JP, Wedeen VJ, Meuli R. Understanding diffusion MR imaging techniques: from scalar diffusion-weighted imaging to diffusion tensor imaging and beyond. Radiographics. 2006;26(Suppl 1):S205–S223. doi: 10.1148/rg.26si065510. [DOI] [PubMed] [Google Scholar]
- Hanson JL, Chandra A, Wolfe BL, Pollak SD. Association between income and the hippocampus. PLoS ONE. 2011;6:e18712. doi: 10.1371/journal.pone.0018712. [DOI] [PMC free article] [PubMed] [Google Scholar]
- Irwin MR, Cole SW. Reciprocal regulation of the neural and innate immune systems. Nat Rev Immunol. 2011;11:625–632. doi: 10.1038/nri3042. [DOI] [PMC free article] [PubMed] [Google Scholar]
- Jedema HP, Gianaros PJ, Greer PJ, Kerr DD, Liu S, Higley JD, Suomi SJ, Olsen AS, Porter JN, Lopresti BJ, et al. Cognitive impact of genetic variation of the serotonin transporter in primates is associated with differences in brain morphology rather than serotonin neurotransmission. Mol Psychiatry. 2010;15:512–522. doi: 10.1038/mp.2009.90. [DOI] [PMC free article] [PubMed] [Google Scholar]
- Kershaw KN, Mezuk B, Abdou CM, Rafferty JA, Jackson JS. Socioeconomic position, health behaviors, and C-reactive protein: a moderated-mediation analysis. Health Psychol. 2010;29:307–316. doi: 10.1037/a0019286. [DOI] [PMC free article] [PubMed] [Google Scholar]
- Klawiter EC, Schmidt RE, Trinkaus K, Liang HF, Budde MD, Naismith RT, Song SK, Cross AH, Benzinger TL. Radial diffusivity predicts demyelination in ex vivo multiple sclerosis spinal cords. Neuroimage. 2011;55:1454–1460. doi: 10.1016/j.neuroimage.2011.01.007. [DOI] [PMC free article] [PubMed] [Google Scholar]
- Lapchak PA, Araujo DM, Hefti F. Systemic interleukin-1 beta decreases brain-derived neurotrophic factor messenger RNA expression in the rat hippocampal formation. Neurosci. 1993;53:297–301. doi: 10.1016/0306-4522(93)90196-m. [DOI] [PubMed] [Google Scholar]
- Lowe B, Grafe K, Zipfel S, Witte S, Loerch B, Herzog W. Diagnosing ICD-10 depressive episodes: superior criterion validity of the Patient Health Questionnaire. Psychother Psychosom. 2004;73:386–390. doi: 10.1159/000080393. [DOI] [PubMed] [Google Scholar]
- Lowe B, Spitzer RL, Grafe K, Kroenke K, Quenter A, Zipfel S, Buchholz C, Witte S, Herzog W. Comparative validity of three screening questionnaires for DSM-IV depressive disorders and physicians’ diagnoses. J Affect Disord. 2004;78:131–140. doi: 10.1016/s0165-0327(02)00237-9. [DOI] [PubMed] [Google Scholar]
- MacKinnon DP, Lockwood CM, Hoffman JM, West SG, Sheets V. A comparison of methods to test mediation and other intervening variable effects. Psychol Methods. 2002;7:83–104. doi: 10.1037/1082-989x.7.1.83. [DOI] [PMC free article] [PubMed] [Google Scholar]
- Manly BFJ. Randomization, bootstrap, and monte carlo methods in biology. 2nd ed. London: Chapman & Hall; 1997. [Google Scholar]
- Manuck SB, Flory JD, Ferrell RE, Muldoon MF. Socio-economic status covaries with central nervous system serotonergic responsivity as a function of allelic variation in the serotonin transporter gene-linked polymorphic region. Psychoneuroendocrinology. 2004;29:651–668. doi: 10.1016/S0306-4530(03)00094-5. [DOI] [PubMed] [Google Scholar]
- Marsland AL, Gianaros PJ, Abramowitch SM, Manuck SB, Hariri AR. Interleukin-6 covaries inversely with hippocampal grey matter volume in middle-aged adults. Biol Psychiatry. 2008;64:484–490. doi: 10.1016/j.biopsych.2008.04.016. [DOI] [PMC free article] [PubMed] [Google Scholar]
- Martin A, Rief W, Klaiberg A, Braehler E. Validity of the Brief Patient Health Questionnaire Mood Scale (PHQ-9) in the general population. Gen Hosp Psychiatry. 2006;28:71–77. doi: 10.1016/j.genhosppsych.2005.07.003. [DOI] [PubMed] [Google Scholar]
- Matthews KA, Gallo LC. Psychological perspectives on pathways linking socioeconomic status and physical health. Ann Rev Psychol. 2011;62:501–530. doi: 10.1146/annurev.psych.031809.130711. [DOI] [PMC free article] [PubMed] [Google Scholar]
- Matthews KA, Gallo LC, Taylor SE. Are psychosocial factors mediators of socioeconomic status and health connections? A progress report and blueprint for the future. Ann N Y Acad Sci. 2010;1186:146–173. doi: 10.1111/j.1749-6632.2009.05332.x. [DOI] [PubMed] [Google Scholar]
- Matthews KA, Schwartz JE, Cohen S. Indicies of socioeconomic position across the life course as predictors of coronary calcification in black and white men and women: coronary artery risk development in young adults study. Soc Sci Med. 2011;73:768–774. doi: 10.1016/j.socscimed.2011.06.017. [DOI] [PMC free article] [PubMed] [Google Scholar]
- McAfoose J, Baune BT. Evidence for a cytokine model of cognitive function. Neurosci Biobehav Rev. 2009;33:355–366. doi: 10.1016/j.neubiorev.2008.10.005. [DOI] [PubMed] [Google Scholar]
- McEwen BS, Gianaros PJ. Central role of the brain in stress and adaptation: links to socioeconomic status, health, and disease. Ann N Y Acad Sci. 2010;1186:190–222. doi: 10.1111/j.1749-6632.2009.05331.x. [DOI] [PMC free article] [PubMed] [Google Scholar]
- McLaren L. Socioeconomic status and obesity. Epidemiol Rev. 2007;29:29–48. doi: 10.1093/epirev/mxm001. [DOI] [PubMed] [Google Scholar]
- Miller GE, Chen E, Cole SW. Health psychology: developing biologically plausible models linking the social world and physical health. Ann Rev Psychol. 2009;60:501–524. doi: 10.1146/annurev.psych.60.110707.163551. [DOI] [PubMed] [Google Scholar]
- Miller GE, Chen E, Parker KJ. Psychological stress in childhood and susceptibility to the chronic diseases of aging: moving toward a model of behavioral and biological mechanisms. Psychol Bull. 2011;137:959–997. doi: 10.1037/a0024768. [DOI] [PMC free article] [PubMed] [Google Scholar]
- Monje ML, Toda H, Palmer TD. Inflammatory blockade restores adult hippocampal neurogenesis. Science. 2003;302:1760–1765. doi: 10.1126/science.1088417. [DOI] [PubMed] [Google Scholar]
- Mori S, Wakana S, Nagae-Poetscher LM, van Zijl PCM. MRI atlas of human white matter. Amsterdam: Elsevier; 2005. [Google Scholar]
- Mori S, Zhang J. Principles of diffusion tensor imaging and its applications to basic neuroscience research. Neuron. 2006;51:527–539. doi: 10.1016/j.neuron.2006.08.012. [DOI] [PubMed] [Google Scholar]
- Noble KG, Korgaonkarc MS, Grieve SM, Brickmanb AM. Higher education is an age-independent predictor of white matter integrity and cognitive control in late adolescence. Dev Sci. Forthcoming doi: 10.1111/desc.12077. [DOI] [PMC free article] [PubMed] [Google Scholar]
- Pampel FC, Krueger PM, Denney JT. Socioeconomic disparities in health behaviors. Ann Rev Sociol. 2010;36:349–370. doi: 10.1146/annurev.soc.012809.102529. [DOI] [PMC free article] [PubMed] [Google Scholar]
- Petersen KL, Marsland AL, Flory J, Votruba-Drzal E, Muldoon MF, Manuck SB. Community socioeconomic status is associated with circulating interleukin-6 and C-reactive protein. Psychosom Med. 2008;70:646–652. doi: 10.1097/PSY.0b013e31817b8ee4. [DOI] [PubMed] [Google Scholar]
- Preacher KJ, Hayes AF. Asymptotic and resampling strategies for assessing and comparing indirect effects in multiple mediator models. Beh Res Methods. 2008;40:879–891. doi: 10.3758/brm.40.3.879. [DOI] [PubMed] [Google Scholar]
- Raizada RD, Kishiyama MM. Effects of socioeconomic status on brain development, and how cognitive neuroscience may contribute to levelling the playing field. Front Hum Neurosci. 2010;4:3. doi: 10.3389/neuro.09.003.2010. [DOI] [PMC free article] [PubMed] [Google Scholar]
- Richwine AF, Parkin AO, Buchanan JB, Chen J, Markham JA, Juraska JM, Johnson RW. Architectural changes to CA1 pyramidal neurons in adult and aged mice after peripheral immune stimulation. Psychoneuroendocrinology. 2008;33:1369–1377. doi: 10.1016/j.psyneuen.2008.08.003. [DOI] [PubMed] [Google Scholar]
- Ridker PM. C-reactive protein and the prediction of cardiovascular events among those at intermediate risk: moving an inflammatory hypothesis toward consensus. J Am Coll Cardiol. 2007;49:2129–2138. doi: 10.1016/j.jacc.2007.02.052. [DOI] [PubMed] [Google Scholar]
- Rosano C, Marsland AL, Gianaros PJ. Maintaining brain health by monitoring inflammatory processes: a mechanism to promote successful aging. Aging Dis. 2012;3:16–33. [PMC free article] [PubMed] [Google Scholar]
- Schwartz J. The utility of the cube root of income. J Off Stat. 1985;1:5–19. [Google Scholar]
- Sheridan MA, Sarsour K, Jutte D, D'Esposito M, Boyce WT. The impact of social disparity on prefrontal function in childhood. PLoS One. 2012;7:e35744. doi: 10.1371/journal.pone.0035744. [DOI] [PMC free article] [PubMed] [Google Scholar]
- Shonkoff JP, Boyce WT, McEwen BS. Neuroscience, molecular biology, and the childhood roots of health disparities: building a new framework for health promotion and disease prevention. J Am Med Assoc. 2009;301:2252–2259. doi: 10.1001/jama.2009.754. [DOI] [PubMed] [Google Scholar]
- Smith SM, Johansen-Berg H, Jenkinson M, Rueckert D, Nichols TE, Miller KL, Robson MD, Jones DK, Klein JC, Bartsch AJ, et al. Acquisition and voxelwise analysis of multi-subject diffusion data with tract-based spatial statistics. Nat Protoc. 2007;2:499–503. doi: 10.1038/nprot.2007.45. [DOI] [PubMed] [Google Scholar]
- Sobal J, Stunkard AJ. Socioeconomic status and obesity: a review of the literature. Psychol Bull. 1989;105:260–275. doi: 10.1037/0033-2909.105.2.260. [DOI] [PubMed] [Google Scholar]
- Spitzer RL, Kroenke K, Williams JB. Validation and utility of a self-report version of PRIME-MD: The PHQ primary care study. J Am Med Assoc. 1999;282:1737–1744. doi: 10.1001/jama.282.18.1737. [DOI] [PubMed] [Google Scholar]
- Staff RT, Murray AD, Ahearn TS, Mustafa N, Fox HC, Whalley LJ. Childhood socioeconomic status and adult brain size: Childhood socioeconomic status influences adult hippocampal size. Ann Neurol. 2012;71:653–660. doi: 10.1002/ana.22631. [DOI] [PubMed] [Google Scholar]
- Stanek KM, Grieve SM, Brickman AM, Korgaonkar MS, Paul RH, Cohen RA, Gunstad JJ. Obesity is associated with reduced white matter integrity in otherwise healthy adults. Obesity. 2011;19:500–504. doi: 10.1038/oby.2010.312. [DOI] [PubMed] [Google Scholar]
- Tancredi V, D'Antuono M, Cafe C, Giovedi S, Bue MC, D'Arcangelo G, Onofri F, Benfenati F. The inhibitory effects of interleukin-6 on synaptic plasticity in the rat hippocampus are associated with an inhibition of mitogen-activated protein kinase ERK. J Neurochem. 2000;75:634–643. doi: 10.1046/j.1471-4159.2000.0750634.x. [DOI] [PubMed] [Google Scholar]
- Thurfjell L, Bengtsson E, Nordin B. A new three-dimensional connected components labeling algorithm with simultaneous object feature extraction capability. CVGIP: Graph Mod Im Proc. 1992;54:357–364. [Google Scholar]
- Verstynen T, Weinstein AM, Schneider W, Jakicic J, Rofey D, Erickson KI. Increased body mass index is associated with a global and distributed decrease in white matter microstructural integrity. Psychosom Med. Forthcoming doi: 10.1097/PSY.0b013e318261909c. [DOI] [PMC free article] [PubMed] [Google Scholar]
- Voss MW, Prakash RS, Erickson KI, Basak C, Chaddock L, Kim JS, Alves H, Heo S, Szabo AN, White SM, et al. Plasticity of brain networks in a randomized intervention trial of exercise training in older adults. Front Aging Neurosci. 2010;2 doi: 10.3389/fnagi.2010.00032. doi:10.3389/fnagi.2010.00032. [DOI] [PMC free article] [PubMed] [Google Scholar]
- Wersching H, Duning T, Lohmann H, Mohammadi S, Stehling C, Fobker M, Conty M, Minnerup J, Ringelstein EB, Berger K, et al. Serum C-reactive protein is linked to cerebral microstructural integrity and cognitive function. Neurology. 2010;74:1022–1029. doi: 10.1212/WNL.0b013e3181d7b45b. [DOI] [PubMed] [Google Scholar]
- Yirmiya R, Goshen I. Immune modulation of learning, memory, neural plasticity and neurogenesis. Brain Behav Immun. 2011;25:181–213. doi: 10.1016/j.bbi.2010.10.015. [DOI] [PubMed] [Google Scholar]
Associated Data
This section collects any data citations, data availability statements, or supplementary materials included in this article.