

Abstract
Objectives
To investigate the accuracy and reliability of implant site measurements, recorded from low-dose cone beam computed tomography (CBCT) images.
Methods
CBCT reformatted images of five skulls were obtained using 40, 20 and 7 s exposure protocols. From these protocols, edentulous ridge dimensions were recorded by two observers and compared with measurements recorded directly from the bone. The measurement errors and intra- and inter-examiner reliability were calculated for each exposure protocol and compared with each other.
Results
The mean absolute errors from the 40, 20 and 7 s protocols were 0.50, 0.46, and 0.51 mm, respectively. The intra-examiner reliability scores were 0.996, 0.995 and 0.998, respectively. The inter-examiner reliability scores were 0.993, 0.998 and 0.994, respectively. There was no significant difference in accuracy or reliability between the three protocols.
Conclusions
In imaging of dry skulls, lowering the CBCT exposure time from 40 s to 20 or 7 s does not affect the reliability or accuracy of implant site measurements.
Keywords: CBCT, Radiation dosage, Reliability, Dental implantation, Dry skull
1. Introduction
The use of cone beam computed tomography (CBCT) is rapidly spreading and becoming the imaging modality of choice for implant site assessment. However, the increasing use of CBCT has raised concerns of excessive exposure to ionizing radiation to the collective population (UNSCEAR, 2008) that necessitates the introduction of dose-saving strategies. The radiation dose imparted by a CBCT examination is variable because it depends on the CBCT machine, the field of view (FOV), number of basis images, mode of exposure (continuous or pulsed), and exposure parameters of milliampere (mA), kilovoltage peak (KvP), and duration of exposure. By using a variety of CBCT machines and varying the exposure parameters of identical machines, considerable reductions in radiation dose have been found (Ludlow et al., 2006; Ludlow and Ivanovic, 2008; Roberts et al., 2009).
Although reduction of the radiation dose is advantageous from a biological point of view, it may possibly lead to undersampling artifacts or quantum noise that could theoretically adversely affect the diagnostic quality of the images (Bushberg et al., 2002; Jaffray and Siewerdsen, 2000; Mozzo et al., 1998; Siewerdsen and Jaffray, 2001; van Daatselaar et al., 2004). Suomalainen et al. (2009) investigated image quality vs radiation exposure of dental CBCT machines and found that, for protocols utilizing the same exposure parameters and producing images with the same voxel size, a reduction of exposure time and scan volume led to a slight reduction of contrast-to-noise ratio (CNR) but a small increase in the 10% modulation transfer function (Suomalainen et al., 2009).
The effect of increased noise and streaking due to reduced exposure times for CBCT examinations may not degrade the image severely, but the diagnostic implications of such image degradation depend on the diagnostic task at hand. Implant site imaging is mainly concerned with hard tissues, and for depiction of such high-contrast structures, low mA settings are not thought to negatively influence the diagnostic quality (Mozzo et al., 1998). Comparing and contrasting the results from the currently published literature, however, we were unable to determine the individual effect of reduction of the number of basis images on the accuracy of CBCT images for implant site assessment. This is because different devices, methodology, and protocols are used; the effects of the various examination parameters are intertwined. Furthermore, different reconstruction filters also affect the accuracy of the resultant images. Therefore, to investigate the effect of one parameter, all the others must be factored out.
To our knowledge at the time of writing, no published data exist on the effect of reducing the exposure time of a CBCT examination on objective image quality for implant site assessment. Thus, this study aims to measure the reliability and accuracy of measurements of edentulous ridges for implant site assessment performed on images obtained by low-dose CBCT protocols and to compare and contrast the results from the various examination protocols. The results of such a study should aid in determining the optimum scan protocols, with the appropriate balance between dose and image quality, thus reducing the risk of adverse effects on patients.
2. Methods
2.1. Preparation of skulls
Five human dried skulls were used in this study. Because the study was an in vitro experimental study using dried human skulls, it did not require the approval of institution’s ethics committee. However, since human skulls were used, they were obtained from the Anatomy Department of the King Saud University College of Medicine through official channels with the approval of both the chairman of the Department of Oral Medicine and Diagnostic Sciences (College of Dentistry) and the chairman of the anatomy department (College of Medicine).
All existing teeth within the skulls were removed, and the alveolar ridges were flattened to expose areas of bone that would facilitate physically sectioning the bone while maintaining the height and width of the ridge at the site of the sections. After grinding, the surface of one of the maxillae was found to be made up entirely of large, exposed marrow spaces, and it was therefore not used for measurement purposes. The corresponding mandible was used, though, and the entire skull was imaged to facilitate proper positioning of the mandible.
The edentulous areas to be measured were designated with radiopaque gutta-percha markers 1.4 mm in diameter. The markers delineating each sample site were placed at the crestal, buccal, and lingual sides of the jaws; a groove filled with softened gutta-percha was also placed along the inferior border of the acrylic resin surrounding the mandible. All were placed to delineate the position and plane of the transverse cross-sections as well as the proposed path of measurements, as outlined in Fig. 1.
Figure 1.

Diagram showing the direction of the height and width measurements on transverse cross-sections. (a) Mandibular section, anterior to the mental foramen. (b) Mandibular section, at and posterior to the mental foramen. (c) Maxillary section.
The markers were obtained by cutting the black color-coded ends of size 80 gutta-percha cones with scissors and embedding them in a layer of clear acrylic resin separated from the bone by three layers of sheet wax (each layer 1.5 mm thick). The wax and acrylic resin surrounding the maxillae covered the entire ridge, tuberosity, and palate, and extended buccally superior to the floor of the nasal fossa and maxillary sinus. For the mandibles, the entire body of the mandible was surrounded by wax and acrylic resin. Distribution of the demarcated sample sites is listed in Table 1.
Table 1.
Distribution of sample sites.
| Skull | Maxillary sites |
Mandibular sites |
|||||
|---|---|---|---|---|---|---|---|
| Incisor | Canine–premolar | Molar | Incisor | Canine–premolar | Molar | Total | |
| 1 | 2 | 3 | 3 | 2 | 0 | 0 | 10 |
| 2 | 2 | 0 | 1 | 2 | 4 | 2 | 11 |
| 3 | 0 | 0 | 0 | 2 | 4 | 2 | 8 |
| 4 | 2 | 1 | 1 | 2 | 4 | 2 | 12 |
| 5 | 2 | 3 | 2 | 2 | 4 | 1 | 14 |
| Total | 8 | 7 | 7 | 10 | 16 | 7 | 55 |
2.2. Imaging the jaws
The skulls were imaged in a CBCT device (Iluma, Imtek Imaging, 3M Co., St. Paul, MN, USA) with a large FOV and a flat-panel detector. The size of the detector was 19 × 24 cm, and it was composed of 127-μm amorphous silicon. The X-ray focal spot was 0.3 mm in diameter.
The skulls were placed upright on a wooden stand that was free of any metallic parts. Three examinations were performed for each skull utilizing 3.8 mA and a kV of 120. Exposure times for the three examinations were 40, 20, and 7 s, with the number of basis images acquired being 602, 302, and 117, respectively. The reconstruction voxel size for all three protocols was 0.29 mm. The reconstructed axial projection images were processed with reformatting software (IlumaVision 3-D (Version 1.0.2.5), Imtek Imaging) to obtain transverse cross-sectional images of the jaws at the sites of the gutta-percha markers. The transverse cross-sections were reformatted individually, and each included the crestal, buccal, and lingual gutta-percha markers. Fig. 2 shows samples of the reformatted transverse cross-sectional images obtained using 40-, 20-, and 7-s CBCT exposures, respectively.
Figure 2.
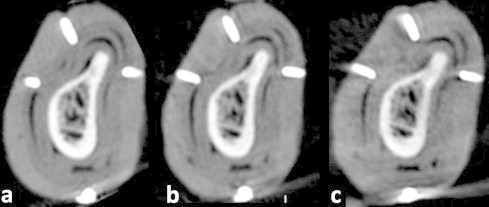
Sample of reformatted CBCT transverse cross-sectional images (at a window level of 278 and a window width of 2484) obtained using an exposure time of (a) 40 s, (b) 20 s, and (c) 7 s.
The thickness of the cross-sectional images was 0.29 mm, as used in author’s clinical practice.
2.3. Recording of measurements
The linear measurement tool of the image processing software program (IlumaVision 3-D, Imtek Imaging) was used to record the measurements from the reformatted CBCT images. The measurements were recorded directly from the computer monitors. The images from all protocols were viewed on identical LCD monitors (Dell Ultrasharp 2408WFP, 24-inch widescreen flat-panel monitors). The resolution of the monitors was set at the optimal resolution (1920 × 1200), the pixel size being 0.27 mm. The color quality was set at medium (16-bit – the highest depth supported by the hardware of the CBCT device). Measurements were recorded by two observers, both maxillofacial radiologists having 3 years of experience with the CBCT device tested. The measurements were recorded twice by the first observer (in the morning and in dim lighting, with several weeks in between) and once by the second observer.
After imaging, the jaws were sectioned using a band saw to obtain transverse cross-sections at the sites of the gutta-percha markers. To ensure that the plane of the bone sections corresponded to the plane of the images, the former included the innermost portion of the gutta-percha markers (crestal, buccal, and lingual). Bone sections that did not include the innermost portion of the three gutta-percha markers were excluded from the study. Also excluded were any sections whose borders were inadvertently cut by the saw, sections whose gutta-percha markers were loosened before determination of the paths of measurement, and the section at which the thin floor of the maxillary sinus was perforated by aggressive cleaning.
The paths of measurement were marked on the bone with a pencil, and the bone measurements were recorded using a digital caliper (Mitutoyo Absolute Digimatic Caliper, Mitutoyo Corp, Kawasaki, Japan) with a 0.01-mm resolution and ± 0.02 mm accuracy. The caliper was submitted to King Abdulaziz City for Science and Technology for testing and found to conform to manufacturer’s standards of accuracy of ± 0.02 mm.
The wax adjacent to the measurement points was carefully removed and the tips of the caliper blades were placed on the outer surface of the bone, contacting the edge of the cut surface. All measurements were recorded by a single observer and repeated 1 week later.
2.4. Statistics
The recorded measurements were analyzed with SPSS 16.0.0 (Statistical Package for the Social Sciences) (International Business Machines Corp. (IBM), Armonk, New York, United States). Descriptive statistics were calculated for the differences between the measurements obtained from the images and those obtained by directly measuring the bone (the gold standard). The mean values of the two measurements recorded by the first examiner directly from the bone and from the CBCT images were used to calculate the error values from the images. The error was calculated as the mean test measurement from the CBCT image (first examiner) minus the mean direct bone measurement. Thus, a negative error value indicated that the measurement recorded from the image was smaller than the gold standard and vice versa.
The means of the absolute errors from the three protocols were then calculated for the overall sample sites. Also, the absolute errors of the height measurements at sites containing the inferior dental canal (IDC) were calculated separately. The 1-sample t test (test value: zero) was used to test the statistical significance of the mean of the absolute errors of the overall measurements obtained with each of the three exposure protocols. The Wilcoxon signed rank test was used to test the statistical significance of the mean of the absolute errors of the subset of height measurements at sites (including the IDC) obtained with each of the three exposure protocols. The ANOVA with repeated measures was used to test the statistical significance of the difference between the means of the absolute errors obtained by the different exposure protocols for the entire data set. The Friedman nonparametric test was used to test for the statistical significance of the difference between the means of the absolute errors of the height measurements at the IDC. Statistical significance was set at a P value of 0.05.
Intra- and inter-examiner reliability scores were evaluated with correlation testing. The measurements recorded by the first examiner were used to calculate the intra-examiner reliability for the direct bone measurements (gold standard) as well as the CBCT measurements. The second examiner’s measurements were compared with the corresponding mean values of the first examiner’s CBCT measurements for calculation of the inter-examiner reliability of the CBCT measurements.
3. Results
The results of this study were obtained by using four maxillae and five mandibles. Height and width measurements were recorded from the CBCT images at 55 sites (110 measurements). After exclusion of the necessary bone sections, the total number of direct bone measurements available for the study was 83.
3.1. Reliability
The intra- and inter-examiner reliability scores for the gold standard and test measurements are listed in Table 2. The intra- and inter-examiner reliability scores for all three examination protocols were all very high, ranging between 0.993 and 0.999, which was equal to, or slightly lower than, that for the gold standard intra-examiner reliability. Even so, it may be seen in Table 2 that the highest intra-examiner reliability was found with the 7-s exposure, whereas the highest inter-examiner reliability was found with the 20-s exposure. A measurement difference of more than 0.5 mm was found between examiners at a considerable number of sites for the 40-s and 7-s exposure protocols (48% and 21% of sample sites, respectively).
Table 2.
Intra- and inter-examiner reliability scores for the gold standard and test measurements.
| Reliability | Cronbach’s Alpha | Inter-item correlation matrix | No. (%) of sites with measurement difference > 0.5 mm |
|---|---|---|---|
| Direct bone measurements (intra-examiner) | 0.999 | 0.999 | |
| 40-s exposure (intra-examiner) | 0.998 | 0.996 | 5 (6) |
| 40-s exposure (inter-examiner) | 0.996 | 0.993 | 24 (48) |
| 20-s exposure (intra-examiner) | 0.998 | 0.995 | 7 (8) |
| 20-s exposure (inter-examiner) | 0.999 | 0.998 | 9 (18) |
| 7-s exposure (intra-examiner) | 0.999 | 0.998 | 7 (8) |
| 7-s exposure (inter-examiner) | 0.997 | 0.994 | 17 (21) |
3.2. Measurement error
Figs. 3–5 are frequency histograms of the error values from all three protocols. The histograms indicate that the errors were both positive and negative and were normally distributed.
Figure 3.

Frequency histogram of the measurement error values obtained using a 40 s exposure.
Figure 4.

Frequency histogram of the measurement error values obtained using a 20 s exposure.
Figure 5.
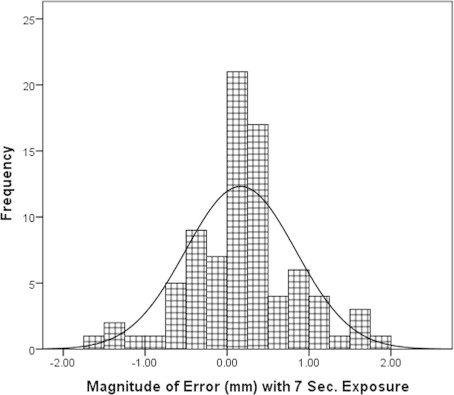
Frequency histogram of the measurement error values obtained using a 7 s exposure.
For the overall sample (n = 83), the means of the absolute measurement errors recorded from the 40-, 20- and 7-s protocols were found to be 0.50 mm (SD, 0.47 mm), 0.46 mm (SD, 0.39 mm), and 0.51 mm (SD, 0.46 mm), respectively. For the height measurements at the IDC (n = 12), the means of the absolute errors were 0.43 mm (SD, 0.49 mm), 0.53 mm (SD, 0.49 mm), and 0.52 mm (SD, 0.52 mm), respectively. Fig. 6 is a bar chart of the means of the absolute measurement errors from the three examination protocols for the overall samples, as well as for the height measurements at the IDC. Although the means of the absolute errors were submillimetric for all the examination protocols, they were statistically significant for the entire sample size as well as for the height measurements at the IDC. Table 3 lists the number and percentage of absolute measurement errors that were larger than or equal to 0.5, 1.0, and 2.0 mm.
Figure 6.

Bar chart of the means of the absolute measurement errors (±1 standard error) obtained with the three examination protocols for the entire sample and for the height measurements at the IDC.
Table 3.
Frequency of absolute errors >0.5, 1, and 2 mm.
| No. of sites with absolute error |
|||
|---|---|---|---|
| >0.5 mm (%) | >1 mm (%) | >2 mm (%) | |
| 40-s exposure | 30 (36.1) | 12 (14.5) | 1 (1.2) |
| 20-s exposure | 34 (41) | 10 (12.1) | 0 (0) |
| 7-s exposure | 30 (36.1) | 14 (16.9) | 0 (0) |
The ANOVA with repeated measures revealed no significant difference (P = 0.539) (d.f. = 2, 164) between the means of the absolute errors obtained with the three examination protocols for the entire sample. The Friedman test also revealed no significant difference (P = 0.856) between the means of the absolute errors for the subset of height measurements at the IDC.
4. Discussion
The present study has attempted to objectively quantify the quality of CBCT images obtained using different exposure times for the purpose of recording implant site dimensions. The image quality was assessed by psychophysical measurements, which are physical measurement entities (length) made in response to psychological sensations (the visual stimulus of recognizing the bony margins of the implant site) (Martens, 2003).
Although the effect of reducing the exposure time, and thus the number of basis images, on CBCT images was found to increase streaking artifacts in the axial images, the reliability and dimensional accuracy of measurements performed on reformatted transverse cross-sectional images were not found to be adversely affected by the reduction in exposure time to nearly 1/6, from 40 to 7 s. The high intra- and inter-examiner reliability scores obtained for all 3 examination protocols indicate they all produce consistent results. However, the finding of a high percentage of measurements for which the difference between examiners was greater than 0.5 mm is in agreement with the findings of Al-Ekrish and Ekram (2011), who found such a difference in 75% of measurements made using a 40-s protocol. An inter-examiner difference in measurement greater than 0.5 mm is clinically significant because most examiners round off recorded measurements to the nearest 1.0 or 0.5 mm. Thus, as an error approaches 0.5 mm or more, it is more likely to significantly change the reported measurement. The clinical implication of such a finding is that recording measurements and placing implants should be performed by the same operator. Therefore, implant site measurements are best recorded by the implantologist, after appropriate training, and not the radiologist.
With regard to the measurement errors recorded from the three examination protocols, the errors were found to be normally distributed, indicating that the images were not associated with consistent magnification. And although both examiners felt more confident identifying the bony margins with the 40- and 20-s exposure protocols as compared with the 7-s protocol, there was no significant difference between the accuracy of measurements recorded from three protocols. Furthermore, the lack of a statistically significant difference between the height measurements at the IDC recorded from the three protocols also indicates that identification of the roof of the IDC is not adversely affected by use of the 7-s protocol. However, it must be taken into consideration that the possibility exists for a 1-mm overestimation of ridge dimensions with all three exposure protocols, and more so with the 7-s protocol. Therefore, correction for this possible overestimation should be performed during recording of the linear measurements for implant site assessment.
One of the main limitations of the present study, however, is the absence of the soft tissues of the skulls and vertebral column. Although the wax and acrylic surrounding the jaws are expected to have attenuated and scattered the primary radiation, we cannot ensure that any soft-tissue equivalent material will do so in the same pattern as the inhomogenous and variable tissues of the skull, especially the cervical vertebrae and tongue. Scatter radiation caused by such structures is expected to further decrease the CNR, reducing the contrast at the bone–soft tissue interface. It is possible that the CNR of the low-dose protocols can be reduced to reach a threshold below which the contrast resolution of the images is inadequate to accurately detect the bone–soft tissue interface. That possibility, however, is not very large, because of the high contrast between bone and soft tissues and the large amount of scatter necessary to cause such an effect (Arai et al., 1999; Kalender, 2003; Mozzo et al., 1998).
Another limitation of our study, which is inherent with all CBCT studies, is that our results may not necessarily be applicable to other CBCT devices, exposure protocols, or diagnostic tasks. For the CNR varies between the different machines, and it may be affected by factors other than exposure time, for example, voxel size and slice thickness (Suomalainen et al., 2009). If the voxel size is decreased while the number of basis images (or number of X-ray photons) remains fixed, a marked increase in noise results (Araki et al., 2004; Bushberg et al., 2002; Fuchs and Kalender, 2003; Jaffray and Siewerdsen, 2000; Mozzo et al., 1998; Seeram, 2001; Siewerdsen and Jaffray, 2001). The effect of noise on CBCT images is also more evident as the thickness of the reformatted image slices is made thinner (Katsumata et al., 2007). As such, CBCT dose reductions may affect diagnostic tasks in different ways. Although CBCT is used mainly for imaging bone, tasks requiring greater detail (i.e., smaller voxel sizes) such as endodontic diagnosis are expected to be more adversely affected by dose reductions than those needing less details. Therefore, the results of this study apply only to measuring the dimensions of intact edentulous ridges, but not to other tasks such as endodontic or periodontic evaluations or measurement of grafted ridges or surgical sites.
Also, the large field of view used in this study may not be utilized by many for implant site assessment because dose reduction entails using the smallest FOV practicable for the diagnostic task at hand (Ludlow and Ivanovic, 2008; Benavides et al., 2012). However, in some institutions, a large FOV CBCT device is the only alternative to a multidetector CT (MDCT) for 3-D imaging of proposed implant sites. So, although it is regarded as imparting unnecessary exposure, it is nonetheless lower than that imparted by MDCT. Furthermore, when all quadrants of the arches need to be assessed, the overall exposure from a single large FOV exposure may be less than multiple small FOV exposures (Ludlow and Ivanovic, 2008). Therefore, even as steps are taken to reduce patient exposure by introducing appropriate collimation and dose reduction protocols, knowledge of the accuracy of linear measurements obtained using a large FOV with short exposure times is necessary because there are situations in which such a FOV will be necessary.
5. Conclusions
Within the limitations of the present study, we conclude that lowering the CBCT exposure time from 40 to 20 s does not adversely affect the reliability or accuracy of implant site measurements. However, further studies using human cadavers are needed to further investigate the effect on accuracy of the 7-s protocol. Furthermore, the possibility of a 1-mm overestimation of measurements should be considered with all three examination protocols, and correction should be performed accordingly. Further controlled and standardized studies are needed to investigate the effect of low-dose CBCT protocols on other diagnostic tasks and in relation to other exposure parameters.
Conflict of Interest
This study was partially supported by a grant from the Deanship of Scientific Research at King Saud University. The author has no financial interest associated with the aforementioned research center and declares no conflict of interest. The granting body was not involved in any aspect of the research or preparation of the article.
Acknowledgments
Prof. M. Ekram is kindly acknowledged for reviewing the manuscript. The efforts of Dr. Ebtihal Zain Alabedin and Mr. Mohammad Saeed during the conduction of this research are also highly appreciated.
Footnotes
Peer review under responsibility of King Saud University.

References
- Al-Ekrish A., Ekram M. A comparative study of the accuracy and reliability of multidetector computed tomography and cone beam computed tomography in the assessment of dental implant site dimensions. Dentomaxillofac. Radiol. 2011;40:67–75. doi: 10.1259/dmfr/27546065. [DOI] [PMC free article] [PubMed] [Google Scholar]
- Arai Y., Tammisalo E., Iwai K., Hashimoto K., Shinoda K. Development of a compact computed tomographic apparatus for dental use. Dentomaxillofac. Radiol. 1999;28:245–248. doi: 10.1038/sj/dmfr/4600448. [DOI] [PubMed] [Google Scholar]
- Araki K., Maki K., Seki K. Characteristics of a newly developed dentomaxillofacial X-ray cone beam CT scanner (CB MercuRay): system configuration and physical properties. Dentomaxillofac. Radiol. 2004;33:51–59. doi: 10.1259/dmfr/54013049. [DOI] [PubMed] [Google Scholar]
- Benavides E., Rios H.F., Ganz S.D., An C.H., Resnik R., Reardon G.T., Feldman S.J., Mah J.K., Hatcher D., Kim M.J., Sohn D.S., Palti A., Perel M.L., Judy K.W., Misch C.E., Wang H.L. Use of cone beam computed tomography in implant dentistry: the international congress of oral implantologists consensus report. Implant Dent. 2012;21:1–9. doi: 10.1097/ID.0b013e31824885b5. [DOI] [PubMed] [Google Scholar]
- Bushberg J.T., Seibert J.A., Leidholdt E.M., Jr., Boone J.M. second ed. Lippincott Williams & Wilkins; Philadelphia: 2002. The Essential Physics of Medical Imaging. [Google Scholar]
- Fuchs T., Kalender W.A. On the correlation of pixel noise, spatial resolution and dose in computed tomography: theoretical prediction and verification by simulation and measurement. Physica Med. 2003;19:153–164. [Google Scholar]
- Jaffray D.A., Siewerdsen J.H. Cone-beam computed tomography with a flat-panel imager: initial performance characterization. Med. Phys. 2000;27:1311–1323. doi: 10.1118/1.599009. [DOI] [PubMed] [Google Scholar]
- Kalender W.A. The use of flat-panel detectors for CT imaging. Radiology. 2003;43:379–387. doi: 10.1007/s00117-003-0897-4. [DOI] [PubMed] [Google Scholar]
- Katsumata A., Hirukawa A., Okumura S. Effects of image artifacts on gray-value density in limited-volume cone-beam computerized tomography. Oral Surg. Oral Med. Oral Pathol. Oral Radiol. Endod. 2007;104:829–836. doi: 10.1016/j.tripleo.2006.12.005. [DOI] [PubMed] [Google Scholar]
- Ludlow J.B., Ivanovic M. Comparative dosimetry of dental CBCT devices and 64-slice CT for oral and maxillofacial radiology. Oral Surg. Oral Med. Oral Pathol. Oral Radiol. Endod. 2008;106:106–114. doi: 10.1016/j.tripleo.2008.03.018. [DOI] [PubMed] [Google Scholar]
- Ludlow J.B., Davies-Ludlow L.E., Brooks S.L., Howerton W.B. Dosimetry of 3 CBCT devices for oral and maxillofacial radiology: CB Mercuray, NewTom 3G and i-CAT. Dentomaxillofac. Radiol. 2006;35:219–226. doi: 10.1259/dmfr/14340323. [DOI] [PubMed] [Google Scholar]
- Martens J. second ed. Kluwer Academic Publishers; Boston: 2003. Image Technology Design: A Perceptual Approach. [Google Scholar]
- Mozzo P., Procacci C., Tacconi A., Martini P.T., Andreis I.A. A new volumetric CT machine for dental imaging based on the cone-beam technique: preliminary results. Eur. Radiol. 1998;8:1558–1564. doi: 10.1007/s003300050586. [DOI] [PubMed] [Google Scholar]
- Roberts J.A., Drage N.A., Davies J., Thomas D.W. Effective dose from cone beam CT examinations in dentistry. Br. J. Radiol. 2009;82:35–40. doi: 10.1259/bjr/31419627. [DOI] [PubMed] [Google Scholar]
- Seeram E. second ed. W.B. Saunders; Philadelphia: 2001. Computed Tomography. Physical Principles, Clinical Applications, and Quality Control. [Google Scholar]
- Siewerdsen J.H., Jaffray D.A. Cone-beam computed tomography with a flat-panel imager: magnitude and effects of X-ray scatter. Med. Phys. 2001;28:220–231. doi: 10.1118/1.1339879. [DOI] [PubMed] [Google Scholar]
- Suomalainen A., Kiljunen T., Kaser Y., Peltola J., Kortesniemi M. Dosimetry and image quality of four dental cone beam computed tomography scanners compared with multislice computed tomography scanners. Dentomaxillofac. Radiol. 2009;38:367–378. doi: 10.1259/dmfr/15779208. [DOI] [PubMed] [Google Scholar]
- United Nations Scientific Committee on the Effects of Atomic Radiation, 2008. Sources and effects of ionizing radiation. Paper presented at Official Records of the General Assembly, Sixty-third Session, Supplement No. 46, 2010, New York.
- van Daatselaar A.N., van der Stelt P.F., Weenen J. Effect of number of projections on image quality of local CT. Dentomaxillofac. Radiol. 2004;33:361–369. doi: 10.1259/dmfr/23496562. [DOI] [PubMed] [Google Scholar]