

Abstract
Purpose
To report the pattern of glaucoma among Saudi patients who were presented to King Abdul Aziz University Hospital (KAUH).
Methods
All glaucoma or glaucoma suspect patients who were presented to KAUH from 2006 to 2008 were included; medical files of all patients were retrieved and evaluated through standardized international guidelines. Collected data included: age, sex, laterality, intraocular pressure, and cup/disk ratio. Prevalence of different glaucoma types (including 95% CI) was calculated, ANOVA and post hoc tests were applied to evaluate the difference in indices across different types.
Results
A total of 2296 eyes of 1236 patients were included. Primary angle closure glaucoma (PACG) was the predominant type (46.6%) followed by primary angle closure (PAC) (17.2%), then primary open angle glaucoma (POAG) (12.8%), and secondary glaucoma (13%). Other types including (normal tension glaucoma (5.9%), childhood glaucoma (2.6%), and juvenile glaucoma (1.9%)) were also present but of lower prevalence.
Conclusion
Primary angle closure glaucoma was the predominant form of glaucoma followed by PAC, and POAG suggesting that the pattern in Saudi Arabia could be quite different from that reported for primary glaucomas in the Western literature. In addition, pseudoexfoliation was the most common form of secondary open and closed angle glaucoma. These results indicate the need for a national intervention program for early detection and referral of glaucoma cases in order to prevent significant visual loss. There is also a need for a community based assessment to determine the prevalence of glaucoma as a baseline for future intervention.
Keywords: Glaucoma pattern, Saudi population, Glaucoma types, Epidemiology of glaucoma
1. Introduction
Glaucoma is the second leading cause of blindness worldwide as it accounts for around 12.3% of total blinding causes (Resnikoff et al., 2004). These estimates are valid for the Eastern Mediterranean Region (EMR) as well as for the majority of WHO-classified regions. In our region (EMR), glaucoma contributes 11% of total blinding causes ranking as the second regional cause of blindness after cataract (49%). In Saudi Arabia, the prevalence of low vision and blindness were estimated earlier as 7.8% and 1.5%, respectively (Tabbara and Ross-Degnan, 1986). Global and regional estimates support these figures, with the prevalence of blindness in Oman estimated at 1.1% (Khandekar et al., 2002) and Qatar at 1.28% (Al Gamra et al., 2010). The global burden of glaucoma is predicted to increase in the coming decades, where the prevalence of glaucoma among the population 40+ of age is calculated to increase from 2.65% in the year 2010 to 2.86% by the year 2020 (Quigley and Broman, 2006). Additionally, the burden of congenital and childhood glaucoma is also quite high worldwide and specifically in the Middle East and developing countries where the prevalence of blindness among children is around 0.051% contributing 3.9% of the total blindness (Magnitude and Causes of Visual Impairment, 2004). It is expected for this burden to be even higher in Saudi Arabia because of a high rate of consanguinity and its contribution to congenital eye anomalies which are already quite high (5.1%) (Resnikoff et al., 2004; Tabbara and Ross-Degnan, 1986). Unless serious intervention is considered, these figures will drastically increase by the year 2020. It is evident that there is a critical need to tackle important blinding diseases not only for humanitarian reasons but also considering the high impact of these conditions on the economy, rate of development and other quality of life issues. Therefore, the estimated average of disability adjusted life years (DALYs) due to glaucoma is 4.72 million DALYS which is quite high (Ono et al., 2010). Understanding the pattern and the associated characteristics of glaucoma is an essential and crucial step to develop strategic plans and corresponding intervention programs. For example, a relatively recent study found that around 4% of total blindness in Saudi Arabia was due to either therapeutic and/or surgical mismanagement, factors related to time and methods of diagnosis (Tabbara, 2001). There is a need to establish an accurate baseline, clarifying the current needs, helping health policy makers to arrange their priorities for effective intervention in terms of training and other important health policy measures at the national health level. The purpose of the current study was to estimate the pattern of different glaucoma types and associated patient characteristics among patients presenting to King Abdul Aziz University Hospital (one of two major sophisticated tertiary referral centers for eye care in the Kingdom of Saudi Arabia).
2. Methods
All patients who presented and/or were referred to the glaucoma unit at King Abdul Aziz University Hospital (KAUH) from January 2006 to June 2008 were evaluated by a Glaucoma team.
Glaucoma is defined according to the International Society for Geographical and Epidemiological Ophthalmology Classification (Foster and Johnson, 2001) as follows:
-
•
Category 1 diagnosis (structural and functional evidence). Eyes with a CDR of or CDR asymmetry ⩾97.5th percentile for the normal population, or a neuroretinal rim width reduced to ⩽0.1 CDR (between 11 and 1 o’clock or 5 and 7 o’clock) that also showed a definite visual field defect consistent with glaucoma.
-
•
Category 2 diagnosis (advanced structural damage with unproved field loss). If the subject could not satisfactorily complete visual field testing but had a CDR or CDR asymmetry ⩾99.5th percentile for the normal population, glaucoma was diagnosed solely on the structural evidence. In diagnosing category 1 or 2 glaucoma, it was required that there is no other explanation for CDR findings (dysplastic disk or marked anisometropia) or the visual field defect (retinal vascular disease, macular degeneration, or cerebrovascular disease).
-
•
Category 3 diagnosis (optic disk not seen. Field test impossible). If it is not possible to examine the optic disk, glaucoma is diagnosed if: (A) the visual acuity <3/60 and the IOP >99.5th percentile, or (B) the visual acuity <3/60 and the eye shows evidence of glaucoma filtering surgery, or medical records were available confirming glaucomatous visual morbidity.
2.1. Types of glaucoma
-
(1)
Primary open angle glaucoma (POAG) is defined as; optic nerve damage meeting any of the three categories of evidence above, in an eye which does not have evidence of angle closure on gonioscopy, and where there is no identifiable secondary cause.
-
(2)Primary angle closure glaucoma (PACG) is defined as follows;
-
•Primary angle closure suspect: an eye in which appositional contact between the peripheral iris and posterior trabecular meshwork is considered possible.
-
•Primary angle closure (PAC): an eye with an occludable drainage angle and features indicating that trabecular obstruction by the peripheral iris has occurred, such as peripheral anterior synechiae, elevated intraocular pressure, iris whorling (distortion of the radially orientated iris fibers), “glaucomfleken” lens opacities, or excessive pigment deposition on the trabecular surface. The optic disk does not have glaucomatous damage.
-
•Primary angle closure glaucoma (PACG): PAC together with evidence of glaucoma, as defined above.
-
•
-
(3)
Secondary glaucoma is based on the presence of optic neuropathy, in so far as it is possible to determine this, in the presence of a second ocular pathological process. These processes may include one of the following: neovascularisation, uveitic, trauma, and lens related. In addition peudoexfoliation glaucoma and pigmentary glaucoma were considered among secondary glaucomas in this study.
-
(4)
Childhood glaucoma (CG) [congenital and developmental] was diagnosed in patients below the age of 3 years with raised IOP due to trabeculodysgenesis with or without developmental anomalies of the eye present at birth or early childhood period. The diagnosis was made in the presence of elevated IOP [measured under sedation in new-born and young children and confirmed by examination under general aesthesia] in association with at least one of the following findings: corneal haze with or without Haab’s striae, enlarged corneal diameter [more than 12 mm], and increased cup-disk ratio of more than 0.4 or presence of significant cupping asymmetry between both eyes.
-
(5)
Juvenile (JG) glaucoma was diagnosed in patients between the age of 3 and 30 years having the criteria of POAG.
Exclusion criteria: open angle glaucoma suspects or those not fulfilling the criteria for a definite diagnosis.
Clinical examination included the following procedure; assessment of the best corrected visual acuity of both eyes, visual field evaluation, a threshold examination of the central 24° of Humphrey visual field (24-2 program) showing a glaucoma hemi-field test (GHT) “outside normal limits” and a cluster of four contiguous points on the pattern deviation plot (p < 5% of occurring in age-matched normal subjects) not crossing the horizontal meridian is considered compatible with glaucoma, for both eyes of all subjects in whom VA better than 0.2, anterior chamber examination with slit lamp, was specifically directed at detection of signs of pigment dispersion syndrome, pseudoexfoliation, and other secondary causes of glaucoma. Intraocular pressure (IOP) was measured by Goldmann applanation tonometry and tonopen for young and uncooperative patients. Gonioscopy [using 4-mirror Zeiss goniolenses and direct gonioscopy lenses for children under GA] (using in adults a small, thin and low illuminated slit in a dimly illuminated room). Anterior segment OCT and/or UBM were used to help in the diagnosis if needed. Cases of primary angle closure suspects and primary angle closure were lumped under one category, “PAC”.
A data collection sheet was developed to collect and store patient’s information including the necessary demographic and clinical indices. Collected data included: age, sex, laterality, both major and differential diagnosis, intra ocular pressure (IOP), cup/disk ratio, and visual acuity at presentation as expressed by the LogMAR transformation of Snellen chart reading. All cases were reviewed in terms of the method of assessment of glaucoma indices to classify them with the standardized definitions described above. Only cases with a clear and confirmed diagnosis were included in the current study. All cases were examined by glaucoma team members and verified by a senior glaucoma consultant (S.O.), and then entered into a specifically designed database using Microsoft Access 2007®. Statistical analysis was done using the Statistical Package for Social Science (SPSS) by IBM, version 19. Analysis of data was mainly descriptive due to the nature and goals of the current study. Ethical approval was obtained from the Institutional Research and Ethics Board of the College of Medicine, King Saud University.
3. Results
A total of 2296 eyes of 1236 patients fulfilled the inclusion criteria. Out of those, 507 (41%) were males and 729 (59%) were females (p < 0.0001), with 816 (66%) suffering bilateral and 420 (34%) unilateral disease (p < 0.0001). The mean (SD) age of our sample was 53.9 (22.9) ranging from 1 day to 108 years old.
The most common glaucoma types were primary angle closure glaucoma (PACG; 46.6%) followed by secondary glaucoma (SG; 13%) and primary open angle glaucoma (POAG; 12.8%). Normal tension glaucoma (NTG) accounted for 5.9%, followed by both childhood and juvenile glaucoma, 2.6% and 1.9%, respectively. Looking at glaucoma prevalence from a per-eye perspective yielded similar proportion of disease as per patient, except for primary open angle glaucoma which slightly exceeded the secondary glaucoma in the per eye analysis (13.4% versus 9.8%) reverting the per-person proportion (Table 1). Moreover, patients diagnosed with primary angle closure (PAC), and at risk for closed angle glaucoma were also among the most common diagnoses (17.2%). This percentage significantly exceeded the prevalence of both POAG and secondary glaucoma (Fig. 1).
Table 1.
Distribution of glaucoma by the prevalence of different types.
| Diagnosis | Eyes no. (%)⁎ | Patients no. (%)⁎ | 95% CI | Male no. (%)⁎⁎ | Female no. (%)⁎⁎ |
|---|---|---|---|---|---|
| Primary angle closure glaucoma (PACG) | 1140 (49.7) | 576 (46.6) | (43.8–49.4) | 223 (38.7) | 353 (61.3) |
| Primary angle closure (PAC) | 410 (17.9) | 212 (17.2) | (15.1–19.3) | 55 (25.9) | 157 (74.1) |
| Secondary glaucoma (SG) | 224 (9.8) | 161 (13) | (11.2–14.9) | 92 (57.1) | 69 (42.9) |
| Primary open angle glaucoma (POAG) | 308 (13.4) | 158 (12.8) | (10.9–14.6) | 80 (50.6) | 78 (49.4) |
| Normal tension glaucoma (NTG) | 138 (6) | 73 (5.9) | (4.6–7.2) | 29 (39.7) | 44 (60.3) |
| Childhood glaucoma (CG) | 47 (2) | 32 (2.6) | (1.7–3.5) | 17 (53.1) | 15 (46.9) |
| Juvenile glaucoma (JG) | 29 (1.3) | 24 (1.9) | (1.2–2.7) | 11 (45.8) | 13 (54.2) |
| Total | 2296 | 1236 | 507 | 729 | |
Percentage is out of total column.
Percentage is out of total row.
Figure 1.
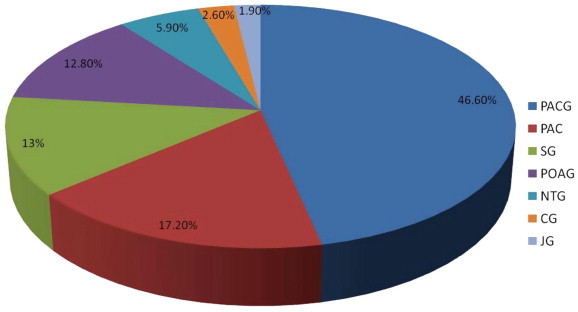
Distribution of different glaucoma types by prevalence.
Further analysis of secondary glaucoma cases into subcategories revealed that the majority of patients with secondary glaucoma were due to pseudoexfoliation (PXF; 54%) with a significant proportion of these being of the closed angle PXF type (39.1%) more than doubling those with open angle PXF (14.9%). Other types of secondary glaucoma included; neovascular glaucoma (NVG; 12.4%), both closed and open angle Uveitic glaucoma (12.4%), angle recession glaucoma (6.8%), and steroid induced glaucoma (5%). Other types of glaucomas seen less frequently were phacomorphic glaucoma (3.1%), pigmentary glaucoma (1.9%), lens protein glaucoma (1.9%), ghost cell glaucoma (1.2%), and glaucoma as a complication of retina surgery (1.2%). Further data including per-eye analysis are shown in Table 2.
Table 2.
Distribution of cases with secondary glaucoma by subgroups.
| Diagnosis | Eyes no. (%)⁎ | Patients no. (%)⁎ | 95% CI | Unilateral no. (%)⁎⁎ | Bilateral no. (%)⁎⁎ |
|---|---|---|---|---|---|
| Pseudoexfoliation (PXF) closed angle glaucoma | 86 (38.4) | 63 (39.1) | (31.6–46.7) | 40 (63.5) | 23 (36.5) |
| Pseudoexfoliation (PXF) open angle glaucoma | 39 (17.4) | 24 (14.9) | (9.4–20.4) | 9 (37.5) | 15 (62.5) |
| Neovascular glaucoma (NVG) | 22 (9.8) | 20 (12.4) | (7.3–17.5) | 18 (90) | 2 (10) |
| Uveitic glaucoma (UG) closed angle | 15 (6.7) | 10 (6.2) | (2.5–9.9) | 5 (50) | 5 (50) |
| Uveitic glaucoma (UG) open angle | 14 (6.3) | 10 (6.2) | (2.5–9.9) | 6 (60) | 4 (40) |
| Steroid induced glaucoma | 13 (5.8) | 8 (5) | (1.6–8.3) | 3 (37.5) | 5 (62.5) |
| Phacomorphic glaucoma | 8 (3.6) | 5 (3.1) | (0.4–5.8) | 2 (40) | 3 (60) |
| Pigmentary glaucoma | 5 (2.2) | 3 (1.9) | (0–4) | 1 (33.3) | 2 (66.7) |
| Ghost cell glaucoma | 3 (1.3) | 2 (1.2) | (0–3) | 1 (50) | 1 (50) |
| Lens protein glaucoma | 4 (1.8) | 3 (1.9) | (0–4) | 2 (66.7) | 1 (33.3) |
| Angle recession glaucoma | 13 (5.8) | 11 (6.8) | (2.9–10.7) | 9 (81.8) | 2 (18.2) |
| Post retinal surgery glaucoma | 2 (0.9) | 2 (1.2) | (0–3) | 2 (100) | 0 (0) |
| Total | 224 | 161 | 98 (60.9) | 63 (39.1) | |
Percentage is out of total column.
Percentage is out of total row.
At presentation; the average age of patients at presentation was similar (except for childhood and juvenile glaucoma) hovering around age 60. However, patients with both closed and open angle glaucoma were relatively older (62 years) than patients with other glaucoma types. Those with normal tension glaucoma were somewhat younger (52.6). In the younger categories, the age (SD) of patients with childhood glaucoma was 1.2 (2.1) years and 25.1 (9.8) years for juvenile glaucoma. Regarding IOP level, those with childhood glaucoma presented with the highest mean IOP reaching 30.2 (10.5) while patients with closed angle glaucoma presented with the highest IOP’s among adults and had an average IOP of 28.1 mmHg (8.2). They were followed by both juvenile and open angle glaucoma (26.7 and 26 mmHg, respectively).
The severity of optic disk damage was worst among patients with juvenile glaucoma where the average cup/disk ratio (CDR) was 0.81 (0.18) and the small standard deviation reflects consistency among readings. Although the CDR among the different glaucoma types hovered around the same range, both primary open and closed angle glaucoma showed the highest rate of disk damage (0.73 and 0.72, respectively). Secondary glaucoma and normal tension glaucoma came in second with an average of 0.69 (0.25) CDR and 0.63 (0.13), respectively. Despite the optic nerve in childhood being theoretically more resilient, childhood glaucoma showed an average CDR of 0.53 (0.24).
Visual acuity at presentation highly varied widely across different types of glaucoma, The worst average LogMar was noted in eyes with secondary glaucoma; 0.79 (0.77), followed by primary open angle glaucoma; 0.63 (0.7), childhood and juvenile glaucoma; 0.59 (0.82), and primary angle closure glaucoma; 0.49 (0.6). Eyes with primary angle closure and normal tension glaucoma were the least affected in terms of vision with an average visual acuity of 0.32 (0.32) and 0.26 (0.24), respectively (Table 3).
Table 3.
Different glaucoma indices distributed by major categories of differential diagnosis.
| Diagnosis | Mean (SD) age | Mean (SD) IOP | Mean (SD) CDR | Mean (SD) VA LogMAR |
|---|---|---|---|---|
| Primary angle closure glaucoma | 62.6 (11.3) | 28.1 (8.2) | 0.72 (0.65) | 0.49 (0.6) |
| Primary angle closure | 61.5 (12.1) | 15.5 (3.2) | 0.3 (0.16) | 0.32 (0.32) |
| Secondary | 60.2 (19.5) | 23.8 (10.7) | 0.69 (0.25) | 0.79 (0.77) |
| Open angle glaucoma | 62 (14.1) | 26 (5.8) | 0.73 (0.21) | 0.63 (0.7) |
| Normal tension | 52.6 (16.9) | 15.4 (3.6) | 0.63 (0.13) | 0.26 (0.24) |
| Childhood | 1.2 (2.1) Yrs. | 30.2 (10.5) | 0.53 (0.24) | (NA) |
| Juvenile | 25.1 (9.8) | 26.7 (10.7) | 0.81 (0.18) | 0.59 (0.82) |
Analysis of variance (ANOVA) and post hoc analysis were done to determine whether or not different categories of glaucoma differed in terms of mean age, IOP, CDR, and LogMAR VA. Primary angle closure (PAC) and normal tension glaucoma were excluded from this analysis. ANOVA results showed a statistically significant difference across categories of glaucoma in terms of age (p < 0.0001), IOP (p < 0.0001), CDR (p = 0.003), and visual acuity (p = 0.002). Furthermore, post hoc analysis using Bonferroni test suggested that the source of difference was not probably due to the difference between PACG and POAG, but to differences among the other groups. Mean age at presentation, between cases with PACG and POAG was significantly different and cases with secondary glaucoma were significantly different from both types. In terms of IOP, PACG, and POAG were not statistically different, childhood and juvenile glaucoma was of no significant difference as well as secondary and developmental glaucoma. With regards to CDR, again PACG and POAG were not significantly different; moreover, cases with secondary glaucoma did not differ from PACG, OPAG, and JG. The significant difference in CDR was clear between CG and all other types except for JG. Visual acuity was only significantly different between secondary glaucoma and PACG (Table 4).
Table 4.
Differences in age, IOP, VA, and CDR across glaucoma categories.
| Variable | Diagnosis (I) | Diagnosis (II) | p Value | 95% Confidence interval |
|---|---|---|---|---|
| Age | PACG | POAG | 1 | (−1.90 to 4.32) |
| Secondary | 0 | (2.52 to 8.47) | ||
| POAG | Secondary | 0.015 | (0.50 to 8.07) | |
| IOP | PACG | POAG | 1 | (−2.02 to 2.22) |
| Secondary | 0 | (−5.48 to 1.38) | ||
| CG | 0 | (−13.90 to −9.39) | ||
| JG | 0 | (−12.04 to −2.41) | ||
| POAG | Secondary | 0.001 | (−6.11 to −0.94) | |
| CG | 0 | (−14.50 to −9.00) | ||
| JG | 0.001 | (−12.39 to 2.26) | ||
| Secondary | CG | 0 | (−10.92 to −5.52) | |
| JG | 0.341 | (−8.84 to 1.24) | ||
| CG | JG | 0.154 | (−0.70 to 9.54) | |
| LogMAR | PACG | POAG | 1 | (−0.25 to 0.07) |
| Secondary | 0 | (−0.39 to −0.07) | ||
| CG | 1 | (−1.02 to 0.88) | ||
| JG | 1 | (−0.47 to 0.31) | ||
| POAG | Secondary | 0.462 | (−0.34 to 0.06) | |
| CG | 1 | (−0.94 to 0.97) | ||
| JG | 1 | (−0.40 to 0.41) | ||
| Secondary | CG | 1 | (−0.80 to 1.11) | |
| JG | 1 | (−0.26 to 0.55) | ||
| CG | JG | 1 | (−1.03 to 1.01) | |
| CDR | PACG | POAG | 1 | (−0.15 to 0.08) |
| Secondary | 1 | (−0.10 to 0.13) | ||
| CG | 0.008 | (0.02 to 0.27) | ||
| JG | 1 | (−0.38 to 0.13) | ||
| POAG | Secondary | 1 | (−0.09 to 0.19) | |
| CG | 0.006 | (0.03 to 0.33) | ||
| JG | 1 | (−0.35 to 0.18) | ||
| Secondary | CG | 0.136 | (−0.02 to 0.28) | |
| JG | 1 | (−0.41 to 0.13) | ||
| CG | JG | 0.058 | (−0.54 to 0.00) | |
4. Discussion
The prevalence of glaucoma in Saudi Arabia was previously estimated either using hospital based data or as extrapolation of the Middle East region and other gulf area figures. To the best of our knowledge, no previous studies in our region included a large number of glaucoma patients, such as the present study, neither studied the proportion of the different types of glaucomas or their general features. We analyzed the pattern of glaucoma among glaucoma patients who presented to King Abdul Aziz University Hospital (KAUH) with the purpose of estimating such figures using internationally recognized glaucoma definitions and classifications. Although hospital or referral center based studies may face criticism regarding their ability to extrapolate the results to the prevalence of the disease or its presentation features to the general population, we hypothesize that our results may reflect in some way the situation in the Kingdom of Saudi Arabia since our institution is one of the major referral centers receiving patients from all different regions. Our results suggest a predominance of PACG followed by PAC, secondary, and POAG, respectively. If these referral center results reflect in some way the glaucoma patterns in Saudi Arabia it would be very significant because it could mean that they may be very different from those reported in the Western literature.
Many Western based studies report primary open angle glaucoma (POAG) as far more common than primary angle-closure glaucoma (PACG) worldwide (Quigley and Broman, 2006). However, population based studies from Asia and the Far East, specifically from countries with high population size such as China and India report that closed angle is more prevalent than open angle glaucoma (Foster and Johnson, 2001; Dandona et al., 2000; Herndon, 2002; Foster, 2002; Jacob et al., 1998; Vijaya et al., 2008, 2006).
Foster and Johnson have estimated that around 28.2 million persons have angle-closure disease in China. It has been estimated that PACG may actually be a more blinding disease than POAG, at least in the Chinese population (Foster and Johnson, 2001; Jacob et al., 1998). Furthermore, the Vellore Eye Study (VES) in Tamil was the first study to emphasize the potentially large burden of angle-closure disease reporting that 10.3% of the population had occludable angles or angle-closure glaucoma (Foster, 2002).
Our current study showed the mean age at presentation of patients with POAG and PACG around 62 years. This figure agrees with results reported by Herndon (2002) in a survey of glaucoma in an Eye Clinic in Ghana, West Africa, where the average age of POAG patients was (62 ± 13.3 years). However, in a glaucoma survey in Liberia, Neumann and Zauberman (1965) reported variation in age of onset, with a considerable number of cases below the age of 40 years.
Our study estimated an average IOP of 29 mmHg among Saudi patients with PACG and 27 mmHg among those with POAG. Verrey et al. (1990) observed that IOP was greater than 40 mmHg in 72% of eyes of glaucoma patients younger than 30 years. Leske et al. (1994) found a lower IOP among glaucoma patients in Barbados, with an average IOP of 27 mmHg, although 49% of these patients were receiving glaucoma treatment. We attributed the higher IOP’s noted in our patients with congenital glaucoma to a younger age and to their presenting for their initial evaluation without any glaucoma treatment. Furthermore, Buhrmann et al. (2000) reported an average IOP range from 17.7 to 21.3 mmHg among Tanzanian individuals with gonioscopically proven open angles.
Among those with POAG and developmental glaucoma patients in the current study, there was a trend towards poorer visual acuity (log Mar 0.67) and larger cup-to-disk ratios 0.7, 0.8 compared to other groups of glaucoma patients including those with PACG. Secondary glaucomas presented with mean of 0.68 cupping, in contrast with childhood glaucoma which had an average of 0.53 cupping.
It is worth mentioning that studies carried out by persons with specialized glaucoma training consistently reported higher rates of primary angle-closure suspects (PACS) and primary angle closure (PAC) than other studies (Jacob et al., 1998; Vijaya et al., 2008, 2006). This highlights the importance of standardization of definitions and providing special training to research teams before conducting glaucoma assessment studies. This is even more important in community based studies where the facilities to diagnose glaucoma cases and refer them for further investigation and confirmation may be limited.
Secondary glaucoma contributed 13% to all types of glaucoma in our study, with pseudoexfoliation being the most frequent (62%), followed by neovascular (10%) and uveitic glaucoma (8%). Buhrmann et al. (2000) and Leske et al. (1994) reported no cases of pseudoexfoliation syndrome in East Africa or Barbados, respectively. Tielsch et al. (1991) did not mention cases of pseudoexfoliation-associated glaucoma among black patients with glaucoma in the Baltimore Eye Survey.
In summary, we found PACG to be the predominant form of glaucoma in this referral center based study in Saudi Arabia, followed by PAC. If this reflects in some way what happens in the general population, it would represent a distinct pattern from that observed in Western countries and more similar to that observed in Asiatic populations. This is quite important because PACG, may be amenable to laser or surgical therapy if detected in a timely manner. A program to instruct eye care professionals regarding adequate and timely detection of this condition would be desirable, to avoid a significant number of cases that might go undetected, treated as primary open angle glaucoma or diagnosed too late.
In addition, pseudoexfoliation was the most common form of secondary open and closed angle glaucoma. The current study is hospital/referral center based, it includes a large number of patients and we focused on providing a – as accurate as possible – figure about the pattern of glaucoma in these patients. Although from this study, we cannot estimate the prevalence or the relative proportions of glaucoma in the general Saudi population, our findings may give a clue to fairly unique patterns of glaucoma in our region that would need to be studied further with general population glaucoma surveys. We are aware that our results may also suffer from a potential selection bias due to the referral nature of our patients. Still, we believe it is an important finding that among our glaucoma patients, the predominant disease was PACG followed by PAC, secondary glaucomas, and POAG.
Acknowledgments
The authors would like to acknowledge the outstanding contribution of Dr. Jose Morales, Senior Academic Consultant, Glaucoma Division, King Khaled Eye Specialist Hospital (KKESH) in enhancing the scientific content of this paper and for his constructive recommendations.
The current study has been funded and supported by the Glaucoma Research Chair at the Department of Ophthalmology, College of Medicine, King Saud University.
References
- Al Gamra H., Al Mansouri F., Khandekar R., Elshafei M., Al Qahtani O., Singh R. Prevalence and causes of blindness, low vision and status of cataract in 50 years and older citizen of Qatar-a community based survey. Ophthalmic Epidemiol. 2010;17(5):292–300. doi: 10.3109/09286586.2010.508350. [DOI] [PubMed] [Google Scholar]
- Buhrmann R.R., Quigley H.A., Barron Y., West S.K., Oliva M.S., Mmbaga B.B. Prevalence of glaucoma in a rural East African population. Invest. Ophthalmol. Vis. Sci. 2000;41(1):40–48. [PubMed] [Google Scholar]
- Dandona L., Dandona R., Mandal P., Srinivas M., John R.K., McCarty C.A. Angle-closure glaucoma in an urban population in southern India. The Andhra Pradesh eye disease study. Ophthalmology. 2000;107(9):1710–1716. doi: 10.1016/s0161-6420(00)00274-8. [DOI] [PubMed] [Google Scholar]
- Foster P.J. The epidemiology of primary angle closure and associated glaucomatous optic neuropathy. Semin. Ophthalmol. 2002;17(2):50–58. doi: 10.1076/soph.17.2.50.14718. [DOI] [PubMed] [Google Scholar]
- Foster P.J., Johnson G.J. Glaucoma in China: how big is the problem? Br. J. Ophthalmol. 2001;85(11):1277–1282. doi: 10.1136/bjo.85.11.1277. [DOI] [PMC free article] [PubMed] [Google Scholar]
- Leon W. Herndon, Pratap Challa, Ben Ababio-Danso, et al. 2002. Survey of Glaucoma in an Eye Clinic in Ghana, West Africa. J. Glaucoma 11, 421-425. [DOI] [PubMed]
- Jacob A., Thomas R., Koshi S.P., Braganza A., Muliyil J. Prevalence of primary glaucoma in an urban south Indian population. Indian J. Ophthalmol. 1998;46(2):81–86. [PubMed] [Google Scholar]
- Khandekar R., Mohammed A.J., Negrel A.D., Riyami A.A. The prevalence and causes of blindness in the Sultanate of Oman: the Oman Eye Study (OES) Br. J. Ophthalmol. 2002;86(9):957–962. doi: 10.1136/bjo.86.9.957. [DOI] [PMC free article] [PubMed] [Google Scholar]
- Leske M.C., Connell A.M., Schachat A.P., Hyman L. The Barbados Eye Study. Prevalence of open angle glaucoma. Arch. Ophthalmol. 1994;112(6):821–829. doi: 10.1001/archopht.1994.01090180121046. [DOI] [PubMed] [Google Scholar]
- Magnitude and Causes of Visual Impairment, 2004. World Health Organization, Geneva. November Fact Sheet N°282.
- Neumann E., Zauberman H. Glaucoma survey in Liberia. Am. J. Ophthalmol. 1965;59:8–12. doi: 10.1016/0002-9394(65)95010-5. [DOI] [PubMed] [Google Scholar]
- Ono K., Hiratsuka Y., Murakami A. Global inequality in eye health: country-level analysis from the Global Burden of Disease Study. Am. J. Public Health. 2010;100(9):1784–1788. doi: 10.2105/AJPH.2009.187930. [DOI] [PMC free article] [PubMed] [Google Scholar]
- Quigley H.A., Broman A.T. The number of people with glaucoma worldwide in 2010 and 2020. Br. J. Ophthalmol. 2006;90(3):262–267. doi: 10.1136/bjo.2005.081224. [DOI] [PMC free article] [PubMed] [Google Scholar]
- Resnikoff S., Pascolini D., Etya’ale D., Kocur I., Pararajasegaram R., Pokharel G.P. Global data on visual impairment in the year 2002. Bull. World Health Organ. 2004;82(11):844–851. [PMC free article] [PubMed] [Google Scholar]
- Tabbara K.F. Blindness in the eastern Mediterranean countries. Br. J. Ophthalmol. 2001;85(7):771–775. doi: 10.1136/bjo.85.7.771. [DOI] [PMC free article] [PubMed] [Google Scholar]
- Tabbara K.F., Ross-Degnan D. Blindness in Saudi Arabia. JAMA. 1986;255(24):3378–3384. [PubMed] [Google Scholar]
- Tielsch J.M., Sommer A., Katz J., Royall R.M., Quigley H.A., Javitt J. Racial variations in the prevalence of primary open-angle glaucoma. The Baltimore Eye Survey. JAMA. 1991;266(3):369–374. [PubMed] [Google Scholar]
- Verrey J.D., Foster A., Wormald R., Akuamoa C. Chronic glaucoma in northern Ghana – A retrospective study of 397 patients. Eye (Lond.) 1990;4(Pt 1):115–120. doi: 10.1038/eye.1990.14. [DOI] [PubMed] [Google Scholar]
- Vijaya L., George R., Baskaran M. Prevalence of angle closure disease in a rural south Indian population. Arch. Ophthalmol. 2006;124:403–409. doi: 10.1001/archopht.124.3.403. [DOI] [PubMed] [Google Scholar]
- Vijaya L., George R., Arvind H., Baskaran M., Ve Ramesh S., Raju P. Prevalence of primary angle-closure disease in an urban south Indian population and comparison with a rural population. The Chennai Glaucoma Study. Ophthalmology. 2008;115(4):655–660. doi: 10.1016/j.ophtha.2007.05.034. e1. [DOI] [PubMed] [Google Scholar]