

Abstract
Background
Advances in optic nerve and retinal imaging have dramatically changed the care of glaucoma patients, complementing the importance of the clinical exam of the optic nerve and automated perimetry in making the diagnosis of glaucoma. Computerized imaging, however, does not replace the clinical exam, as there can be overlap in the appearance of non-glaucomatous optic neuropathies with glaucoma.
Methods
The spectral domain optic coherence tomography (SD-OCT) images of five patients with non-glaucomatous optic nerve pathology are presented.
Cases
The first patient had bilateral temporal thinning on OCT imaging and subsequent positive syphilis testing. The second patient had a glaucomatous-appearing inferior arcuate scotoma and associated superior thinning on OCT; these findings were due to buried optic nerve head drusen, clearly appreciated on OCT of the optic nerve head. Bilateral diffuse macular thinning, with preservation of the superior and inferior fiber bundles, was seen in the third patient, who had multiple sclerosis, with no clinical history of optic neuritis. Dense and marked thinning of a macular half, respecting the horizontal meridian, is seen in two patients, one patient with non-arteritic anterior ischemic optic neuropathy and lastly, in a patient with hemi-retinal vein occlusion.
Conclusion
SD-OCT of the optic nerve and retina complements the essential clinical examination of patients with glaucomatous and non-glaucomatous optic neuropathies.
Keywords: OCT, Glaucoma, Optic neuropathy, Macular OCT
Introduction
Cupping of the optic nerve with visual field deficits characterizes glaucoma, a progressive eye disease which is difficult to diagnose at the early stage. Recent advances in optic nerve and retinal imaging have helped in the diagnosis and management of glaucoma. Computerized retinal nerve fiber layer (RNFL) thickness measurements provided by instruments such as optical coherence tomography (OCT) complements the clinical examination of the optic disc as well as the understanding of results of automated perimetry. Numerous studies have detailed the RNFL changes, as well as macular changes, seen in eyes with early, moderate, and advanced glaucoma (reviewed in 20111). Technological advances, such as the improvement from time-domain to spectral-domain in the OCT, provide optimism for earlier detection and improved management of glaucoma patients. We have recently demonstrated the utility of a modified retinal thickness mapping protocol along with asymmetry analysis in different stages of glaucoma.2
During the use of this modified retinal thickness mapping protocol over the past few years we have found utility of the same in detecting non-glaucomatous causes of optic neuropathy which presented as glaucoma. There is the potential for confusion of other important optic neuropathies with glaucomatous optic neuropathy. This confusion could result in delayed diagnosis, missing an important systemic disease or risk factor, or starting an unnecessary treatment with possible side effects.
Here, we show five case examples where the spectral domain OCT findings mimic glaucoma, but careful clinical correlation reveals a non-glaucomatous diagnosis in each case. Advanced optic nerve and retinal imaging has clearly revolutionized ophthalmological practice, complementing (and not replacing) clinical diagnosis.
Methods
Retinal nerve fiber layer and macular thickness measurements were made with the Spectralis SD-OCT (Heidelberg Engineering, Carlsbad, California) using our modified retinal thickness measurement protocol which permits high-density measurement in the macular region.2 Briefly, macular thickness is measured using 61 lines in the central 20 degree area (centered on the fovea). The retinal thickness is displayed as a color-coded thickness map, modified to reveal retinal thickness differences of 10–15 microns. This modification allows for improved visual detection of small differences in tissue thickness. The thickness maps are displayed with a grid demonstrating retinal thickness values in small 3 × 3 degree areas with the entire grid tilted to match the fovea-disc axis. Asymmetry analyses between the upper and lower halves of the macula are displayed as a gray scale plot. A black square represents a 30 micron difference at that location and a white square represents no difference between the two macular halves at that location.
Additionally, the conventional peripapillary RNFL measurement is made along 768 points around the 12 degree circle centered on the optic disc.
Five non-glaucomatous optic neuropathy cases have been chosen due to their resemblance to glaucomatous changes in the RNFL and macula.
Cases
Case 1
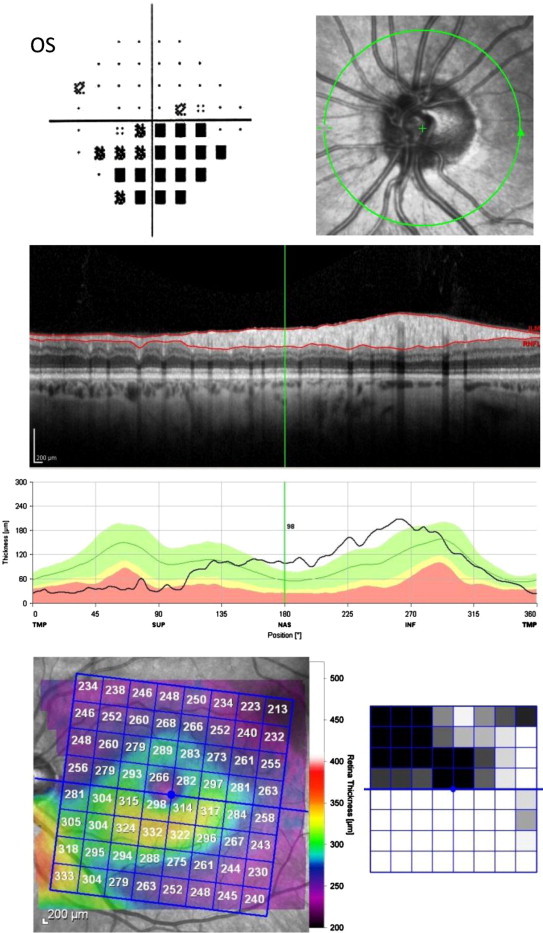
A 49 year old black male considered a glaucoma suspect was referred for glaucoma evaluation due to a visual field defect (inferior arcuate scotoma in the left eye). His familial, medical and ocular history was unremarkable. His best corrected visual acuity was 20/20 in each eye and intraocular pressures were 15 mmHg OU, on no medications; central corneal thickness was 505 microns OU. Gonioscopy revealed open angles and slit lamp examination was normal in both eyes. Symmetric, mild optic nerve cupping was observed, cup-to-disc ratio of approximately 0.75 OU. SD-OCT imaging of the RNFL showed significant temporal thinning in both eyes with loss of the superior bundle of the RNFL in the left eye (Fig. 1). On macular retinal thickness scans, the left eye demonstrated significant loss of thickness superior to the nerve as well as in the superior half of the parafoveal thickness (arrows). Both eyes showed mild temporal thickness loss along the papillomacular bundle. The hemispheric asymmetry plots (black and white squares adjacent to the macular thickness maps) show thinning in the superior hemispheres of both eyes, left eye greater than the right eye. Given the prominent temporal thinning on the OCT, a laboratory work-up was initiated. Of significance, the FTA-Abs test (Fluorescent Treponemal Antibody – absorption, for syphilis) was positive and the patient was referred to the Infectious Diseases Service for management of the infectious component of his optic neuropathy.
Figure 1.
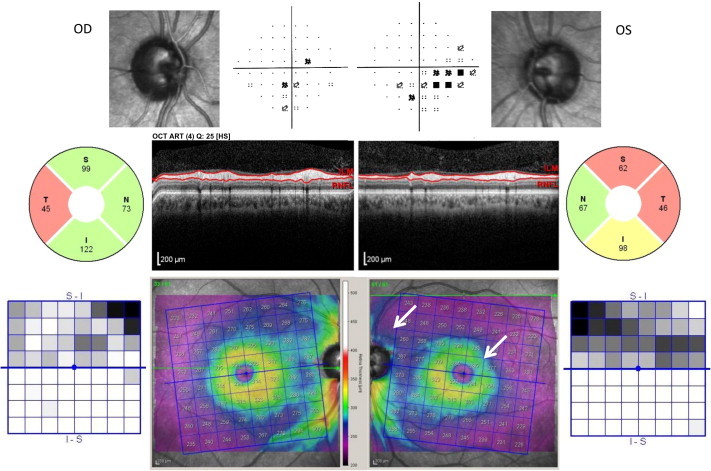
Optic neuropathy secondary to treponemal infection. Optic nerve images of the right (OD) and left (OS) eyes are displayed, adjacent to the Pattern Deviation plots from the patient’s visual field (VF). The RNFL analysis and scan are shown for each eye. The color retinal thickness maps (revealing differences of 10–15 microns) of each eye are flanked by the Asymmetry Analyses comparing the superior to inferior macular half. Note the inferior nasal defect on the VF in the left eye, and the corresponding thinning of the superior quadrant of the RNFL (arrow), suggestive of a glaucomatous defect. Also note the significant loss of the superior half of the parafoveal thickness (arrow). However, the bilateral temporal thinning is unusual in mild-moderate glaucoma.
Case 2
A 48 year old white woman was referred for glaucoma evaluation due to an inferior arcuate defect in the right eye on visual field testing. Her visual acuity is 20/20 in each eye with −4.75 sph, with intraocular pressures of 22 mmHg OU, on no medications; central corneal thickness measured 600 microns OU. Gonioscopy showed narrow occludable angles. Slit lamp examination was otherwise normal. The optic nerve evaluation showed nasal pallor of the right optic nerve, and cup-to-disc ratios of 0.1 OU. SD-OCT imaging revealed superior and nasal thinning of the RNFL of the right eye (Fig. 2). Macular thickness in the right eye showed thinning in the supertemporal area in an arcuate shape (arrow); the left eye results of RNFL and macular thickness were near normal.
Figure 2.
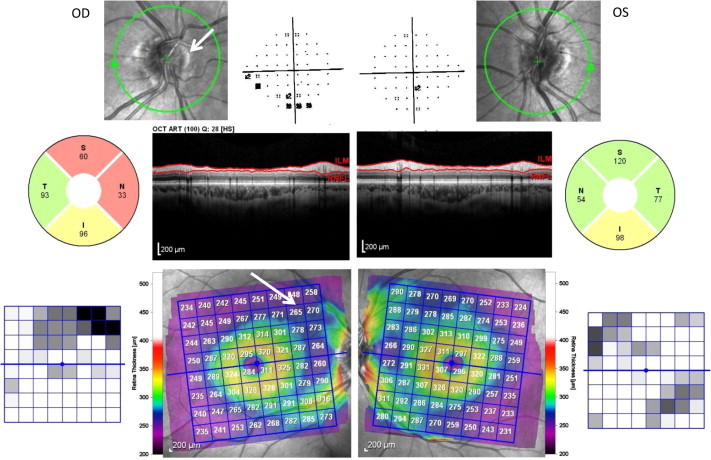
Optic nerve head drusen with associated visual abnormalities. Optic nerve images of the right (OD) and left (OS) eyes are displayed, adjacent to the Pattern Deviation plots from the patient’s VF. The RNFL analysis and scan are shown for each eye. The color retinal thickness maps of each eye are flanked by the Asymmetry Analyses comparing the superior to inferior macular half. Elevation of the nasal disc is due to drusen (arrow). Note the superior nasal defect in the RNFL with the corresponding inferior visual field defect. There is a superior arcuate-shaped area of thinning in the macula (arrow).
Optical cross sections through the optic nerve revealed buried optic nerve head drusen, nasally in the right eye (Fig. 3, arrow).
Figure 3.
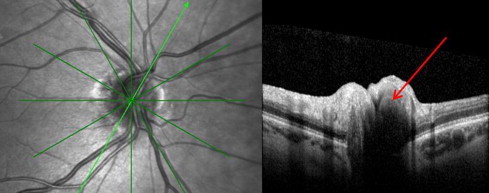
Optic nerve head drusen. The right optic nerve, with an oblique optical section through the optic nerve head, is displayed. The drusen appears dark on the OCT (arrow).
Case 3
A 45 year old black woman was referred for glaucoma evaluation due to cupping of the optic nerves. Her medical history was significant for multiple sclerosis, diabetes mellitus, and hypertension. A detailed ocular history revealed no prior episodes of optic neuritis and no visual changes. Her visual acuity measured 20/20 in each eye, with a mild astigmatic correction; color vision was normal. Her intraocular pressures were 16 mmHg OU, on no medications; central corneal thickness was 555 microns OU. Gonioscopy showed open angles in both eyes. Slit lamp examination was unremarkable. Optic nerves showed mild cupping and no pallor. SD-OCT imaging showed temporal thinning of the RNFL and diffuse macular thinning, in both eyes (Fig. 4). Extensive loss of the parafoveal ganglion cells and the papillomacular bundle was noted in both eyes with relatively normal supero and infero temporal RNFL bundles in both eyes. Humphrey visual field testing showed scattered inferior defects in the right eye and a full field in the left eye.
Figure 4.
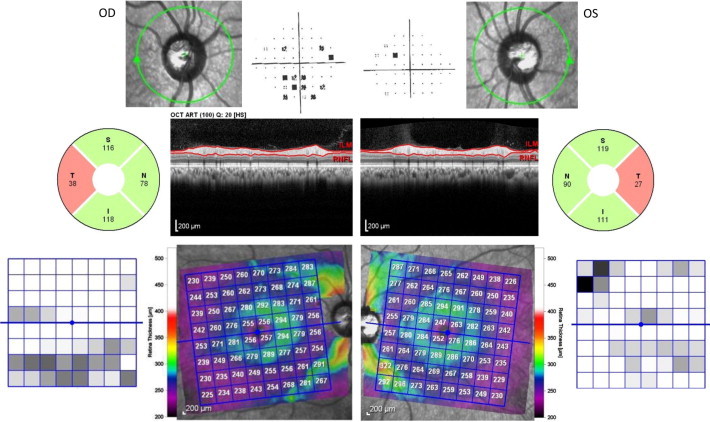
Multiple Sclerosis-associated optic neuropathy. Optic nerve images of the right (OD) and left (OS) eyes are displayed, adjacent to the Pattern Deviation plots from the patient’s VF. The RNFL analysis and scan are shown for each eye. The color retinal thickness maps of each eye are flanked by the Asymmetry Analyses comparing the superior to inferior macular half. There is bilateral temporal thinning of the RNFL, with relative preservation of the superior and inferior bundles. On the macular scan, note extensive loss of the parafoveal ganglion cells and the papillomacular bundle.
Her optic atrophy is likely secondary to previous episodes of unrecognized optic neuritis related to her multiple sclerosis. This is based on the finding of macular thickness being significantly thinned in the center but well-preserved along the supero- and infero-temporal bundles.
Case 4
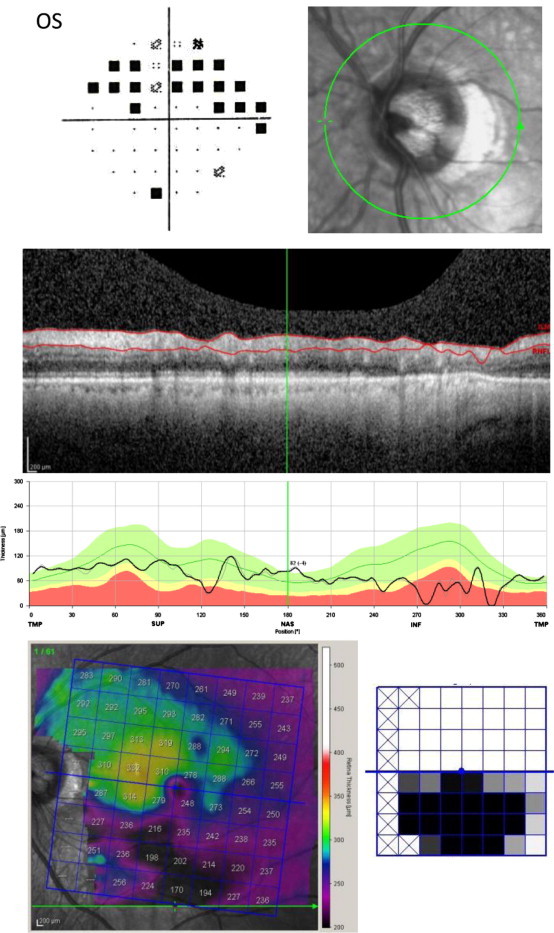
A 60 year old white woman was being treated for glaucoma due to raised intraocular pressure and a dense inferior arcuate scotoma in the left eye. Her medical history was significant for thyroid disease, hypercholesterolemia, and depression. She has also had prophylactic peripheral iridotomies for anatomically narrow angles. Her visual acuity was 20/25 in each eye; color vision was symmetric. Her intraocular pressure was 18 mmHg OU on Timolol in both eyes; central corneal thickness was 615 microns OU. Slit lamp examination demonstrated patent peripheral iridotomies and nuclear sclerotic cataracts. Optic nerve evaluation revealed cup-to-disc ratios of 0.3 OU. SD-OCT imaging was normal in the right eye and, in the left eye, showed superior and temporal thinning of the RNFL (Fig. 5). The macular thickness showed significant and diffuse thinning of the superior half of the macula of the left eye with significant thinning closest to the optic nerve. The hemisphere asymmetry plot demonstrates the significant loss of retinal thickness closest to the optic nerve. Since the cupping did not correspond to the extent of the visual field defect, further requisition of older records revealed a past history of an episode of non-arteritic anterior ischemic optic neuropathy in the left eye.
Figure 5.
Non-arteritic anterior ischemic optic neuropathy. The optic nerve image of the left (OS) eye is displayed, adjacent to the Pattern Deviation plot from the patient’s VF. The RNFL scan and analysis are shown for that eye. The retinal thickness map (shown in color) of that eye is shown with the Asymmetry Analysis (black-and-white square map to the right of the color map) comparing the superior to inferior macular half. There is superior and temporal thinning of the RNFL with an associated inferior altitudinal visual field defect. The retinal thickness of the superior half of the macula is diffusely and markedly thin, respecting the horizontal meridian.
Case 5
A 69 year old white male diagnosed with and treated for many years as normal tension glaucoma in the left eye, had a medical history significant for coronary artery disease, hypertension, hypercholesterolemia, and diabetes mellitus. His ocular history was notable for vision of counting fingers at 3 feet in the right eye due to a macular scar following laser following a central retinal vein occlusion. His visual acuity in the left eye was 20/20; his intraocular pressure was 15 mmHg OS, on two medications. Slit lamp examination and gonioscopy were normal. The optic nerve had moderate cupping, and dilated fundus examination of the left eye showed no retinal abnormalities. SD-OCT imaging in the left eye showed inferior greater than superior thinning of the RNFL; the inferior half of the macula was markedly thin with relatively near normal thickness of the superior macula (Fig. 6). Humphrey visual field testing of the left eye showed a dense superior arcuate scotoma.
Figure 6.
Hemi-retinal vein occlusion. The optic nerve image of the left (OS) eye is displayed, adjacent to the Pattern Deviation plot from the patient’s VF. The RNFL scan and analysis are shown for that eye. The retinal thickness map (shown in color) of that eye is shown with the Asymmetry Analysis comparing the superior to inferior macular half (black-and-white square map to the right of the color map). Note the superior altitudinal defect on the visual field, with the corresponding inferior thinning of the RNFL and macula. The inferior macula is markedly thin, less than 200 microns.
The marked thinning of the macula on SD-OCT map in only one hemisphere and respecting the horizontal meridian was not consistent with glaucoma, leading to a need for further investigations. A fluorescein angiogram revealed evidence of previous hemi-retinal vein occlusion.
Discussion
This series of SD-OCT images from patients with non-glaucomatous optic nerve pathologies complements a growing body of literature examining the use of OCT to diagnose, manage, and differentiate among the non-glaucomatous optic neuropathies. The representative five cases reveal the advances recently made in optic nerve and retinal imaging, as well as highlight the necessity of a careful clinical exam. As shown in Case 1, temporal thinning of the RNFL and in the macula as well as significant loss of macular thickness in the superior hemisphere of the left eye, both of which are not typical of early glaucoma, prompted further investigation into presumed normal tension glaucoma. This resulted in diagnosis of early neurosyphilis thus resulting in appropriate systemic treatment. Case 2 demonstrated the utility of SD-OCT in imaging the optic nerve head to reveal optic nerve head drusen as the cause of the nasal pallor and loss of RNFL and macular thickness. The borderline eye pressures were most likely either due to thicker pachymetry or due to the narrow angles but were less likely to be the cause of the visual field loss. This permitted the patient to be followed as a glaucoma suspect without treatment. Case 3 demonstrates the utility of SD-OCT to reveal atypical patterns of tissue loss on RNFL and macular thickness mapping. Temporal loss of RNFL is rarely seen except in very advanced glaucoma, was highly suggestive of a non-glaucomatous pathology in this patient who was considered as a glaucoma suspect. Extensive loss of macular thickness in the perifoveal region including the loss of the papillomacular bundle with relative preservation of the supero- and infero-temporal nerve fiber bundles is also atypical of early glaucoma. In Case 4, the temporal thinning of the RNFL, as well as the significant hemispheric macular thinning which so precisely respects the horizontal meridian in the retina, was representative of a vascular or neurologic event leading us to further investigate and detect the history of ischemic optic neuropathy. The raised intraocular pressures in both eyes were again possibly due to either thicker pachymetry or narrow angles and unlikely to be related to the visual field loss. This permitted us to follow this patient as a glaucoma suspect without treatment. In Case 5, the detection of a previous vascular occlusive event due to the atypical pattern of macular thickness loss helped to explain the reason for the dense superior arcuate scotoma. This permitted us to follow the patient without treatment.
Glaucoma is clearly the most studied optic neuropathy using OCT; approximately three quarters of the publications found on a query of “OCT” and “optic neuropathy” focus on glaucoma (personal observation, July 2012). However, recent studies have demonstrated the use of OCT in the management and prognosis of patients with optic neuritis and multiple sclerosis,3 and other aggressive inflammatory diseases of the central nervous system.4 In addition, recent publications show that OCT has been used for papilledema and disc edema,5 optic disc drusen,6 ischemic optic neuropathies,7 hereditary optic neuropathies,8 toxic optic neuropathies,9 and compressive optic neuropathies.10
In a recent and thorough review of “glaucoma look-alikes” by Pasol,11 he noted the importance of using the temporal quadrant of RNFL analysis, in differentiating non-glaucomatous optic neuropathies from glaucoma, as seen in our infectious and degenerative cases. As highlighted in our series, ischemic optic neuropathy and optic nerve head drusen have patterns similar to glaucoma, frequently affecting the superior-inferior quadrants as in glaucoma. In a recent prospective cross-sectional study, Suh and colleagues12 used a combination of optic disc rim area (measured by Heidelberg retinal tomography (HRT)) and RNFL thickness (measured by Cirrus time-domain OCT) to differentiate between glaucoma and non-arteritic ischemic optic neuropathy. In 2007, Chan and Miller13 examined the OCTs of patients with long-standing non-glaucomatous optic neuropathies and found a residual thickness of about 45 microns, confirming a thickness that could be attributed to the signal generated by the interface between the vitreous and inner retinal surface seen in earlier cadaveric studies.14
Conclusions
In conclusion, non-glaucomatous optic neuropathies, while less common, can be mistakenly attributed to glaucoma, with the risk of missing a systemic disease and inappropriate treatment. While advances in ophthalmic imaging have given optic nerve and retinal imaging an integral role in glaucoma management, OCT likely has a role in non-glaucomatous optic neuropathies. Continued research into these non-glaucomatous pathologies will undoubtedly improve our understanding of the pathophysiology and anatomy of the optic nerve, as well as improve our understanding of glaucomatous pathologies.
Footnotes
Peer review under responsibility of Saudi Ophthalmological Society, King Saud University.

Contributor Information
Jullia A. Rosdahl, Email: Jullia.Rosdahl@duke.edu.
Sanjay Asrani, Email: Sanjay.Asrani@duke.edu.
References
- 1.Savini G., Carbonelli M., Barboni P. Spectral-domain optical coherence tomography for the diagnosis and follow-up of glaucoma. Curr Opin Ophthalmo. 2011;22(2):115–123. doi: 10.1097/ICU.0b013e3283437222. [DOI] [PubMed] [Google Scholar]
- 2.Asrani S., Rosdahl J.A., Allingham R.R. Novel software strategy for glaucoma diagnosis: asymmetry analysis of retinal thickness. Arch Ophthalmol. 2011;129(9):1205–1211. doi: 10.1001/archophthalmol.2011.242. [DOI] [PubMed] [Google Scholar]
- 3.Tatrai E. In vivo evaluation of retinal neurodegeneration in patients with multiple sclerosis. PLoS One. 2012;7(1):e30922. doi: 10.1371/journal.pone.0030922. [DOI] [PMC free article] [PubMed] [Google Scholar]
- 4.Moura F.C. Optical coherence tomography evaluation of retinal nerve fiber layer in longitudinally extensive transverse myelitis. Arq Neuropsiquiatr. 2011;69(1):69–73. doi: 10.1590/s0004-282x2011000100014. [DOI] [PubMed] [Google Scholar]
- 5.Flores-Rodriguez P., Gili P., Martin-Rios M.D. Sensitivity and specificity of time-domain and spectral-domain optical coherence tomography in differentiating optic nerve head drusen and optic disc oedema. Ophthalmic Physiol Opt. 2012;32(3):213–221. doi: 10.1111/j.1475-1313.2012.00902.x. [DOI] [PubMed] [Google Scholar]
- 6.Lee K.M., Woo S.J., Hwang J.M. Differentiation of optic nerve head drusen and optic disc edema with spectral-domain optical coherence tomography. Ophthalmology. 2011;118(5):971–977. doi: 10.1016/j.ophtha.2010.09.006. [DOI] [PubMed] [Google Scholar]
- 7.Horowitz J. Comparison of optic nerve head topography findings in eyes with non-arteritic anterior ischemic optic neuropathy and eyes with glaucoma. Graefes Arch Clin Exp Ophthalmol. 2010;248(6):845–851. doi: 10.1007/s00417-010-1323-z. [DOI] [PubMed] [Google Scholar]
- 8.Barboni P. Retinal nerve fiber layer thickness in dominant optic atrophy measurements by optical coherence tomography and correlation with age. Ophthalmology. 2011;118(10):2076–2080. doi: 10.1016/j.ophtha.2011.02.027. [DOI] [PubMed] [Google Scholar]
- 9.Moura F.C., Monteiro M.L. Evaluation of retinal nerve fiber layer thickness measurements using optical coherence tomography in patients with tobacco-alcohol-induced toxic optic neuropathy. Indian J Ophthalmol. 2010;58(2):143–146. doi: 10.4103/0301-4738.60087. [DOI] [PMC free article] [PubMed] [Google Scholar]
- 10.Danesh-Meyer H.V. In vivo retinal nerve fiber layer thickness measured by optical coherence tomography predicts visual recovery after surgery for parachiasmal tumors. Invest Ophthalmol Vis Sci. 2008;49(5):1879–1885. doi: 10.1167/iovs.07-1127. [DOI] [PubMed] [Google Scholar]
- 11.Pasol J. Neuro-ophthalmic disease and optical coherence tomography: glaucoma look-alikes. Curr Opin Ophthalmol. 2011;22(2):124–132. doi: 10.1097/ICU.0b013e328343c1a3. [DOI] [PubMed] [Google Scholar]
- 12.Suh M.H. Comparison of the correlations between optic disc rim area and retinal nerve fiber layer thickness in glaucoma and nonarteritic anterior ischemic optic neuropathy. Am J Ophthalmol. 2011;151(2):277–286. doi: 10.1016/j.ajo.2010.08.033. e1. [DOI] [PubMed] [Google Scholar]
- 13.Chan C.K., Miller N.R. Peripapillary nerve fiber layer thickness measured by optical coherence tomography in patients with no light perception from long-standing nonglaucomatous optic neuropathies. J Neuroophthalmol. 2007;27(3):176–179. doi: 10.1097/WNO.0b013e31814b1ac4. [DOI] [PubMed] [Google Scholar]
- 14.Chauhan D.S., Marshall J. The interpretation of optical coherence tomography images of the retina. Invest Ophthalmol Vis Sci. 1999;40(10):2332–2342. [PubMed] [Google Scholar]