

Abstract
The lamina cribrosa (LC) is considered to be the principal site of retinal ganglion cell axon injury in glaucoma. Imaging technology has steadily improved in recent years, allowing greater resolution of fine details of laminar structure. Histological studies have elucidated the details of LC structure, both in normal and glaucomatous eyes, but such studies are limited by smaller sample size, greater difficulty of conducting prospective studies, and possibility of altered tissue architecture during histologic processing. We reviewed the literature describing the LC in primate and human eyes using in vivo imaging devices and provided a brief explanation of the imaging technology and main results of the articles. We also discuss the advantages and limitations of each imaging modality described, including optic disk photography, confocal scanning laser ophthalmoscopy (CSLO) and optical coherence tomography (OCT). These modalities provide en face and/or cross-sectional images of the LC in vivo. Enhanced depth imaging OCT has recently led to important advances in imaging deeper structures of the posterior segment, including the LC. Adaptive optics has been adopted in CSLO and OCT imaging to correct for ocular aberration and has improved resolution and contrast of the LC images. Post-image processing techniques to compensate for light attenuation and enhance contrast in OCT images enabled better visualization of the LC beneath the neuroretinal rim, vascular structures, and scleral rim. Long-wavelength probe OCT has shown good visualization of the LC with improved penetration when combined with swept-source OCT. Contrast agents for enhanced visualization of selective target structures in OCT have been developed. All these technologies hold great promise for improved in vivo imaging of the LC and require further investigation.
Keywords: Glaucoma, Imaging, Lamina cribrosa, Optical coherence tomography, Optic disk photography, Confocal scanning laser ophthalmoscopy
1. Introduction
The lamina cribrosa (LC) is a mesh-like structure in the scleral canal of the optic nerve head composed of overlapping and branching collagenous beams (Wilczek, 1947; Anderson, 1969; Emery et al., 1974), which form pores through which the retinal ganglion cell (RGC) axons and retinal blood vessels pass. The LC has been implicated as the principal site of RGC axonal injury in glaucoma (Bellezza et al., 2003; Minckler et al., 1977; Quigley et al., 1981, 1983; Ogden et al., 1988). Histological studies using animals, cadaver or enucleated eyes have revealed the detailed structure of the human LC in normal and glaucomatous eyes (Fig. 1) (Wilczek, 1947; Anderson, 1969; Emery et al., 1974; Quigley et al., 1981, 1983; Ogden et al., 1988; Levy and Crapps, 1984; Yan et al., 1994; Jonas et al., 2004; Quigley and Addicks, 1981). However, such studies are limited by smaller sample size and greater difficulty of conducting prospective studies, when compared with studies using in vivo imaging. Histologic processing may also alter the tissue architecture seen in vivo.
Figure 1.

(A and B) Two human optic nerve heads after digestion using detergent, viewed from vitreous side by light microscopy. Both are right eyes, oriented with superior part of nerve head above, temporal part to left. Reproduced with permission from Quigley and Addicks (1981). (C–F) Series of lamina cribrosa digests illustrating progressive posterolateral extension of floor of nerve head with increasing glaucoma damage. (C) From a normal adult, (D and E) from moderately severe glaucoma, and (F) from a blind glaucomatous eye. Reproduced with permission from Quigley et al. (1981).
Ophthalmoscopically, part of the LC is visible at the base of the optic cup. Therefore, and because it was the earliest developed technology, optic disk photography was used initially to assess the LC (Susanna, 1983; Miller and Quigley, 1988; Tezel et al., 2004). With advances in imaging technology, a variety of devices, including confocal scanning laser ophthalmoscopy (CSLO) and optical coherence tomography (OCT) have been used to evaluate the LC in vivo (Woon et al., 1992; Bhandari et al., 1997; Fontana et al., 1998; Albon et al., 2000; Morgan-Davies et al., 2004; Vilupuru et al., 2007; Kagemann et al., 2008; Inoue et al., 2009; Torti et al., 2009; Yamanari et al., 2010; Agoumi et al., 2011). Spectral-domain (SD) OCT images of the optic nerve head accurately match serial histologic sections, with visualization of part of the anterior laminar surface (Strouthidis et al., 2010). However, these in vivo imaging devices were not able to reliably visualize the anterior laminar surface beneath the neuroretinal rim, vascular structures, or scleral rim (Woon et al., 1992; Bhandari et al., 1997; Fontana et al., 1998; Albon et al., 2000; Morgan-Davies et al., 2004; Vilupuru et al., 2007; Kagemann et al., 2008; Inoue et al., 2009; Torti et al., 2009; Yamanari et al., 2010; Agoumi et al., 2011; Strouthidis et al., 2010). Enhanced depth imaging (EDI) OCT, which was developed to improve image quality of the deep posterior segment structures (Spaide et al., 2008), can be used to visualize the LC with better resolution even beneath the neuroretinal rim, substantially alleviating the limitations of conventional OCT (Lee et al., 2011). Technologies being used or developed independently or in combination to enhance the image quality of the LC as well as other ocular structures include adaptive optics, post-image processing, long-wavelength probe OCT, swept-source OCT, and contrast agents for enhanced visualization (Vilupuru et al., 2007; Torti et al., 2009; Girard et al., 2011; Srinivasan et al., 2008; Boppart et al., 2005).
2. Optic disk photography
In ophthalmoscopy or optic disk photography, the far periphery of the LC is obscured by the peripapillary scleral rim, choroid and retinal layers, and the mid-periphery by the neuroretinal rim (Fig. 2A). Retinal arteries and veins also interfere with the view of the LC. It is only through the thin, semi-transparent central prelaminar tissue that we can observe part of the LC. Therefore, the area of clinically visible LC depends on the size of the optic disk (because the cup-to-disk ratio increases with increasing optic disk size), amount of atrophied neuroretinal rim associated with glaucoma or other optic nerve diseases, and degree of optic disk tilting (Fig. 2B–E). Since the observation of the LC using optic disk photography is limited to its anterior (inner) surface, investigators often used it to assess the LC pore morphology (Susanna, 1983; Miller and Quigley, 1988; Tezel et al., 2004).
Figure 2.
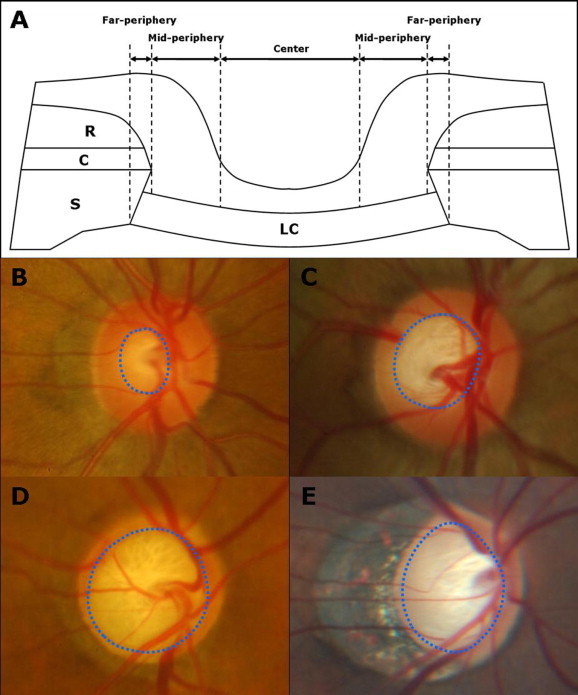
(A) Schematic diagram of cross-section of the optic nerve head shows the microstructures that obscure the lamina cribrosa from clinical view. Clinically visible portion of the lamina cribrosa (B–E, blue dotted circles) generally increases with increasing optic disc size (C), glaucomatous damage (D), and degree of optic disc tilting (E). (C = choroid; LC = lamina cribrosa; R = retina; S = sclera).
Susanna (1983) classified 71 optic disk photographs of normal or glaucoma subjects into 2 groups according to the LC pore shape: optic disks with dot-like LC pores and those with striate pores. The former group had a significantly lower prevalence of glaucomatous visual field (VF) defects than the latter (12% vs. 64%), even after age and vertical cup-to-disk ratio were controlled for. Miller and Quigley (1988) reported that the LC pores seen in optic disk photographs become elongated as a function of glaucomatous VF loss. That is, round LC pores predominate in normal or mildly glaucoma eyes, and the pores become oval and then slit-shaped with increasing VF loss. Tezel et al. (2004) investigated longitudinal changes in LC pore morphology by comparing baseline and follow-up optic disk photographs in 39 eyes with glaucoma. They demonstrated a significant decrease in LC pore size over a mean period of 3.9 years (Fig. 3), but the rate of change in pore size was not significantly different between eyes with and without progressive neuroretinal rim loss, suggesting that the LC surface morphology may continue to change in glaucoma even when the neuroretinal rim is clinically stable.
Figure 3.

Baseline optic disc status of one patient with primary open angle glaucoma (A) and another with normal tension glaucoma (C). Follow-up disc photographs (B and D) five years later of the same patients demonstrating decreased individual size of the laminar pores. Reproduced with permission from Tezel et al. (2004).
3. Confocal scanning laser ophthalmoscopy
CSLO is a technique for obtaining fundus images by using a focused laser beam to scan over the area to be imaged (Webb et al., 1987). By scanning the fundus with the laser in a raster pattern, a 2-dimensional image can be built up as an array of pixels. If a series of CSLO images are obtained at successive planes of depth in the tissue, these can be used to construct a 3-dimensional image (Fitzke and Masters, 1993). Similar to optic disk photography, CSLO cannot visualize the LC beneath the scleral rim, choroid, retinal layers, thick neuroretinal rim, or retinal vessels. However, CSLO provides higher quality images of the anterior laminar surface with improved resolution and contrast over a larger area of the disk compared to photography (Fig. 4) (Woon et al., 1992). This advantage of CSLO can be attributed in part to the fact that it automatically provides a series of images at successive planes of depth with a fixed interval between adjacent images, whereas photography usually provides only a few disc photos with manual focus. Therefore, CSLO guarantees that investigators can detect at least several high-quality images among a series (usually 30–50) of CSLO images, while photography does not.
Figure 4.

(A) Confocal scanning laser ophthalmoscopic image and (B) color optic disk photograph of the same eye. More lamina cribrosa pores are visualized with better quality in (A) than in (B).
The anterior laminar surface is quite complex when viewed in three dimensions, being shaped like a saddle (Fig. 1A and B) (Quigley and Addicks, 1981). Therefore, when the optic nerve head is scanned using CSLO at successive planes, more superficially located LC pores will be better visualized in earlier images and vice versa. In other words, no single CSLO image provides the best visualization of all visible LC pores. To alleviate this limitation, each pore can be evaluated in a separate CSLO image in which it is best visualized (Park S, et al., IOVS 2009; 50: ARVO E-Abstract 4787). Also, Bhandari et al. (1997) developed a method to correct for this luminance gradients across the field. They passed the CSLO image through a mean filter of the configuration 20 times,
resulting in a heavily smoothed image, which was then subtracted from the unfiltered image. The LC pores in the resulting image were uniformly at or near a grey level value of 0 (almost black).
Fontana et al. (1998) using a specially developed automated morphometric analysis of the LC pore in CSLO images, demonstrated that normal subjects had roughly round LC pores, whereas glaucoma patients had more elongated and less circular pores with increasing VF loss. This is consistent with the results of previous studies (Susanna, 1983; Miller and Quigley, 1988; Tezel et al., 2004), but is based on more objective and quantitative data analysis. Albon et al. (2000) using a confocal scanning laser microscope and a computer-linked visual imaging display system to assess the shape and volume of the LC in cadaver eyes, showed that the mechanical compliance and resilience of the human LC decreased with age. CSLO was also used to indirectly quantify depth variation in the anterior laminar surface. Morgan-Davies et al. (2004) examined age-matched normal subjects, patients with normal-tension glaucoma and with primary open-angle glaucoma using CSLO, and performed topographical analysis of the optic disc cup floor to assess the depth variation in the anterior laminar surface using ERDAS image processing software (ERDAS Imagine 8.4 for WinNT 4.0, ERDAS, Inc., Atlanta, GA). They found that the depth variation in the anterior laminar surface was largest in normal subjects followed by normal-tension glaucoma patients and then primary open-angle glaucoma patients.
4. Optical coherence tomography
Optic disc photography and CSLO provide en face images of the anterior laminar surface or the superficial (anterior) laminar layers. A cross-sectional view of the LC along its axis can be obtained from a 3-dimensional reconstruction of a series of CSLO images (Fitzke and Masters, 1993), but only superficial layers of the LC can be assessed, with disappointing resolution. OCT provides a 2-dimensional, cross-sectional image of optical scattering from tissue microstructures using low-coherence interferometry (Huang et al., 1991). Images generated by OCT have longitudinal and lateral spatial resolutions of a few micrometers and are useful for the qualitative and quantitative assessment and monitoring of glaucoma and other ocular diseases.
Time-domain OCT has limited ability to image the deep structures of the posterior segment, including the LC, because of a depth-dependent decrease in sensitivity and scattering of light by pigment and blood (Fig. 5A). The advent of SD-OCT greatly improved the quality of ocular imaging (Nassif et al., 2004) and volumetric SD-OCT images of the optic nerve head accurately match serial histologic sections (Strouthidis et al., 2010). It is capable of capturing the anterior laminar surface and, less frequently, the posterior laminar surface (Kagemann et al., 2008; Inoue et al., 2009; Torti et al., 2009; Yamanari et al., 2010; Agoumi et al., 2011; Strouthidis et al., 2010). Inoue et al. measured the LC thickness in 30 eyes with glaucoma or ocular hypertension using their prototype SD-OCT system and showed a significant positive correlation between the LC thickness and VF mean deviation (Inoue et al., 2009). Agoumi et al. (2011) measured the anteroposterior distance between Bruch’s membrane opening level and the anterior laminar surface before and after acute intraocular pressure (IOP) elevation (∼10 mmHg) using an ophthalmodynamometer in glaucoma patients, age-matched controls, and young controls. They demonstrated that the anterior laminar surface is noncompliant to acute IOP elevation and that acute optic disc surface changes represent compression of prelaminar tissue (Agoumi et al., 2011) However, SD-OCT does not reliably visualize the LC beneath the neuroretinal rim, vascular structures, or scleral rim (Fig. 5B and C). The reasons why the LC is not imaged well with clinical SD-OCT devices include decreasing sensitivity and resolution with increasing displacement from zero delay, decreased maximal dynamic range inherent in Fourier domain systems, wavelength dependent light scattering and signal loss in the image path, and the lateral width of the defocused imaging beam (Spaide et al., 2008).
Figure 5.

(A) Time-domain, (B and C) spectral-domain, and (D) enhanced depth imaging (EDI) spectral-domain OCT images of normal eyes. (E and F) An EDI spectral-domain OCT image of a highly myopic, glaucomatous eye with and without labels, respectively. The lamina cribrosa (LC) is distinguishable from the prelaminar tissue (PT) in (B) and (C), but not in (A). The LC is better visualized in EDI OCT images (D–F). The LC portions beneath the neuroretinal rim, vascular structure and scleral rim are better visualized in the eye with glaucoma and high myopia (E and F). (E, yellow dotted line) Anterior laminar surface.
EDI OCT was developed to improve image quality of the deep posterior segment structures (Spaide et al., 2008). In EDI OCT, the OCT instrument is pushed close enough to the eye to create an inverted image near the top of the display. This has the effect of delivering the most tightly focused portion of the illumination at the level of the choroid, inner sclera and LC. Because the LC is placed closer to the zero delay, the sensitivity of LC imaging is enhanced. EDI OCT has been used to investigate the in vivo microanatomy of the outer retina, choroid, and sclera (Spaide, 2009; Maruko et al., 2010; Imamura et al., 2011), and has recently been shown to provide detailed cross-sectional images of the LC, including the anterior laminar surface and laminar pores, even beneath the neuroretinal rim (Fig. 5D) (Lee et al., 2011). The image quality of the LC can be further increased when the noise in imaging is reduced by image averaging in an amount proportional to the square root of the number of frames averaged, but image averaging is practical only if there is a method of tracking the eye, which moves over time (Spaide et al., 2008). The LC is better visualized in a glaucomatous eye with a thin neuroretinal rim, especially if the eye is highly myopic and/or has a large area of peripapillary atrophy (Fig. 5E and F).
5. Promising technologies
Adaptive optics (AO) is a technology to improve the performance of optical systems by reducing the effect of wavefront distortions. The first successful attempt to simultaneously correct multiple higher order aberrations using an AO system was made by Liang et al. (1997). AO has been adopted in CSLO imaging to correct for ocular aberrations and has greatly improved resolution and contrast of CSLO images by increasing the amount of light reaching the detector. Vilupuru et al. scanned the optic nerve head of both eyes of rhesus monkeys with unilateral experimental glaucoma using AO CSLO (Fig. 6) and demonstrated that all measured LC morphological parameters (pore area, pore elongation, and distance of the nearest pore from each pore) were greater in glaucomatous eyes than in normal fellow eyes, suggesting altered LC structure in glaucoma (Vilupuru et al., 2007). AO has also been incorporated into OCT (Torti et al., 2009; Hermann et al., 2004; Kurokawa et al., 2010a, 2010b) and has enabled visualization of collagenous plates of the LC and nerve fiber bundles passing through them in the optic nerve head (Torti et al., 2009).
Figure 6.

Axial sections at the optic nerve head traveling in the anterior-to-posterior direction from the top left to bottom right frame using adaptive optics confocal scanning laser ophthalmoscopy. Reproduced with permission from Vilupuru et al. (2007).
Advances in post-image processing techniques will be useful to improve LC imaging. Algorithms that compensate for light attenuation and enhance contrast in OCT images can significantly improve the quality of optic nerve head images clinically captured with OCT. Girard et al. (2011) developed and applied compensation and contrast enhancement algorithms to SD OCT images and demonstrated significantly reduced intra-layer contrast within the LC and significantly increased inter-layer contrast between the LC and the prelaminar tissue (Fig. 7).
Figure 7.

Horizontal cross-sectional images of the optic nerve head using spectral-domain OCT: (A) before and (B) after compensation for light attenuation and contrast enhancement. Reproduced with permission from Girard et al. (2011).
OCT at wavelengths >900 nm offers multiple advantages over ∼800-nm OCT, such as improved penetration in the choroid, noninvasive probing of retinal function, and reduced susceptibility of OCT images to water dispersion (Unterhuber et al., 2005; Yao et al., 2005; Puvanathasan et al., 2008). It also provides superior visualization of the posterior pole in cataractous eyes (Esmaeelpour et al., 2010). Although images of the LC have not been systematically compared between ∼800-nm OCT and ∼1000-nm OCT, improved visualization of the LC even under the neuroretinal rim, vascular structure, or scleral rim may be possible with longer-wavelength probe OCT because of better penetration of the OCT beam.
There are two techniques for Fourier domain OCT imaging: SD OCT and swept-source (SS) OCT. In SD OCT, a broad spectrum light source is used and the output of the interferometer is measured with a spectrometer and a high speed CCD array or line scan camera. SS OCT, also called optical frequency domain imaging or chirped radar, sweeps the frequency of a narrow band, continuous wave light source and collects the time dependent interference signal (Chinn et al., 1997). SS OCT offers several advantages over SD OCT, including reduced fringe washout, better sensitivity with imaging depth (lower sensitivity roll-off), longer imaging range, higher detection efficiencies (because there are no spectrometer grating losses), and ability to perform dual balanced detection (Chinn et al., 1997). Compared to the axial scan rates of 20,000-60,000 per second in current commercial ophthalmic SD OCT instruments and 312,000 per second in a research OCT instrument using a high speed CMOS camera, SS OCT provides 100,000–400,000 axial scans per second (Srinivasan et al., 2008; Potsaid et al., 2010). The combination of this ultrahigh imaging speed and longer wavelength (∼1000 nm) enables good visualization of the deeper layers of the optic nerve head and peripapillary structures including the choroid, sclera, and LC (Fig. 8) (Srinivasan et al., 2008).
Figure 8.

Imaging of the lamina cribrosa obtained using the ultrahigh-speed swept-source OCT with a wavelength of 1060 nm. (A) Images are interpolated onto en face planes through the 3D OCT data set at different depths relative to the RPE. (B) Interpolated images show the porous structure of the lamina cribrosa. (C) A series of six consecutive images compounded by median filtering along the slow axis shows enhanced visualization of deeper structures. Reproduced with permission from Srinivasan et al. (2008).
As with other tomographic imaging techniques, such as computed tomography and magnetic resonance imaging, contrast agents can be used to enhance ophthalmic OCT imaging. Recent reports on using contrast agents to enhance the target selectivity of OCT systems are very promising (Adler et al., 2008; Oldenburg et al., 2008; Wang and Elder, 2002; Sokolov et al., 2003; Douma et al., 2009; Ehlers et al., 2010), but there has been no report on the use of contrast agents in LC imaging. OCT contrast enhancements can be achieved through exogenous methods, which use the inherent wavelength-dependent absorption patterns of the imaged tissues to enhance image contrast such as with spectroscopic OCT, or endogenous methods, which add an agent or material to the tissue of interest to improve imaging contrast (Boppart, 2006). Exogenous contrast agents include scattering agents (e.g., gold microspheres, liposomes), magnetomotive agents, and near-infrared absorbing dyes (Boppart, 2006). Gold (Adler et al., 2008) and magnetomotive (Boppart et al., 2005) nanoparticle contrast agents have been shown to be useful in OCT imaging in animals, and gold nanoparticle antibody conjugates have been examined for in vivo imaging of human subjects (Sokolov et al., 2003). However, the systemic and ocular safety of nanotechnology drugs in humans is still under debate (Grainger, 2009). Any substance that exhibits high backscattering properties resulting in increased reflectivity may be useful as an OCT contrast agent (Boppart et al., 2005).
6. Conclusion
We have discussed optic disc photography, CSLO, OCT and other technologies that can be used for imaging the LC. Despite the significant advances in ocular imaging technology, it is not always possible to visualize a substantial portion of the LC in vivo, especially in small optic discs with small cup-to-disc ratio or when the optic disc is largely obscured by many retinal arterial branches and venous tributaries. The incorporation of newer technologies in various imaging modalities and advances in post-imaging processing techniques will improve en face and/or cross-sectional imaging of the LC. Further investigation is needed in these fields as well as for the clinical application of currently available LC imaging techniques.
Financial disclosures
None.
Financial support
Supported by the Michael Fux and Gloria Rubin Research Fund of the New York Glaucoma Research Institute, New York, NY.
References
- Adler D.C., Huang S.W., Huber R., Fujimoto J.G. Photothermal detection of gold nanoparticles using phase-sensitive optical coherence tomography. Opt. Expr. 2008;16:4376–4393. doi: 10.1364/oe.16.004376. [DOI] [PubMed] [Google Scholar]
- Agoumi Y., Sharpe G.P., Hutchison D.M., Nicolela M.T., Artes P.H., Chauhan B.C. Laminar and prelaminar tissue displacement during intraocular pressure elevation in glaucoma patients and healthy controls. Ophthalmology. 2011;118:52–59. doi: 10.1016/j.ophtha.2010.05.016. [DOI] [PubMed] [Google Scholar]
- Albon J., Purslow P.P., Karwatowski W.S., Easty D.L. Age related compliance of the lamina cribrosa in human eyes. Br. J. Ophthalmol. 2000;84:318–323. doi: 10.1136/bjo.84.3.318. [DOI] [PMC free article] [PubMed] [Google Scholar]
- Anderson D.R. Ultrastructure of human and monkey lamina cribrosa and optic nerve head. Arch. Ophthalmol. 1969;82:800–814. doi: 10.1001/archopht.1969.00990020792015. [DOI] [PubMed] [Google Scholar]
- Bellezza A.J., Rintalan C.J., Thompson H.W., Downs J.C., Hart R.T., Burgoyne C.F. Deformation of the lamina cribrosa and anterior scleral canal wall in early experimental glaucoma. Invest. Ophthalmol. Vis. Sci. 2003;44:623–637. doi: 10.1167/iovs.01-1282. [DOI] [PubMed] [Google Scholar]
- Bhandari A., Fontana L., Fitzke F.W., Hitchings R.A. Quantitative analysis of the lamina cribrosa in vivo using a scanning laser opthalmoscope. Curr. Eye Res. 1997;16:1–8. doi: 10.1076/ceyr.16.1.1.5114. [DOI] [PubMed] [Google Scholar]
- Boppart S.A. Advances in contrast enhancement for optical coherence tomography. Conf. Proc. IEEE Eng. Med. Biol. Soc. 2006;1:121–124. doi: 10.1109/IEMBS.2006.259366. [DOI] [PubMed] [Google Scholar]
- Boppart S.A., Oldenburg A.L., Xu C., Marks D.L. Optical probes and techniques for molecular contrast enhancement in coherence imaging. J. Biomed. Opt. 2005;10:41208. doi: 10.1117/1.2008974. [DOI] [PubMed] [Google Scholar]
- Chinn S.R., Swanson E.A., Fujimoto J.G. Optical coherence tomography using a frequency-tunable optical source. Opt. Lett. 1997;22:340–342. doi: 10.1364/ol.22.000340. [DOI] [PubMed] [Google Scholar]
- Douma K., Prinzen L., Slaaf D.W. Nanoparticles for optical molecular imaging of atherosclerosis. Small. 2009;5:544–557. doi: 10.1002/smll.200801079. [DOI] [PubMed] [Google Scholar]
- Ehlers J.P., Gupta P.K., Farsiu S. Evaluation of contrast agents for enhanced visualization in optical coherence tomography. Invest. Ophthalmol. Vis. Sci. 2010;51:6614–6619. doi: 10.1167/iovs.10-6195. [DOI] [PubMed] [Google Scholar]
- Emery J.M., Landis D., Paton D., Boniuk M., Craig J.M. The lamina cribrosa in normal and glaucomatous human eyes. Trans. Am. Acad. Ophthalmol. Otolaryngol. 1974;78:OP290–OP297. [PubMed] [Google Scholar]
- Esmaeelpour M., Povazay B., Hermann B. Three-dimensional 1060-nm OCT: choroidal thickness maps in normal subjects and improved posterior segment visualization in cataract patients. Invest. Ophthalmol. Vis. Sci. 2010;51:5260–5266. doi: 10.1167/iovs.10-5196. [DOI] [PubMed] [Google Scholar]
- Fitzke F.W., Masters B.R. Three-dimensional visualization of confocal sections of in vivo human fundus and optic nerve. Curr. Eye Res. 1993;12:1015–1018. doi: 10.3109/02713689309029228. [DOI] [PubMed] [Google Scholar]
- Fontana L., Bhandari A., Fitzke F.W. In vivo morphometry of the lamina cribrosa and its relation to visual field loss in glaucoma. Curr. Eye Res. 1998;17:363–369. doi: 10.1080/02713689808951216. [DOI] [PubMed] [Google Scholar]
- Girard, M.J., Strouthidis, N.G., Ethier, C.R., Mari, J.M., 2011. Shadow removal and contrast enhancement in optical coherence tomography images of the human optic nerve head. Invest. Ophthalmol. Vis. Sci., 2011 May 6 [Epub ahead of print]. [DOI] [PubMed]
- Grainger D.W. Nanotoxicity assessment: all small talk? Adv. Drug. Deliv. Rev. 2009;61:419–421. doi: 10.1016/j.addr.2009.04.003. [DOI] [PMC free article] [PubMed] [Google Scholar]
- Hermann B., Fernández E.J., Unterhuber A. Adaptive-optics ultrahigh-resolution optical coherence tomography. Opt. Lett. 2004;29:2142–2144. doi: 10.1364/ol.29.002142. [DOI] [PubMed] [Google Scholar]
- Huang D., Swanson E.A., Lin C.P. Optical coherence tomography. Science. 1991;254:1178–1181. doi: 10.1126/science.1957169. [DOI] [PMC free article] [PubMed] [Google Scholar]
- Imamura Y., Iida T., Maruko I., Zweifel S.A., Spaide R.F. Enhanced depth imaging optical coherence tomography of the sclera in dome-shaped macula. Am. J. Ophthalmol. 2011;151:297–302. doi: 10.1016/j.ajo.2010.08.014. [DOI] [PubMed] [Google Scholar]
- Inoue R., Hangai M., Kotera Y. Three-dimensional high-speed optical coherence tomography imaging of lamina cribrosa in glaucoma. Ophthalmology. 2009;116:214–222. doi: 10.1016/j.ophtha.2008.09.008. [DOI] [PubMed] [Google Scholar]
- Jonas J.B., Berenshtein E., Holbach L. Lamina cribrosa thickness and spatial relationships between intraocular space and cerebrospinal fluid space in highly myopic eyes. Invest. Ophthalmol. Vis. Sci. 2004;45:2660–2665. doi: 10.1167/iovs.03-1363. [DOI] [PubMed] [Google Scholar]
- Kagemann L., Ishikawa H., Wollstein G. Ultrahigh-resolution spectral domain optical coherence tomography imaging of the lamina cribrosa. Ophthal. Surg. Lasers Imag. 2008;39:S126–S131. doi: 10.3928/15428877-20080715-07. [DOI] [PMC free article] [PubMed] [Google Scholar]
- Kurokawa K., Sasaki K., Makita S., Yamanari M., Cense B., Yasuno Y. Simultaneous high-resolution retinal imaging and high-penetration choroidal imaging by one-micrometer adaptive optics optical coherence tomography. Opt. Expr. 2010;18:8515–8527. doi: 10.1364/OE.18.008515. [DOI] [PubMed] [Google Scholar]
- Kurokawa K., Tamada D., Makita S., Yasuno Y. Adaptive optics retinal scanner for one-micrometer light source. Opt. Expr. 2010;18:1406–1418. doi: 10.1364/OE.18.001406. [DOI] [PubMed] [Google Scholar]
- Lee E.J., Kim T.W., Weinreb R.N., Park K.H., Kim S.H., Kim D.M. Visualization of the lamina cribrosa using enhanced depth imaging spectral-domain optical coherence tomography. Am. J. Ophthalmol. 2011;152:87–95. doi: 10.1016/j.ajo.2011.01.024. [DOI] [PubMed] [Google Scholar]
- Levy N.S., Crapps E.E. Displacement of optic nerve head in response to short-term intraocular pressure elevation in human eyes. Arch. Ophthalmol. 1984;102:782–786. doi: 10.1001/archopht.1984.01040030630037. [DOI] [PubMed] [Google Scholar]
- Liang J., Williams D.R., Miller D.T. Supernormal vision and high-resolution retinal imaging through adaptive optics. J. Opt. Soc. Am. A: Opt. Image Sci. Vis. 1997;14:2884–2892. doi: 10.1364/josaa.14.002884. [DOI] [PubMed] [Google Scholar]
- Maruko I., Iida T., Sugano Y., Ojima A., Ogasawara M., Spaide R.F. Subfoveal choroidal thickness after treatment of central serous chorioretinopathy. Ophthalmology. 2010;117:1792–1799. doi: 10.1016/j.ophtha.2010.01.023. [DOI] [PubMed] [Google Scholar]
- Miller K.M., Quigley H.A. The clinical appearance of the lamina cribrosa as a function of the extent of glaucomatous optic nerve damage. Ophthalmology. 1988;95:135–138. doi: 10.1016/s0161-6420(88)33219-7. [DOI] [PubMed] [Google Scholar]
- Minckler D.S., Bunt A.H., Johanson G.W. Orthograde and retrograde axoplasmic transport during acute ocular hypertension in the monkey. Invest. Ophthalmol. Vis. Sci. 1977;16:426–441. [PubMed] [Google Scholar]
- Morgan-Davies J., Taylor N., Hill A.R., Aspinall P., O’Brien C.J., Azuara-Blanco A. Three dimensional analysis of the lamina cribrosa in glaucoma. Br. J. Ophthalmol. 2004;88:1299–1304. doi: 10.1136/bjo.2003.036020. [DOI] [PMC free article] [PubMed] [Google Scholar]
- Nassif N., Cense B., Park B. In vivo high-resolution video-rate spectral-domain optical coherence tomography of the human retina and optic nerve. Opt. Expr. 2004;12:367–376. doi: 10.1364/opex.12.000367. [DOI] [PubMed] [Google Scholar]
- Ogden T.E., Duggan J., Danley K., Wilcox M., Minckler D.S. Morphometry of nerve fiber bundle pores in the optic nerve head of the human. Exp. Eye Res. 1988;46:559–568. doi: 10.1016/s0014-4835(88)80012-5. [DOI] [PubMed] [Google Scholar]
- Oldenburg A.L., Applegate B.E., Izatt J.A., Boppart S.A. Molecular optical coherence tomography contrast enhancement and imaging. In: Drexler W., Fujimoto J.G., editors. Optical Coherence Tomography Technology and Applications. Springer; Berlin: 2008. [Google Scholar]
- Potsaid B., Baumann B., Huang D. Ultrahigh speed 1050nm swept source/Fourier domain OCT retinal and anterior segment imaging at 100,000 to 400,000 axial scans per second. Opt. Expr. 2010;18:20029–20048. doi: 10.1364/OE.18.020029. [DOI] [PMC free article] [PubMed] [Google Scholar]
- Puvanathasan P., Forbes P., Ren Z., Malchow D., Boyd S., Bizheva K. High-speed, high-resolution Fourier-domain optical coherence tomography system for retinal imaging in the 1060 nm wavelength region. Opt. Lett. 2008;33:2479–2481. doi: 10.1364/ol.33.002479. [DOI] [PubMed] [Google Scholar]
- Quigley H.A., Addicks E.M. Regional differences in the structure of the lamina cribrosa and their relation to glaucomatous optic nerve damage. Arch. Ophthalmol. 1981;99:137–143. doi: 10.1001/archopht.1981.03930010139020. [DOI] [PubMed] [Google Scholar]
- Quigley H.A., Addicks E.M., Green W.R., Maumenee A.E. Optic nerve damage in human glaucoma. II. The site of injury and susceptibility to damage. Arch. Ophthalmol. 1981;99:635–649. doi: 10.1001/archopht.1981.03930010635009. [DOI] [PubMed] [Google Scholar]
- Quigley H.A., Hohman R.M., Addicks E.M., Massof R.W., Green W.R. Morphologic changes in the lamina cribrosa correlated with neural loss in open-angle glaucoma. Am. J. Ophthalmol. 1983;95:673–691. doi: 10.1016/0002-9394(83)90389-6. [DOI] [PubMed] [Google Scholar]
- Sokolov K., Follen M., Aaron J. Real-time vital optical imaging of precancer using anti-epidermal growth factor receptor antibodies conjugated to gold nanoparticles. Cancer Res. 2003;63:1999–2004. [PubMed] [Google Scholar]
- Spaide R.F. Enhanced depth imaging optical coherence tomography of retinal pigment epithelial detachment in age-related macular degeneration. Am. J. Ophthalmol. 2009;147:644–652. doi: 10.1016/j.ajo.2008.10.005. [DOI] [PubMed] [Google Scholar]
- Spaide R.F., Koizumi H., Pozzoni M.C. Enhanced depth imaging spectral-domain optical coherence tomography. Am. J. Ophthalmol. 2008;146:496–500. doi: 10.1016/j.ajo.2008.05.032. [DOI] [PubMed] [Google Scholar]
- Srinivasan V.J., Adler D.C., Chen Y. Ultrahigh-speed optical coherence tomography for three-dimensional and en face imaging of the retina and optic nerve head. Invest. Ophthalmol. Vis. Sci. 2008;49:5103–5110. doi: 10.1167/iovs.08-2127. [DOI] [PMC free article] [PubMed] [Google Scholar]
- Strouthidis N.G., Grimm J., Williams G.A., Cull G.A., Wilson D.J., Burgoyne C.F. A comparison of optic nerve head morphology viewed by spectral domain optical coherence tomography and by serial histology. Invest. Ophthalmol. Vis. Sci. 2010;51:1464–1474. doi: 10.1167/iovs.09-3984. [DOI] [PMC free article] [PubMed] [Google Scholar]
- Susanna R. The lamina cribrosa and visual field defects in open-angle glaucoma. Can. J. Ophthalmol. 1983;18:124–126. [PubMed] [Google Scholar]
- Tezel G., Trinkaus K., Wax M.B. Alterations in the morphology of lamina cribrosa pores in glaucomatous eyes. Br. J. Ophthalmol. 2004;88:251–256. doi: 10.1136/bjo.2003.019281. [DOI] [PMC free article] [PubMed] [Google Scholar]
- Torti C., Povazay B., Hofer B. Adaptive optics optical coherence tomography at 120,000 depth scans/s for non-invasive cellular phenotyping of the living human retina. Opt. Expr. 2009;17:19382–19400. doi: 10.1364/OE.17.019382. [DOI] [PMC free article] [PubMed] [Google Scholar]
- Unterhuber A., Povazay B., Hermann B., Sattmann H., Chavez-Pirson A., Drexler W. In vivo retinal optical coherence tomography at 1040 nm-enhanced penetration into the choroid. Opt. Expr. 2005;13:3252–3258. doi: 10.1364/opex.13.003252. [DOI] [PubMed] [Google Scholar]
- Vilupuru A.S., Rangaswamy N.V., Frishman L.J., Smith E.L., 3rd, Harwerth R.S., Roorda A. Adaptive optics scanning laser ophthalmoscopy for in vivo imaging of lamina cribrosa. J. Opt. Soc. Am. A: Opt. Image Sci. Vis. 2007;24:1417–1425. doi: 10.1364/josaa.24.001417. [DOI] [PMC free article] [PubMed] [Google Scholar]
- Wang R.K., Elder J.B. Propylene glycol as a contrasting agent for optical coherence tomography to image gastrointestinal tissues. Lasers Surg. Med. 2002;30:201–208. doi: 10.1002/lsm.10013. [DOI] [PubMed] [Google Scholar]
- Webb R.H., Hughes G.W., Delori F.C. Confocal scanning laser ophthalmoscope. Appl. Opt. 1987;26:1492–1499. doi: 10.1364/AO.26.001492. [DOI] [PubMed] [Google Scholar]
- Wilczek M. The lamina cribrosa and its nature. Br. J. Ophthalmol. 1947;31:551–565. doi: 10.1136/bjo.31.9.551. [DOI] [PMC free article] [PubMed] [Google Scholar]
- Woon W.H., Fitzke F.W., Bird A.C., Marshall J. Confocal imaging of the fundus using a scanning laser ophthalmoscope. Br. J. Ophthalmol. 1992;76:470–474. doi: 10.1136/bjo.76.8.470. [DOI] [PMC free article] [PubMed] [Google Scholar]
- Yamanari M., Makita S., Lim Y., Yasuno Y. Full-range polarization-sensitive swept-source optical coherence tomography by simultaneous transversal and spectral modulation. Opt. Expr. 2010;18:13964–13980. doi: 10.1364/OE.18.013964. [DOI] [PubMed] [Google Scholar]
- Yan D.B., Coloma F.M., Metheetrairut A., Trope G.E., Heathcote J.G., Ethier C.R. Deformation of the lamina cribrosa by elevated intraocular pressure. Br. J. Ophthalmol. 1994;78:643–648. doi: 10.1136/bjo.78.8.643. [DOI] [PMC free article] [PubMed] [Google Scholar]
- Yao X.C., Yamauchi A., Perry B., George J.S. Rapid optical coherence tomography and recording functional scattering changes from activated frog retina. Appl. Opt. 2005;44:2019–2023. doi: 10.1364/ao.44.002019. [DOI] [PubMed] [Google Scholar]