Abstract
OBJECTIVE
The objective of our study was to investigate the feasibility of computerized segmentation of lesions on head and neck CT scans and evaluate its potential for estimating changes in tumor volume in response to treatment of head and neck cancers.
MATERIALS AND METHODS
Twenty-six CT scans were retrospectively collected from the files of 13 patients with 35 head and neck lesions. The CT scans were obtained from an examination performed before treatment (pretreatment scan) and an examination performed after one cycle of chemotherapy (posttreatment scan). Thirteen lesions were primary site cancers and 22 were metastatic lymph nodes. An experienced radiologist (radiologist 1) marked the 35 lesions and outlined each lesion’s 2D contour on the best slice on both the pre- and posttreatment scans. Full 3D contours were also manually extracted for the 13 primary tumors. Another experienced radiologist (radiologist 2) verified and modified, if necessary, all manually drawn 2D and 3D contours. An in-house-developed computerized system performed 3D segmentation based on a level set model.
RESULTS
The computer-estimated change in tumor volume and percentage change in tumor volume between the pre- and posttreatment scans achieved a high correlation (intra-class correlation coefficient [ICC] = 0.98 and 0.98, respectively) with the estimates from manual segmentation for the 13 primary tumors. The average error in estimating the percentage change in tumor volume by automatic segmentation relative to the radiologists’ average error was −1.5% ± 5.4% (SD). For the 35 lesions, the ICC between the automatic and manual estimates of change in pre- to posttreatment tumor area was 0.93 and of percentage change in pre-to posttreatment tumor area was 0.85. The average error in estimating the percentage change in tumor area by automatic segmentation was −3.2% ± 15.3%.
CONCLUSION
Preliminary results indicate that this computerized segmentation system can reliably estimate changes in tumor size on CT scans relative to radiologists’ manual segmentation. This information can be used to calculate changes in tumor size on pre- and posttreatment scans to assess response to treatment.
Keywords: computer 3D segmentation, CT scans, head and neck cancer, level sets, response to treatment therapy
Both men and women are affected by head and neck cancer, which can cause substantial morbidity and mortality [1]. Early diagnosis and treatment of these lesions could be beneficial for patients by increasing the chances of a positive outcome especially if the lesions detected are in a regional localized stage.
The treatment of patients with oropharyngeal and laryngeal cancer usually involves surgery or nonsurgical organ preservation therapy. For patients with locally advanced tumors, the organ-preserving strategies are often the treatment of choice. Neoadjuvant therapy is an organ preservation treatment approach that includes a trial of chemotherapy followed by radiation therapy. The change in size of the primary tumor is estimated after one cycle of chemotherapy at endoscopy. Patients with tumors that have decreased in size more than 50% are considered to be responders and can be treated with combined chemotherapy and radiation therapy. Patients are offered surgical resection if the primary tumor shows a reduction in size of less than 50%. A number of clinical trials have shown comparable survival rates between groups treated with neoadjuvant chemotherapy and those treated with surgical resection [2, 3].
To identify patients with head and neck cancers that would best be treated with nonsurgical organ preservation therapy, it is very important to obtain an accurate estimate of the response to induction therapy. This assessment is performed usually by endoscopic evaluation, which is often subjective. On the other hand, the gross tumor volume (GTV) has been identified as an independent variable for predicting local control for different subsites in the head and neck [4–8]. A number of studies have shown that CT is an effective noninvasive technique for measuring the primary site GTV [4–7] and allows, in addition, reliable measurements of the volume of the primary site tumor across institutions [9]. Current state-of-the-art MDCT uses thin-slice acquisition (< 2.5 mm) with a 50% overlap, which results in a large number of slices in a scan. Manually drawing the contour of the tumor in the large number of images to calculate the GTV is time-consuming, and the amount of time needed for this task precludes tumor volumes from being obtained in routine patient care. In addition, there are inter- and intraobserver variabilities in radiologists’ manual segmentation of head and neck tumors on CT, which can influence the accuracy of the results.
With the increased number of organ preservation procedures using neoadjuvant therapy and the increase in radiologists’ workload, the role of automatic and semiautomatic segmentation tools in the evaluation of tumor response to treatment becomes increasingly important.
A wide variety of techniques and models have been developed for the segmentation of anatomic structures and lesions in medical images. Some of the major methods have been reviewed [10]. Here, we briefly summarize some of the techniques related to the segmentation of head and neck lesions. Chong et al. [11] used a combined technique that included seed growing, clustering, and mathematic morphology to semiautomatically segment nasopharyngeal carcinomas. Lee et al. [12] used clustering and seed growing to segment pixels with different postcontrast-enhanced gray level values and ratios of pre- to postcontrast enhancement within predefined ranges corresponding to various tissue types on head and neck MRI scans. Street et al. [10] proposed a level set– based method for segmentation of head and neck lesions including both primary tumors and lymph nodes on CT scans. Dornheim et al. [13] segmented lymph nodes on CT using a mass spring model, whereas Gorthi et al. [14] used an active contour-based method. Schinagl et al. [15] evaluated threshold-based segmentation of head and neck tumors on18FFDG PET scans.
The purpose of this preliminary study was to evaluate the potential usefulness of a computerized system developed in our laboratory for segmenting lesions in head and neck CT scans and estimating lesion volume to assist radiologists in monitoring volume change of malignant lesions in response to treatment.
Materials and Methods
Data Set
The data collection protocol had been approved by our institutional review board and is HIPAA compliant. Patient informed consent was waived for this retrospective study. Our data set contained temporal CT volume pairs from 13 patients with head and neck neoplasms who participated in a nonsurgical organ preservation therapy clinical trial in our institution. The study group was composed of eight men and five women ranging in age from 44 to 80 years (mean age, 55.2 years). The primary tumors were stage III or IV. Seven of the primary tumors were in the tongue, two were in the tonsil, two were vallecular cancers, and two were supraglottic cancers. In addition, there were 22 metastatic lymph nodes. For the estimation of the change in tumor extent, an IV contrast-enhanced CT scan from a pretreatment examination and an IV contrast-enhanced CT scan obtained after one cycle of chemotherapy were used for each case, resulting in 26 CT scans collected for the 13 patients. The CT studies were acquired in our clinic with a variety of scanners manufactured by GE Healthcare including the following scanner models from the LightSpeed series: Ultra, Pro 16, and LightSpeed 16. The pixel size ranged from 0.352 to 0.586 mm. The slice thicknesses were 1.25 and 2.5 mm.
To obtain a reference standard for comparison with the computer segmentation, a radiologist (radiologist 1) with 7 years of experience reading head and neck CT scans used an in-house-developed graphic user interface (GUI) to identify and mark 35 temporal pairs of lesions on the CT scans with bounding boxes including the 13 primary site cancers and the 22 metastatic lymph nodes. The sizes of the bounding boxes varied to enclose lesions of different sizes. In addition, for all 35 lesions, the radiologist measured the longest diameter and its perpendicular on the pre-and posttreatment scans using an electronic caliper provided by the GUI. The size measurements for every lesion were performed on the 2D slice on which the lesion is best represented (with its maximum size); we define this slice as the “best slice.” The radiologist also provided a subjective rating of the degree of difficulty in visualizing the lesion boundaries on a scale of 5 (5 = most difficult) relative to lesions seen in clinical practice. The lesion measurements were verified and modified, if necessary, by another radiologist (radiologist 2) with 16 years of experience reading head and neck CT scans.
The average size (the longest diameter) of the 13 primary site cancers was 29.9 mm (range, 17.2– 44.8 mm) on the pretreatment CT scans and 20.7 mm (range, 10.5–37.1 mm) on the posttreatment CT scans. For the 22 metastatic lymph nodes, the corresponding average pre- and posttreatment sizes were 21.0 mm (range, 8.5–35.0 mm) and 15.6 mm (range, 4.1–28.9 mm), respectively.
For all 35 lesions, radiologist 1 outlined the contours of each tumor on the best slice on both the pre- and posttreatment scans using the GUI. For the 13 primary lesions, full 3D contours were also extracted by the radiologist. Radiologist 2 inspected and modified, if necessary, both the 2D and 3D contours. In the following discussion, volume and area estimates derived from this set of contours are referred to as the “reference” or the “manual” estimates with which the estimates of the automated segmentation system or radiologist 3 (see next paragraph) are compared.
To estimate the interobserver variability between radiologists in outlining 3D contours, radiologist 3, with 6 years of experience reading head and neck CT scans, independently identified the lesion locations and provided the full 3D contours for the 13 primary lesions on both the pre- and posttreatment CT scans using the GUI.
Segmentation of Head and Neck Lesions on MDCT
The feasibility of automated segmentation of head and neck lesions on CT scans was initially evaluated in a pilot study, as was reported previously [10]. The segmentation method will be summarized briefly in the following text. The method implemented by the computer segmentation system consists of three stages: preprocessing, initial segmentation, and 3D level set segmentation. The system uses as input an approximate bounding box for the lesion of interest.
In the first stage, a set of “smoothed” images and a set of gradient images are obtained by applying 3D preprocessing techniques such as smoothing by an anisotropic diffusion filter, gradient filtering, and rank transform of the gradient magnitude [10] to the original CT images.
In the second stage, a subset of pixels that are relatively close to the center of the lesion and that belong to smooth (low-gradient) areas based on attenuation, gradient, and location are automatically selected [10]. This subset of pixels is considered to be a statistical sample of the full population of pixels in the lesion, and the mean and SD of the intensity values of the subset of pixels are calculated. The preliminary lesion contour is obtained after applying a threshold and selecting the set of pixels falling within 3.0 SDs of the mean and with values greater than −400 HU. A set of 3D image-processing techniques (i.e., morphologic dilation filter, 3D flood fill algorithm, and morphologic erosion filter) subsequently applied to the contour connect nearby components and extract an initial segmentation surface [10].
In the third stage, the initial segmentation surface is propagated using a 3D level set method [10]. Four level set–based algorithms are applied sequentially to the initial contour. The first three level set–based algorithms are applied in 3D with a predefined schedule of parameters, and the last level set–based algorithm is applied in 2D to every slice of the resulting 3D segmentation to obtain the final contour. The first level set–based algorithm slightly expands and smoothes the initial contour. The second level set–based algorithm pulls the contour toward the sharp edges, but at the same time it expands slightly in regions of low gradient. The third level set–based algorithm further draws the contour toward sharp edges. The final 2D level set–based algorithm (one on each slice) refines the segmentation on each slice by running in a constrained localized mode [10].
Evaluation Methods
Three measures were used to evaluate the automatic estimates: the intraclass correlation coefficient (ICC) [16], the average errors for the automatic percentage change estimates in pre- to posttreatment volume (3D) and area (2D), and the average absolute (unsigned) errors for the automatic percentage change estimates in 3D and 2D.
The ICC was calculated between the automatic and manual estimates of changes in pre- to posttreatment lesion volume and lesion area on the best slice. The ICC was also calculated between the automatic and manual percentage change estimates in pre- to posttreatment 3D and 2D. The change and percentage change in pre- to posttreatment volume were analyzed for the 13 primary site tumors. The average errors for the automatic percentage change estimates in pre- to posttreatment volume and area were computed as the average difference between the automatic 3D (2D) estimate and the manual 3D (2D) estimate, respectively. The average absolute (unsigned) errors for the percentage change in pre- to posttreatment volume (3D) and area (2D) were calculated by averaging the absolute difference between the automatic and manual percentage change estimates in pre- to posttreatment volume (3D) and area (2D), respectively. The average absolute error is a good estimation for determining the actual deviations caused by over- and undersegmentation, which tend to be masked when the average is taken (the average error).
The statistical significance of the difference between the automatic and manual estimates was evaluated using a paired Student’s t test. In addition, agreement between the treatment response decisions (response or no response) based on the automatic and manual estimates of percentage change in pre- to posttreatment volume (3D) and area (2D) was evaluated by imposing decision thresholds. Following the method used by Ther-asse et al. [17], the decision thresholds for the percentage change in pre- to posttreatment area (2D) was chosen to be 50%, which corresponded to a volume change (3D) threshold of about 65% assuming a spherical model for the lesion.
Results
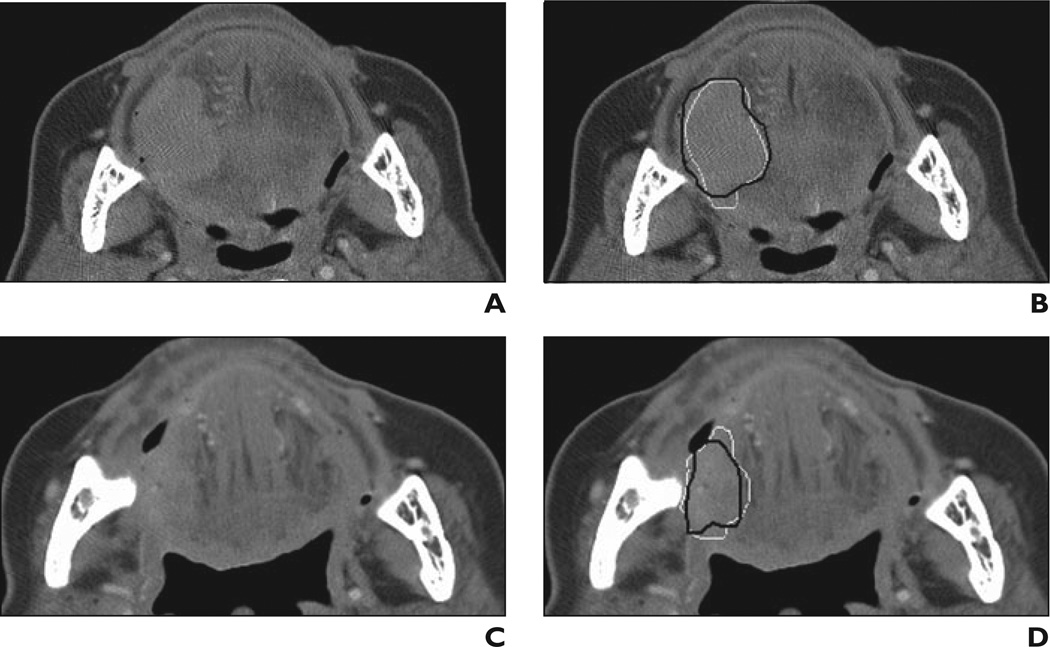
An example of the computerized 3D level set–based segmentation of a tongue base carcinoma on pre- and posttreatment CT scans is shown in Figure 1. For the 13 primary site tumors, the average pre- and posttreatment volumes were 14.6 cm3 (range, 2.1–52.5 cm3) and 5.5 cm3 (range, 0.4–28.1 cm3), respectively. The average pretreatment area (best slice) was 4.2 cm2 (range, 0.6–14.2 cm3) and the average posttreatment area was 2.1 cm2 (range, 0.1–8.7 cm3) for all 35 lesions (i.e., 13 primary site tumors and 22 metastatic lymph nodes). The estimated volumes and areas are based on the reference standard (i.e., radiologists’ manually drawn outline of tumor contours).
Fig 1. 81-year-old woman with tongue base carcinoma. This lesion is example of subtle lesion (difficulty rating = 4) in data set.
A, Axial CT scan obtained before treatment.
B, Reference standard (i.e., hand-drawn) segmentation (black contour) and automatic segmentation (white contour) are shown superimposed on pretreatment scan.
C, Axial CT scan obtained after treatment.
D, Reference standard segmentation (black contour) and automatic segmentation (white contour) are shown superimposed on posttreatment scan. Lesion is shown on best slice marked by radiologist for each scan.
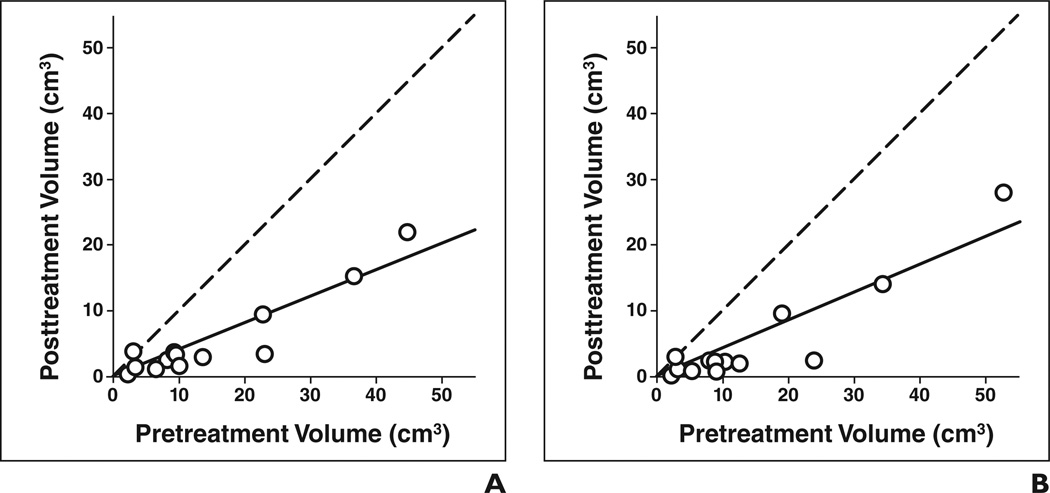
Figures 2A and 2B show the automatic and manual estimates of pre- and posttreatment volumes for the 13 primary tumors. The automatic estimates for the average pre- and posttreatment primary tumor volumes were 14.8 and 5.5 cm3, respectively (Table 1).
Fig 2. Estimates of pre- and posttreatment volume of 13 primary site tumors (○).
A and B, Tumor volume estimates based on automatic (A) and manual (B) segmentation. Dashed line shows cases in which pre- and posttreatment volumes are identical, and solid line shows linear regression line for data.
TABLE 1.
Average Volumes of 13 Primary Site Tumors Based on Automatic Segmentation Estimates and Manual Segmentation Estimates from the Reference Standard (Manual) and Radiologist 3
| Average Tumor Volume (cm3) | ||
|---|---|---|
| Estimates | Pretreatment | Posttreatment |
| Reference standard (manual) estimates | 14.6 | 5.5 |
| Automatic estimates | 14.8 | 5.5 |
| Radiologist 3’s estimates | 20.2 | 7.3 |
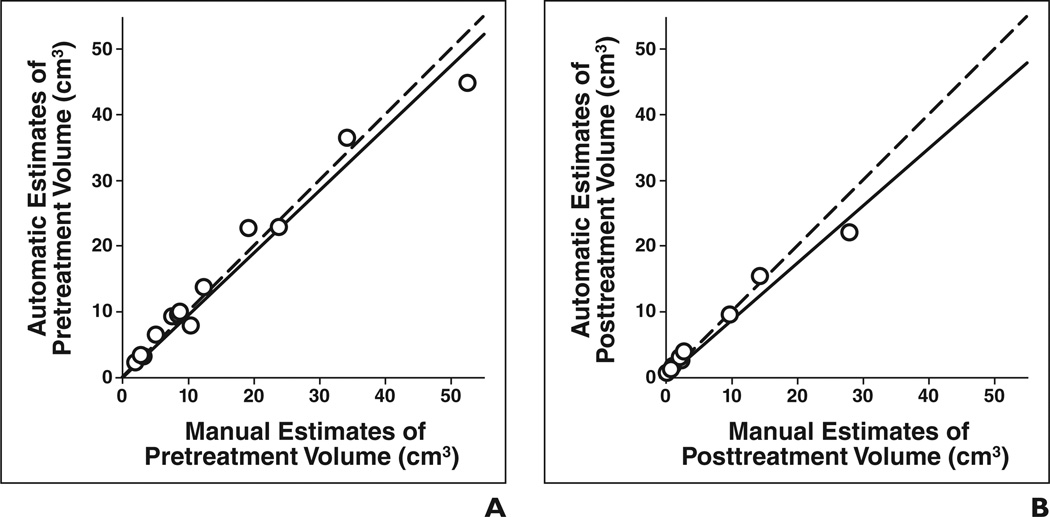
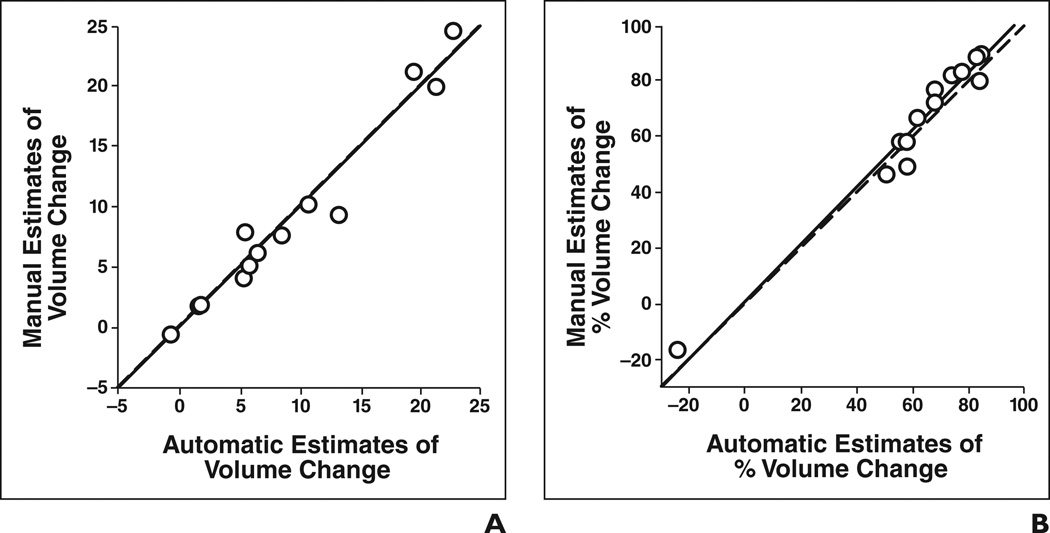
The automatic and manual estimates of pretreatment and posttreatment volumes are shown in Figures 3A and 3B, respectively. The correlations were high (ICC = 0.98 and ICC = 0.97) for both pretreatment and posttreatment volume comparisons. Figures 4A and 4B show the automatic and manual estimates for change and percentage change in pre- to posttreatment volume, respectively. In both cases, the ICC between the automatic and manual estimates reached 0.98 (Table 2). The difference between the manual and automatic estimates of pre- to posttreatment volume change and percentage change did not achieve statistical significance (p = 0.71 and p = 0.12, respectively).
Fig 3. Automatic versus manual estimates of tumor volume for 13 primary site tumors (○).
A and B, Estimates of pretreatment tumor volume (A) (intraclass correlation coefficient [ICC] = 0.98) and of posttreatment tumor volume (B) (ICC = 0.97) are shown. Dashed line shows cases in which automatic and manual estimates are identical, and solid line shows linear regression line for data.
Fig 4. Automatic versus manual estimates of change and percentage change in tumor volume for 13 primary site tumors (○).
A and B, Change in pre- to posttreatment volume (A) (intraclass correlation coefficient [ICC] = 0.98) and percentage change in pre- to posttreatment volume (B) (ICC = 0.98) are shown. Dashed line shows cases in which automatic and manual estimates are identical, and solid line shows linear regression line for data.
TABLE 2.
Intraclass Correlation Coefficient (ICC) Between Automatic Estimates, Radiologist 3’s Manual Estimates, and the Reference (Manual) Estimates
| ICC | ||
|---|---|---|
| Volume Data for 13 Primary Site Tumors |
Automatic Estimates Versus Reference (Manual) Estimates |
Radiologist 3’s Estimates Versus Reference (Manual) Estimates |
| Pretreatment volume | 0.98 | 0.90 |
| Posttreatment volume | 0.97 | 0.95 |
| Change in pre- to posttreatment volume | 0.98 | 0.83 |
| Percentage change in pre- to posttreatment volume | 0.98 | 0.96 |
Table 3 shows the average error and average absolute error of the automatic estimates of percentage change pre- to posttreatment tumor volume of the 13 primary tumors, which were −2.5% ± 5.3% and 5.1% ± 2.6%, respectively. The average errors and average absolute errors for the cancers at different locations are also shown separately in Table 3.
TABLE 3.
Average Signed Errors and Average Absolute Errors of the Automatic Estimates of Percentage Change in Pre- to Posttreatment Volume of 13 Primary Tumors
| Tumor Type | No. of Tumors | Signed Error (%) | Absolute Error (%) |
|---|---|---|---|
| Tongue cancer | 7 | −1.6 ± 6.3 | 5.4 ± 3.0 |
| Tonsil cancer | 2 | −0.2 ± 5.5 | 3.9 ± 0.3 |
| Vallecular cancer | 2 | −5.1 ± 0.2 | 5.1 ± 0.2 |
| Supraglottic cancer | 2 | −5.2 ± 4.6 | 5.2 ± 4.6 |
| Total | 13 | −2.5 ± 5.3 | 5.1 ± 2.6 |
The automatic estimates of the percentage change in pre- to posttreatment volume had similar average absolute errors for the CT scans with a slice thickness of 1.25 mm and the scans with a slice thickness of 2.5 mm. The average time to perform an automatic level set–based segmentation was 37 seconds on a PC workstation with a 3-GHz processor. In contrast, the average time for the radiologist to manually outline the full 3D contour was 385 seconds (6 minutes 42 seconds).
Volume estimates made by a third radiologist (radiologist 3) and the ICC between radiologist 3’s estimates and the reference estimates are presented in Tables 1 and 2, respectively. The difference between radiologists’ 3 estimates and the reference estimates for the change in pre- to posttreatment volume was statistically significant (p < 0.05). The difference for the percentage change in pre- to posttreatment volume did not achieve statistical significance (p = 0.48). The average error and average absolute error of radiologist 3’s estimates of the percentage change in pre- to posttreatment volume of the 13 primary tumors were 1.6% ± 7.7% and 6.2% ± 4.6%, respectively.
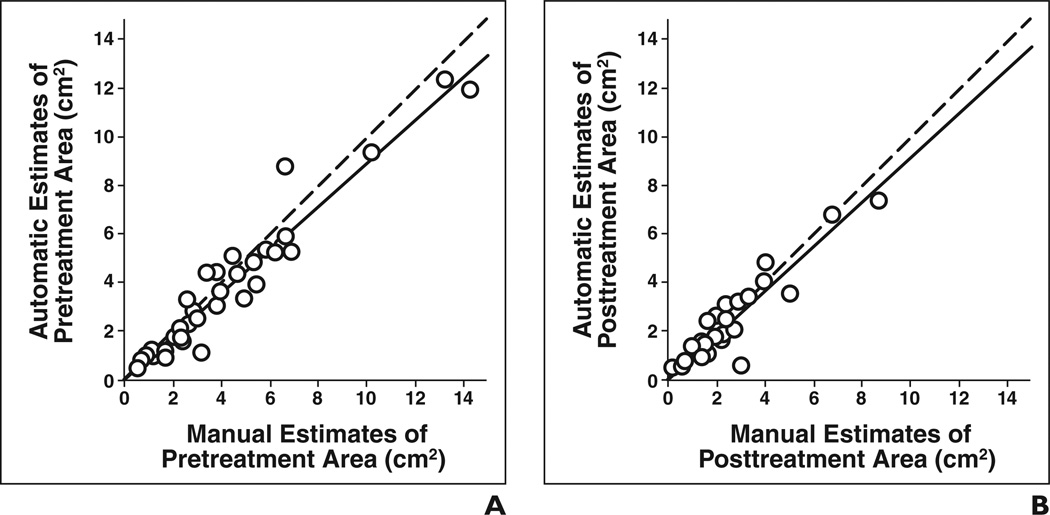
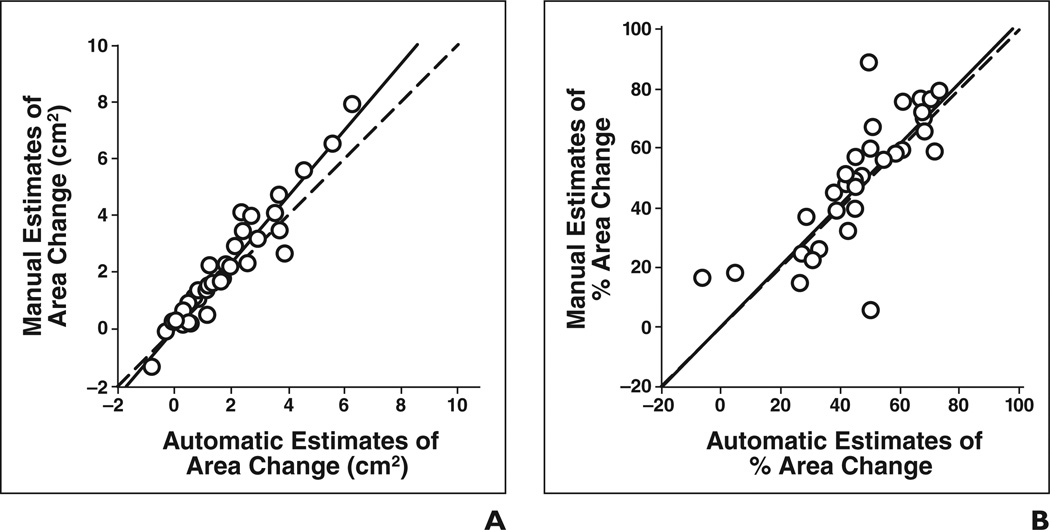
The automatic and manual estimates of both pretreatment tumor area (ICC = 0.95) and posttreatment tumor area (ICC = 0.93) for the 35 lesions showed good agreement (Table 4), as shown in Figures 5A and 5B, respectively. The ICC between the automatic and manual estimates for change in tumor area (Fig. 6A) and percentage change in tumor area (Fig. 6B) was 0.93 and 0.85, respectively. The difference between the manual and automatic estimates for the percentage change in area did not achieve statistical significance (p = 0.22). The average error in the automatic estimates of the percentage change in pre- to posttreatment area for the 35 lesions was −3.2% ± 15.3% and the average absolute error was 10.7% ± 11.3%.
TABLE 4.
Intraclass Correlation Coefficient (ICC) Between Automatic Estimates, Radiologist 3 s Manual Estimates, and the Reference (Manual) Estimates
| ICC | ||
|---|---|---|
| Area Data for 35 Lesions | Automatic Estimates Versus Reference (Manual) Estimates |
Radiologist 3’s Estimates Versus Reference (Manual) Estimates |
| Pretreatment area | 0.95 | 0.93 |
| Posttreatment area | 0.93 | 0.94 |
| Change in pre- to posttreatment area | 0.93 | 0.89 |
| Percentage change in pre- to posttreatment area | 0.85 | 0.91 |
Fig 5. Automatic versus manual estimates of tumor area for 35 lesions (○).
A and B, Estimates of pretreatment area (A) (intraclass correlation coefficient [ICC] = 0.95) and posttreatment area (B) (ICC = 0.93) are shown. Dashed line shows cases in which automatic and manual estimates are identical, and solid line shows linear regression line for data.
Fig 6. Automatic versus manual estimates of change and percentage change in tumor area for all 35 lesions (○).
A and B, Change in pre- to posttreatment area (A) (intraclass correlation coefficient [ICC] = 0.93) and percentage change in pre- to-posttreatment area (B) (ICC = 0.85) are shown. Dashed line shows cases in which automatic and manual estimates are identical, and solid line shows linear regression line for data.
The ICCs between radiologist 3’s estimates and the reference estimates for tumor area are presented in Table 4. The difference in the estimates of pre- to posttreatment area change fell short of statistical significance (p = 0.06). The difference in the estimates of percentage change in pre- to posttreatment area did not reach statistical significance (p = 0.77). The average error and average absolute error in radiologist 3’s estimates of percentage change in pre- to posttreatment area of the 35 lesion areas were −0.7% ± 13.6% and 8.3% ± 10.6%, respectively.
Comparison of Treatment Decisions Based on the Automatic and Manual Estimates of Tumor Response
Comparisons were performed between the automatic and manual treatment response decisions for both the volume and area change estimates for the 13 primary tumors. The treatment response decisions based on the automatic and manual estimates, obtained by imposing a decision threshold of 65% on the percentage change in pre- to posttreatment volume, disagreed for only one case. For that case, the percentage change in pre- to post- treatment volume was 62% by the automatic estimate and 66% by the manual estimate. The treatment response decisions based on the automatic and manual estimates, obtained by imposing a decision threshold of 50% on the percentage change in pre- to posttreatment area, disagreed also for only one case. For that case, the percentage change in pre-to posttreatment area was 49% by the automatic estimate and 59% by the manual estimate. The treatment response decisions based on the reference manual 3D estimates disagreed with the treatment response decisions based on the reference manual 2D estimates for four cases.
Discussion
Our results suggest that the automated segmentation system used in our study shows promising performance by providing reasonable segmentation of head and neck tumors including some lesions that radiologists estimated visually to be most difficult to assess. For example, most of the boundaries between the subtle lesion shown in Figure 1 (difficulty rating of 4) and the adjacent normal tissues have very low contrast, especially on the posttreatment scan. However, the preprocessing in combination with the level set method was able to find reasonable boundaries in this case on both the pre- and the posttreatment scans as compared with the manual outlines.
The primary tumors in the data set were of four different types. The tumors’ shapes varied greatly depending on their locations because of the complicated anatomic structures in the head and neck regions. The level set segmentation–based automatic estimates of the percentage change in pre- to posttreatment volume had similar average absolute errors for the different types of lesions, showing robust performance for the different tumor shapes.
The difference between radiologist 3’s estimates and the reference manual estimates for the percentage change in pre- to posttreatment volume and area was comparable to the difference between the automatic estimates and reference manual estimates, indicating that the disagreement between the automatic and manual estimates is comparable to interobserver variability in the radiologists’ estimates. In addition, the volume estimates of radiologist 3 were consistently slightly greater than the reference manual estimates for both the pre- and posttreatment scans. Because the volume estimates were larger on both the pre- and posttreatment scans, the obtained percentage changes in pre- to posttreatment volume and area were comparable to the reference manual estimates. However, in clinical practice, if the pre- and posttreatment volumes (or areas) are not always estimated by the same radiologist, the variability in the volume change estimates may be greater. The computerized segmentation system, on the other hand, will perform consistently on both the pre- and the posttreatment scans, and the resulting automatic estimates of the percentage change will also be more consistent.
The comparison of the treatment response decisions based on the automatic and manual estimates showed good agreement both for the volume (3D)-based estimates and the area (2D)- based estimates. The larger disagreement between treatment response decisions based on the reference manual 3D estimates and the decisions based on the reference manual 2D estimates showed that the spherical model, on which the treatment response decision threshold of 65% by volume is based [17], may not be sufficiently accurate when it is applied to irregular-shaped tumors, such as head and neck tumors.
There was good agreement between the automatic estimates and reference manual estimates for the primary tumors in this study, which were stage III or IV. For smaller tumors, it is possible that agreement would not be as good because of partial volume effect and the stronger influence of the low contrast between the tumor and the surrounding tissue on segmentation. However, for the nonsurgical organ preservation therapy clinical trial in our institution, the current protocol was designed for patients with primary tumors of stage III or IV so the automated and manual estimates were steered in that direction. The performance of our segmentation algorithm on smaller or more subtle lesions will be evaluated in future studies.
The presence of dental hardware artifacts on CT images can be a challenging problem for both automated and manual segmentation of head and neck lesions. In our database, images of two patients showed dental hardware artifacts to some extent near the lesion periphery. Neither the automated estimates nor the manual estimates were influenced strongly in these two cases. The automated segmentation system was able to compensate for the streaking artifacts and to keep the contour relatively smooth. However, in cases in which the dental hardware artifacts involve the middle of the lesion, the automated segmentation system will likely be misled by the artifact edges. This problem will be investigated in future work.
There are limitations in this preliminary study. The data set is relatively small, which potentially may introduce bias. Although the relatively robust performance of the automatic segmentation for the different types of primary tumors indicates that the effect of such a bias may not be substantial, a larger data set with different types of lesions is necessary to further confirm its generalizability. In a future study, the data set will be enlarged and the potential bias will be studied. In addition, full 3D manual outlines for the metastatic lymph nodes will be useful for volume-based analysis of the automatic segmentation and response to treatment of lymph nodes. Although the metastatic lymph nodes generally are more regular in shape than primary tumors, the accuracy of automatic 3D segmentation of these lymph nodes should be analyzed when the full 3D outlines can be collected. In this preliminary study, we obtained the reference standard estimates by having radiologist 1 provide manual outlines of the lesions and radiologist 2 confirm the outlines. Interobserver variability was estimated using independent segmentation estimates provided by radiologist 3. To further study the inter- and intraobserver variabilities in manual segmentation of head and neck tumors, it will be necessary to obtain independent segmentation by several radiologists and also repeated segmentation by individual radiologists. We will investigate the effects of these variabilities on the validation of our computer segmentation system and the assessment of volume change and treatment response in future studies.
The ability to automate tumor segmentation and obtain tumor volume measurements of both the primary site tumor and lymph nodes could substantially impact the treatment and management of patients with head and neck squamous cell carcinoma. Numerous studies have shown that the GTV of the primary site tumor calculated from pretreatment CT can predict local control in squamous cell carcinoma arising in different subsites in the head and neck in patients treated with definitive radiation therapy [4–8, 18–22]. Large-volume tumors have a higher likelihood of local recurrence than small-volume lesions arising in the same anatomic subsite [4–8, 18–22]. Threshold volumes have been identified in nasopharyngeal, oropharyngeal, supraglottic, pyriform sinus, and T3 glottic carcinomas [4–8, 18–22]. Several investigators have also shown that there is a stronger association between GTV and local control than is present between tumor stage and local control [5, 18]. This additional information helps physicians better counsel patients about the relative likelihood of local tumor control with primary surgical or radiation treatment with or without chemotherapy. Despite this compelling information, GTV is not routinely measured because of the time and effort required to make these calculations. The ability to perform automated segmentation would enable the prognostic information of tumor volume measurements to be integrated into the routine management of patients with head and neck squamous cell carcinoma.
In conclusion, our preliminary results indicate that the computerized segmentation system used in this study can produce reliable segmentation in 3D for a variety of head and neck tumors. The correlation between automatic and manual estimates of both change and percentage change in pre- to posttreatment volume was high. This preliminary study suggests that this computerized segmentation system may be useful for estimating change in tumor size in response to nonsurgical organ preservation therapy relative to a radiologist’s manual segmentation.
Acknowledgments
This work was supported in part by a grant from the U.S. Public Health Service (grant CA95153).
References
- 1.American Cancer Society. Cancer facts & figures 2007. Atlanta, GA: American Cancer Society; 2007. [Google Scholar]
- 2.Induction chemotherapy plus radiation compared with surgery plus radiation in patients with advanced laryngeal cancer. The Department of Veterans Affairs Laryngeal Cancer Study Group. N Engl J Med. 1991;324:1685–1690. doi: 10.1056/NEJM199106133242402. [No authors listed]. [DOI] [PubMed] [Google Scholar]
- 3.Lefebvre JL, Chevalier D, Luboinski B, Kirkpatrick A, Collette L, Sahmoud T. Larynx preservation in pyriform sinus cancer: preliminary results of a European organization for research and treatment of cancer phase III trial. J Natl Cancer Inst. 1996;88:890–899. doi: 10.1093/jnci/88.13.890. [DOI] [PubMed] [Google Scholar]
- 4.Mancuso AA, Mukherji SK, Schmalfuss I, et al. Preradiotherapy computed tomography as a predictor of local control in supraglottic carcinoma. J Clin Oncol. 1999;17:631–637. doi: 10.1200/JCO.1999.17.2.631. [DOI] [PubMed] [Google Scholar]
- 5.Chua DT, Sharn JS, Kwong DL, et al. Volumetric analysis of tumor extent in nasopharyngeal carcinoma and correlation with treatment outcome. Int J Radiat Oncol Biol Phys. 1997;39:711–719. doi: 10.1016/s0360-3016(97)00374-x. [DOI] [PubMed] [Google Scholar]
- 6.Johnson CR, Thames HD, Huang DT, Schmidt-Ullrich RK. The tumor volume and clonogen number relationship: tumor control predictions based upon tumor volume estimates derived from computed tomography. Int J Radiat Oncol Biol Phys. 1995;33:281–287. doi: 10.1016/0360-3016(95)00119-j. [DOI] [PubMed] [Google Scholar]
- 7.Freeman DE, Mancuso AA, Parsons JT, Mendenhall WM, Million RR. Irradiation alone for supraglottic larynx carcinoma: can CT findings predict treatment results? Int J Radiat Oncol Biol Phys. 1990;19:485–490. doi: 10.1016/0360-3016(90)90562-x. [DOI] [PubMed] [Google Scholar]
- 8.Gilbert RW, Birt D, Shulman H, et al. Correlation of tumor volume with local control in laryngeal carcinoma treated by radiotherapy. Ann Otol Rhinol Laryngol. 1987;96:514–518. doi: 10.1177/000348948709600507. [DOI] [PubMed] [Google Scholar]
- 9.Mukherji SK, Toledano AY, Beldon C, et al. Inter-observer reliability of computed tomography–derived primary tumor volume measurement in patients with supraglottic carcinoma. Cancer. 2005;103:2616–2622. doi: 10.1002/cncr.21072. [DOI] [PubMed] [Google Scholar]
- 10.Street E, Hadjiiski L, Sahiner B, et al. Automated volume analysis of head and neck lesions on CT scans using 3D level set segmentation. Med Phys. 2007;34:4399–4408. doi: 10.1118/1.2794174. [DOI] [PMC free article] [PubMed] [Google Scholar]
- 11.Chong VF, Zhou JY, Khoo JB, Huang J, Lim TK. Nasopharyngeal carcinoma tumor volume measurement. Radiology. 2004;231:914–921. doi: 10.1148/radiol.2313030358. [DOI] [PubMed] [Google Scholar]
- 12.Lee FK, Yeung DK, King AD, Leung SF, Ahuja A. Segmentation of nasopharyngeal carcinoma (NPC) lesions in MR images. Int J Radiat Oncol. 2005;61:608–620. doi: 10.1016/j.ijrobp.2004.09.024. [DOI] [PubMed] [Google Scholar]
- 13.Dornheim J, Seim H, Preim B, Hertel I, Strauss G. Segmentation of neck lymph nodes in CT datasets with stable 3D mass-spring models: segmentation of neck lymph nodes. Acad Radiol. 2007;14:1389–1399. doi: 10.1016/j.acra.2007.09.001. [DOI] [PubMed] [Google Scholar]
- 14.Gorthi S, Duay V, Houhou N, et al. Segmentation of head and neck lymph node regions for radiotherapy planning using active contour-based atlas registration. IEEE J-STSP. 2009;3:135–147. [Google Scholar]
- 15.Schinagl DA, Vogel WV, Hoffmann AL, van Dalen JA, Oyen WJ, Kaanders JH. Comparison of five segmentation tools for 18F-fluoro-deoxy-glucose- positron emission tomography–based target volume definition in head and neck cancer. Int J Radiat Oncol Biol Phys. 2007;69:1282–1289. doi: 10.1016/j.ijrobp.2007.07.2333. [DOI] [PubMed] [Google Scholar]
- 16.Shrout PE, Fleiss JL. Intraclass correlations: uses in assessing rater reliability. Psychol Bull. 1979;86:420–428. doi: 10.1037//0033-2909.86.2.420. [DOI] [PubMed] [Google Scholar]
- 17.Therasse P, Arbuck SG, Eisenhauer EA, et al. New guidelines to evaluate the response to treatment in solid tumors. J Natl Cancer Inst. 2000;92:205–216. doi: 10.1093/jnci/92.3.205. [DOI] [PubMed] [Google Scholar]
- 18.Hermans R, Van den Bogaert W, Rijnders A, Baert AL. Value of computed tomography as outcome predictor of supraglottic squamous cell carcinoma treated by definitive radiation therapy. Int J Radiat Oncol Biol Phys. 1999;44:755–765. doi: 10.1016/s0360-3016(99)00039-5. [DOI] [PubMed] [Google Scholar]
- 19.Lee WR, Mancuso AA, Saleh EM, Mendenhall WM, Parsons JT, Million RR. Can pretreatment computed tomography findings predict local control in T3 squamous cell carcinoma of the glottic larynx treated with radiotherapy alone? Int J Radiat Oncol Biol Phys. 1993;25:683–687. doi: 10.1016/0360-3016(93)90016-o. [DOI] [PubMed] [Google Scholar]
- 20.Mukherji SK, O’Brien SM, Gerstle RJ, Weissler M, Shockley W, Castillo M. Tumor volume: an independent predictor of outcome for laryngeal cancer. J Comput Assist Tomogr. 1999;23:50–54. doi: 10.1097/00004728-199901000-00011. [DOI] [PubMed] [Google Scholar]
- 21.Hermans R, Van den Bogaert W, Rijnders A, Doornaert P, Baert AL. Predicting the local outcome of glottic squamous cell carcinoma after definitive radiation therapy: value of computed tomography–determined tumour parameters. Radiother Oncol. 1999;50:39–46. doi: 10.1016/s0167-8140(98)00114-5. [DOI] [PubMed] [Google Scholar]
- 22.Mukherji SK, O’Brien SM, Gerstle RJ, et al. The ability of tumor volume to predict local control in surgically treated squamous cell carcinoma of the supraglottic larynx. Head Neck. 2000;22:282–287. doi: 10.1002/(sici)1097-0347(200005)22:3<282::aid-hed11>3.0.co;2-k. [DOI] [PubMed] [Google Scholar]


