Abstract
Protein–protein interactions (PPIs) are central to biological processes and represent an important class of therapeutic targets. Here we show that the interaction between FK506 binding protein 12 fused to green fluorescent protein (GFP-FKBP) and the rapamycin-binding domain of mTor fused to Escherichia coli dihydrofolate reductase (FRB-eDHFR) can be sensitively detected (signal-to-background (S:B) >100) and accurately quantified within an impure cell lysate matrix using a luminescence resonance energy transfer (LRET) assay. Ascomycin-mediated inhibition of GFP-FKBP/rapamycin/FRB-eDHFR complex formation was also detected at high S:B (>80) and Z’-factor (0.89). The method leverages the selective, stable binding of trimethoprim (TMP)-terbium complex conjugates to eDHFR, and time-resolved, background-free detection of the long-lifetime (~ms) terbium-to-GFP LRET signal that indicates target binding. TMP/eDHFR labeling can be adapted to develop high-throughput screening assays and complementary, quantitative counter-screens for a wide variety of PPI targets with a broad range of affinities that may not be amenable to purification.
Keywords: FRET, high-throughput screening, Lanthanoids, Luminescence, Protein-Protein Interactions
Introduction
Most biological processes are regulated by protein-protein interactions (PPIs). Consequently, bioanalytical methods that can identify and quantify PPIs are critical tools for fundamental biochemistry and proteomics research.[1] Furthermore, compromised interactions as well as interactions between host and pathogen proteins can play a role in disease progression, and high throughput screening (HTS) assays that can identify PPI inhibitors are therefore an important drug discovery tool.[2] Common methods for identifying PPIs include yeast two-hybrid, tandem affinity purification/mass spectrometry and co-immunoprecipitation.[3] A variety of medium- and high-throughput methods can be used to screen for inhibitors or antagonists of PPI in purified biochemical preparations or even in cells including protein fragment complementation assays,[4] fluorescent protein translocation,[5] and methods based on Förster Resonance Energy Transfer (FRET) or fluorescence polarization (FP) that interrogate reporter-labeled proteins.[6] However, methods that offer the sensitivity and throughput necessary for HTS do not typically also allow for accurate measurement of equilibrium dissociation or inhibition constants. For example, while conventional FRET or FP methods are excellent for quantitative interaction analyses, their use in HTS can be problematic because they are susceptible to interference from non-specific fluorescence background signals.[7] Therefore, quantitative PPI affinity or inhibition measurements often require alternative analyses such as classical radioligand binding, surface plasmon resonance or isothermal titration calorimetry.[8] These methods require highly pure samples which of course precludes their use for many proteins.
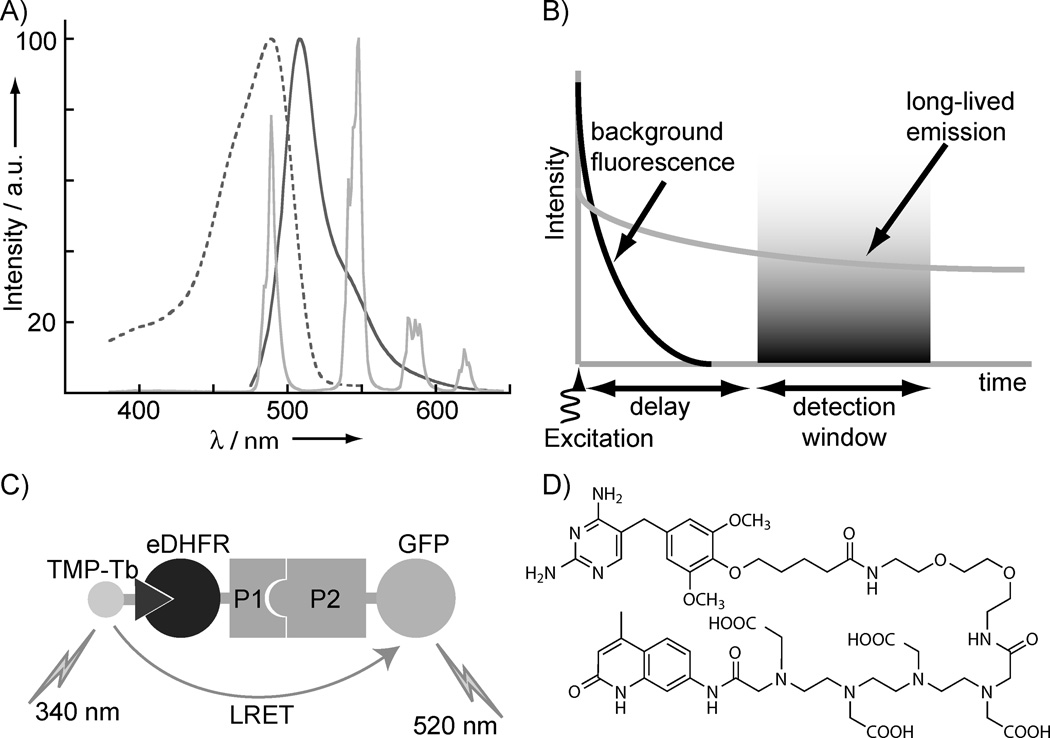
Homogeneous, time-resolved FRET (TR-FRET, also known as luminescence resonance energy transfer, or LRET) assays with lanthanide complex donors are characterized by low detection limits (sub-picomolar), high signal-to-background ratio (S:B, >50) and large statistical effect size (Z’-factor >0.7).[9] These attributes result from the photophysical properties of lanthanide cations such as Tb3+ or Eu3+ that include long-lived (~ms) luminescence and narrow, spiked emission spectra (<10 nm at half-maximum, Figure 1a). LRET assays detect the interaction of a lanthanide-labeled target that is bound to another target labeled with a short-lifetime (~ns), fluorescent acceptor. Excitation of the lanthanide in its absorption band yields long-lifetime, LRET-sensitized emission of the nearby acceptor at its characteristic wavelength.[9b] Sensitized emission can be temporally discriminated from short-lived sample autofluorescence and directly excited acceptor fluorescence background using time-resolved detection, where a short pulse of light excites the sample, and the detector is turned on after a brief delay of at least 100 ns (Figure 1b). The sensitivity and robustness of LRET has enabled high-throughput screening for antagonists/inhibitors of many targets including g-protein coupled receptors (GPCRs), kinases, ubiquitin, and protein-protein/peptide/DNA interactions.[9c] In LRET screens, targets are most commonly labeled with primary or secondary antibodies that are conjugated to terbium or europium complexes and appropriate receptor fluorophores,[9c] although SNAP-Tag labeling has recently been used to label GPCR’s on cell surfaces.[10] However, generating specific antibodies is time-consuming. Moreover, it is generally not possible to obtain accurate affinity measurements with antibody-based LRET assays because the concentration of detection antibodies is limiting and this precludes collection of saturation binding data.[11] Our goal was to develop a homogeneous, “mix-and-read” LRET assay for PPIs and their inhibition that was sensitive enough for HTS, easily adaptable to a wide variety of targets, relatively insensitive to sample purity and capable of quantitative measurements of dissociation or inhibition constants.
Figure 1.
Key aspects of Luminescence Resonance Energy Transfer (LRET) assays to detect and quantify protein-protein interactions (PPI). (a) The emission spectrum of Tb3+ (light gray, solid) overlaps with the excitation spectrum (dark gray, dotted) of green fluorescent protein (GFP). The narrow, spiked Tb3+ emission facilitates separation of Tb3+ donor and LRET-sensitized, GFP acceptor (dark gray, solid) emission signals. (b) Long-lived (~ms) Tb3+ donor or Tb3+-sensitized acceptor emission can be detected without interference from scattering, autofluorescence or directly excited acceptor fluorescence background in time-resolved mode, where a 10–100 µs delay is inserted between pulsed excitation and detection. (c) Schematic representation of LRET PPI assay mediated by trimethoprim (TMP)/E. coli dihydrofolate reductase (eDHFR) interaction. A TMP-Tb3+ complex conjugate binds specifically and tightly to eDHFR (KD = ~2 nM). Interaction between eDHFR and GFP fusion proteins and excitation of TMP-Tb (the donor) results in LRET-sensitized emission of GFP (the acceptor). (d) Structure of TMP-TTHA-cs124, the Tb3+ complex of which is used in these studies.
The assay we report here measures interaction between two fusion proteins; one labeled with a luminescent Tb3+ complex and the other fused to green fluorescent protein (GFP). We have previously shown that conjugates of trimethoprim (TMP) linked to Tb3+ complexes bind selectively and with high affinity to Escherichia coli dihydrofolate reductase (eDHFR) in purified preparations, cell lysates and in living cells, thereby offering an effective means of selectively labeling fusion proteins with Tb3+ luminophores.[12] Thus, in a mixture containing eDHFR and GFP fusions and a TMP-linked Tb3+ reporter, we may expect to detect interaction between the two proteins as Tb3+-sensitized, GFP emission from a complex that includes all three components (Figure 1c). Illumination with ~340 nm light excites the Tb3+ reporter, leading to LRET-sensitized emission of GFP at 520 nm. The sensitized GFP emission can be easily filtered from terbium donor emission (Figure 1a), and time-resolved detection eliminates directly excited GFP fluorescence and non-specific fluorescence from samples or library components (Figure 1b). Here, we used TMP-TTHA-cs124 (Figure 1d) as the luminescent Tb3+ label due to its high affinity for eDHFR (KD = ~ 2 nM), good brightness (ε = ~10,000 M−1cm−1 at 343 nm, quantum yield in water = 0.20), and relatively high metal-binding stability compared to other chelates.[12c]
Results and Discussion
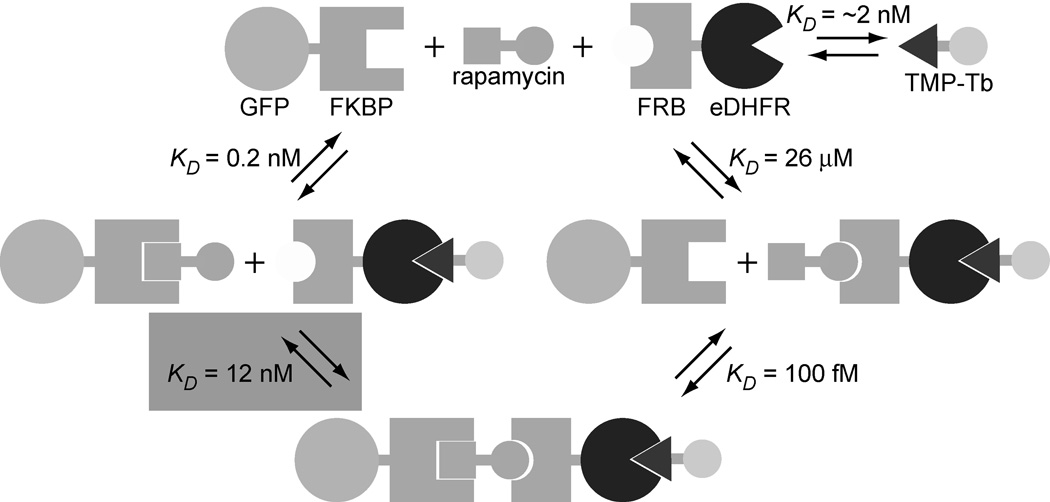
In order to demonstrate the sensitivity, accuracy and precision of our assay for detecting and quantifying PPIs and their inhibition, we selected the well studied, rapamycin-induced interaction between FK506 binding protein 12 (FKBP) and the rapamycin binding domain of mTor (FRB) as a model system. Rapamycin-induced heterodimerization of FKBP and FRB fusion proteins has been exploited extensively to regulate protein expression,[13] glycosylation,[14] and for other biotechnological applications.[15] Wandless and coworkers thoroughly characterized the equilibrium binding affinities involved in the formation of the FKBP/rapamycin/FRB complex using fluorescence polarization, surface plasmon resonance, and NMR spectroscopy.[16] Given the relative magnitudes of the dissociation constants, we designed our LRET binding assay to measure the affinity between the FKBP-rapamycin complex and FRB (KD = 12 nm, Figure 2). Here, we show that formation of a GFP-FKBP/rapamycin/FRB-eDHFR/TMP-TTHA-cs124(Tb3+) complex can be sensitively monitored by detecting long-lifetime (>100 us), Tb3+-to-GFP LRET in 96-well plates using a time-resolved luminescence plate reader. By titrating either GFP-FKBP or FRB-eDHFR while holding all other components of the system at constant concentrations, we were able to generate binding isotherms. As we detail below, appropriate correction of the measured LRET signal and non-linear least squares (NLS) analysis of the data allowed for accurate and reproducible measurement of the affinity of GFP-FKBP/rapamycin for FRB-eDHFR in both buffer solution and bacterial lysates.
Figure 2.
Schematic diagram representing the binding events involved in the formation of a GFP-FKBP/rapamycin/FRB-eDHFR/TMP-Tb complex. The relative magnitudes of the dissociation constants (ref. 21) are such that it is the interaction between GFP-FKBP/rapamycin and FRB-eDHFR (KD = 12 nM, shaded) that is measured in a saturation binding assay. By maintaining a constant ratio of FRB-eDHFR relative to TMP-Tb, it is possible to titrate either GFP-FKBP or FRB-eDHFR, and the measured Tb3+-to-GFP LRET signal reflects formation of the FKBP/rapamycin/FRB complex.
We first performed affinity measurements in a buffer solution containing purified chimeric proteins, GFP-FKBP and FRB-eDHFR. First, we titrated GFP-FKBP in 96-well plates (3 µM to 0.4 pM in 100 µL of assay buffer) while holding other component concentrations constant, including FRB-eDHFR (10 nM), TMP-TTHA-cs124(Tb3+) (10 nM) and NADPH (cofactor necessary for tight TMP/eDHFR binding, 1 µM). Sufficient amounts of rapamycin were added to all wells to pre-form the GFP-FKBP/rapamycin complex. Sample titrations were prepared in triplicate (3 sets of 24 wells each), and a single set of negative control wells were prepared that contained identical concentration range of GFP-FKBP but lacked FRB-eDHFR and rapamycin (see Supporting Information for complete details of sample preparation). The sample plate was maintained at room temperature and analyzed at 10 min. intervals over 2 h by measuring the time-resolved luminescence signal (λex = 340 nm, delay = 100 µs) at 520 nm (LRET-sensitized, acceptor emission) and at 615 nm (Tb3+ donor emission). The 520/615 emission ratio was calculated to minimize well-to-well variability resulting from differences in probe amounts or sample absorbance.[9a] We observed a non-specific signal at 520 nm that increased with GFP-FKBP concentration (Supporting Figure S1), and we attribute this to diffusion-mediated LRET between TMP-TTHA-cs124(Tb3+) and GFP. Therefore, we subtracted the 520/615 emission ratio observed in the corresponding negative control from that observed in the sample well at a given GFP-FKBP concentration to obtain the LRET signal attributable to formation of the GFP-FKBP/rapamycin/FRB-eDHFR/TMP-TTHA-cs124(Tb3+) complex. We then calculated the percent change in the 520/615 emission ratio, ΔL%, as
| (1) |
where, and are the emission ratios for the sample and negative control wells at a given GFP-FKBP concentration, respectively, and is the mean emission ratio for the 12 control wells containing the lowest concentrations of GFP-FKBP.
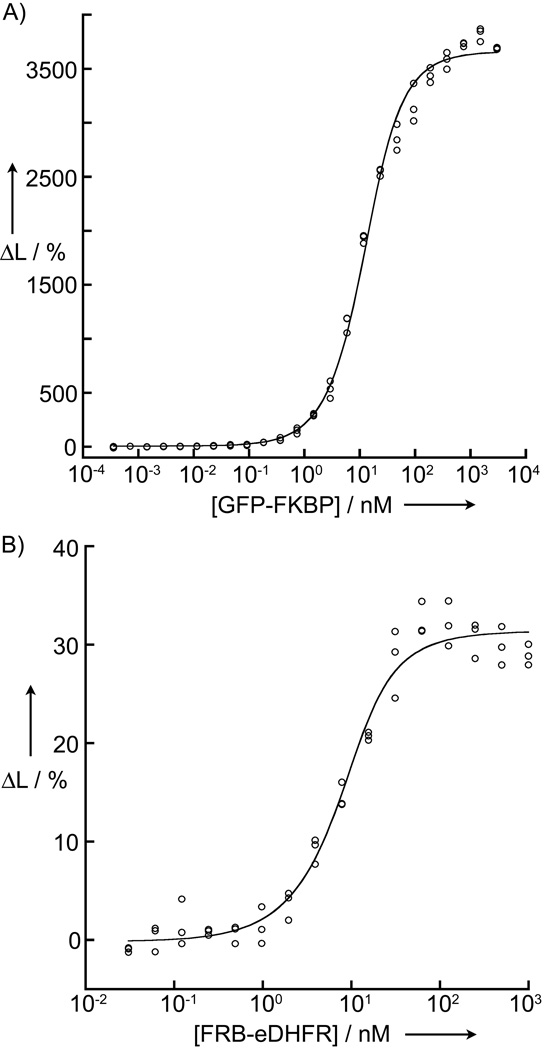
In order to obtain a binding isotherm, we plotted ΔL% as a function of GFP-FKBP concentration for each time point analyzed. The system appeared to equilibrate after ~80 min., as evidenced by stabilization of the observed data plots (Supporting Figure S2). Shown in Figure 3a is the binding isotherm obtained at 120 min. We applied a NLS fit to this data using the following equation to obtain the KD for binding of the GFP-FKBP/rapamycin complex to FRB-eDHFR:
| (2) |
where, Lmin is the ΔL% value observed for of the lowest concentration GFP-FKBP sample, Lmax is the maximum ΔL% signal observed at saturating GFP-FKBP concentration, [P1]T is the concentration of the fixed protein (FRB-eDHFR, in this case) and [P2]T is the concentration of titrated protein (GFP-FKBP). This analysis yielded a KD of 7.5 ± 0.4 nM. The value we measured with our assay differs somewhat from that reported by Wandless and coworkers (12 nM).[16] That study used surface plasmon resonance to analyze binding of FRB to immobilized FKBP/rapamycin, and this may account for the differences in observed affinities. Furthermore, in that same paper, the authors reported an estimated, solution-phase KD of 6.2 nM for FKBP/rapamycin/FRB interaction based on a fluorescence polarization competition assay, close to our measured value. Moreover, we observed >350 S:B for the LRET signal, suggesting this assay platform would be easily adapted for HTS conditions.
Figure 3.
Homogeneous, time-resolved LRET assay detects and measures PPI affinity and inhibition at high signal-to-background ratio. Plots show the outcome of saturation binding experiments in 96-well plates (100 µL sample volume). The y-axes represent the percent change in the 520 nm/615 nm emission ratio and the x-axes represent concentrations of the titrated analytes. Complete details of sample preparation and data analysis are given in the text and Supporting Information. (a) Data showing equilibrium binding (120 min. after sample preparation) of purified GFP-FKBP/rapamycin complex (3 uM to 0.4 pM) to purified FRB-eDHFR (10 nM). Line represents non-linear least squares (NLS) fit to equation 2, yielding KD = 7.5 ± 0.4 nM. (b) Data from titration of purified FRB-eDHFR (1 uM to 30 pM) against purified GFP-FKBP/rapamycin complex (10 nM) obtained 45 min. after sample preparation. NLS fit to equation 2 yielded KD = 3.3 ± 0.6 nM.
We next sought to determine whether the titration could be reversed; holding GFP-FKBP levels constant while varying FRB-eDHFR concentration. We attempted this in order to demonstrate the versatility of the assay and also to eliminate the varying levels of diffusion-mediated Tb3+-to-GFP FRET seen when GFP-FKBP acceptor concentration was varied over a broad range. Here, it was necessary to ensure that the FRB-eDHFR/TMP-TTHA-cs124(Tb3+) concentration remained consistent throughout the titration while minimizing the overall Tb3+ luminescence signal. This was accomplished by pre-equilibrating TMP-TTHA-cs124 with a sub-stoichiometric (0.1 equivalents) amount of Tb3+ and maintaining a relatively high concentration (1 µM) of the TMP conjugate in all sample wells. 96-well plates were prepared such that GFP-FKBP concentration remained constant (10 nM), FRB-eDHFR concentration varied (from 1 µM to ~30 pM), and GFP-FKBP/rapamycin and FRB-eDHFR/TMP-TTHA-cs124 binding were saturated in all wells (Supporting Information). The plate was then analyzed periodically up to 1 h, and the percent change in 520/615 emission ratio at each time point was calculated as:
| (3) |
where is the emission ratios for the sample well at a given FRB-eDHFR concentration, and is the mean emission ratio for multiple control wells (9, in this case) lacking FRB-eDHFR and rapamycin. The signal change was then plotted against FRB-eDHFR concentration to obtain binding isotherms.
In this case, the signal level equilibrated after ~30 min (Supporting Figure S3), and the data obtained 45 min. after sample preparation is shown in Figure 3b. Here, we observed a substantially lower signal change (~30%) compared to that seen when GFP-FKBP was titrated for two reasons: 1) the concentration of signal-generating, GFP-FKBP/rapamycin/FRB-eDHFR/TMP-TTHA-cs124(Tb3+) complex is very low at saturation (only ~1 nM); and 2) there was a consistently high level of background signal observed at 520 nm reflecting the relatively high concentration (100 nM) of luminescent Tb3+ complex present in all wells (Supporting Figure S1). Despite the lower signal, the data could be fit non-linearly (equation 2) to yield an apparent KD of 3.3 ± 0.6 nM. That this value is ~2-fold lower than that calculated from GFP-FKBP titrations may reflect the relative noisiness of the data. Nevertheless, the results suggest that the assay can be modified to obtain reasonably accurate KD estimates across a broad range of experimental conditions and binding affinities (Supporting Figure S4).
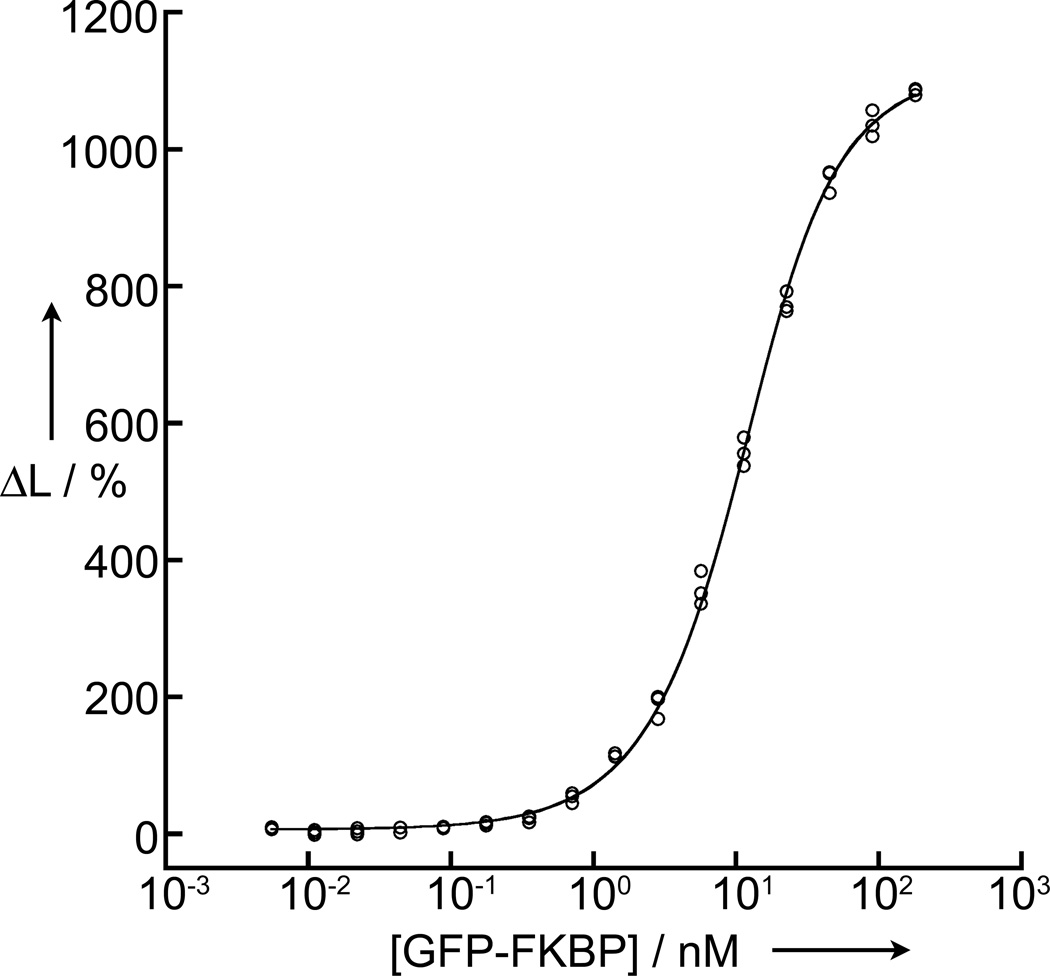
Because many proteins cannot be purified, we sought to determine whether our assay could be used to measure binding affinities in cell lysates where only one of the interacting partners was first subject to purification. Here, we expressed GFP-FKBP in E. coli and titrated bacterial lysates containing the fusion protein against a constant concentration of purified FRB-eDHFR. We determined the concentration of GFP-FKBP in the lysate from absorbance measurements and calculation using the known extinction coefficient of EGFP (ε488 nm = 57,500 M−1cm−1).[17] Sample plates were prepared such that GFP-FKBP concentration varied (between 3 µM and 0.4 pM), and a constant level of lysate was maintained in all wells (14 mg/mL as total protein concentration) so as to maintain a consistent environment (Supporting Information). Despite our efforts to maintain well-to-well homogeneity, our plate preparation resulted in substantially lower levels of assay buffer in the highest and lowest ends of the titration range. The assay buffer contains bovine serum albumin and Tween-80 to minimize non-specific binding of TMP-TTHA-cs124(Tb3+) to sample wells and resultant sequestration out of the excitation light path. The inhomogeneity of the samples resulted in a substantial reduction of Tb3+ luminescence at the extreme ends of the titration range and this necessarily affected the measured LRET signal (Supporting Figure S5). Nevertheless, by excluding the data points at either end of the titration, we were able to non-linearly fit the data (equation 2) to obtain a KD of 6.5 ± 0.2 nM, very close to the value seen with purified proteins in assay buffer (Figure 4). These results show that interactions between GFP and eDHFR fusion proteins can be sensitively detected (S:B >100) and quantified in complex matrices even when one of the binding partners is not first purified.
Figure 4.
Data showing equilibrium binding (130 min.) of impure GFP-FKBP/rapamycin complex (181 nM to 6 pM) to purified FRB-eDHFR (10 nM) in E. coli lysates. The y-axes represent the percent change in the 520 nm/615 nm emission ratio and the x-axes represent concentration of the titrated GFP-FKBP. NLS fit to equation 2 yielded KD = 6.5 ± 0.2 nM.
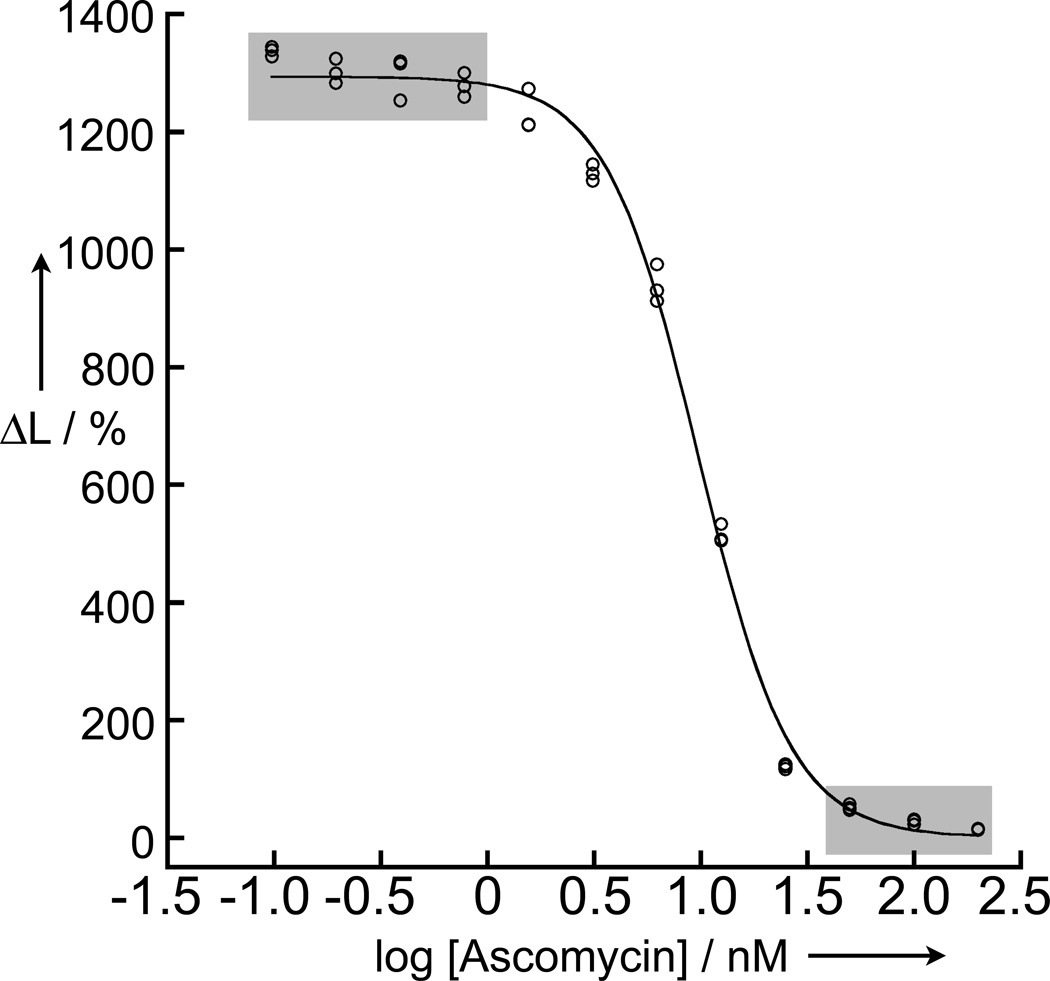
Since many HTS assays are used to identify inhibitors of a given interaction, we performed a competitive inhibition assay using ascomycin which competes with rapamycin for binding to FKBP. The FKPB/ascomycin complex does not bind to FRB.[18] We titrated ascomycin against constant concentrations of rapamycin, GFP-FKBP and FRB-eDHFR (Supporting Information). We plotted the concentration of ascomycin against ΔL% (equation 3) and fitted the data using NLS regression to the following equation:
| (4) |
where, Lmin and Lmax are the minimum and maximum observed ΔL% values, respectively, [I]T is the ascomycin concentration, and HillSlope is the slope of the steep portion of the curve between 10% and 90% signals. From this fit, a value of IC50 = 9.8±0.3 nM was obtained (Figure 5). As was seen for direct measurements of affinity, we observed a high S:B (>80) between maximum and minimum signals. For HTS assays, one common measure of assay performance is Z’-factor:
| (5) |
calculated from the standard deviations and means of the maximum and minimum observed signal levels under controlled conditions (i.e., without library compounds present). Z’ can vary between 0 and 1, with values >0.5 considered acceptable.[19] We estimated Z’-factor for ascomycin inhibition from the highest and lowest observed signals (Figure 5), obtaining an extremely high value of 0.89.
Figure 5.
Data showing inhibition of GFP-FKBP/rapamycin/FRB-eDHFR (10 nM, 30 nM, and 10 nM, respectively) interaction by ascomycin (200 nM to 100 pM). The y-axes represent the percent change in the 520 nm/615 nm emission ratio and the x-axes represent concentration of the titrated Ascomycin. Line represents NLS fit to equation 4, giving an IC50 = 9.8 ± 0.3 nM. An estimated Z’-factor of 0.89 was calculated from the data points obtained at maximum/minimum inhibition (shaded boxes).
Conclusion
Here we’ve shown that the selective, tight, non-covalent binding of a TMP-linked Tb3+ complex to eDHFR enables high-S:B, LRET-based detection of PPIs and their inhibition as well as accurate measurements of equilibrium dissociation and inhibition constants. We titrated GFP-FKBP/rapamycin against constant levels of FRB-eDHFR/TMP-TTHA-cs124(Tb3+) and measured LRET-sensitized, Tb3+-to-GFP emission to generate equilibrium binding isotherms. NLS fitting revealed nearly identical KD values for binding of GFP-FKBP/rapamycin to FRB-eDHFR in both buffer solution with purified proteins (~7.5 nM) and in bacterial lysates where GFP-FKBP was not purified (~6.4 nM). A reverse titration yielded a ~2-fold lower value (KD = ~3.3 nM). These values closely matched previously reported KD’s for the FKBP/rapamycin/FRB interaction (6.4 nM, solution-phase; 12 nM, surface-tethered).[16] While we performed our proof-of-principle experiments in 96-well plates (100 µL/well), it is evident from the large, observed S:B’s (~100–350 for PPI affinity, ~80 for ascomycin-mediated inhibition) that the assay could easily be miniaturized for HTS in 384-well (20–30 µL/well) or possibly even 1536-well (3–10 µL/well) plates. The hybrid chemical/genetic protein labeling strategy described here should allow HTS of a wide variety of target interactions across a broad range of affinities. Moreover, the assay platform can be used to interrogate PPIs directly in bacterial, mammalian or yeast cell extracts, enabling analysis of post-translationally modified proteins or other proteins that are not amenable to purification.
Experimental Section
Materials and methods
Oligonucleotides were obtained from Integrated DNA Technologies. Restriction enzymes, Vent DNA polymerase and T4 DNA ligase were purchased from New England Biolabs. Reagents were purchased from the indicated vendors: ascomycin, β-NADPH and Tween80 from Sigma-Aldrich; rapamycin from EMD Chemicals; Halt™ protease/phosphatase inhibitor cocktail and dialysis cassettes from Thermo Scientific; BugBuster® Protein Extraction Reagent from Novagen; HisLink™ protein purification resin from Promega; Luria-Bertani (LB) Broth, LB agar, potassium phosphate, o-phosphoric acid, acrylamide, sodium lauryl sulfate, ampicillin from Fisher Scientific; Coomassie Brilliant Blue G, bovine serum albumin (BSA) and imidazole from Acros Organics; isopropylthio-β-galactoside (IPTG) and HEPES from Invitrogen. Black bottom, 96-well plates were purchased from Costar. Preparation of pRSETb-mTSapphire-eDHFR, pRSETb-GFP-eDHFR plasmids was described in a previous study.[12a]
Bacterial expression constructs were sequenced at UIC Research Resources Center (RRC). Sonications were carried out using a Branson Sonifier 150. Protein concentrations were determined by absorption spectroscopy using a Varian Cary 300 Bio UV-Visible Spectrophotometer. Time-resolved luminescence measurements were made using a fluorescence plate reader (Perkin Elmer, Victor 3V) with 340 nm excitation (60 nm bandpass) and either 520 nm emission (10 nm bandpass) or 615 nm emission (10 nm bandpass). Intensity values (1400 µs integration) were measured after a time delay of 100 µs. LRET data was used to generate binding isotherms that were fit non-linearly to the equations described in the text using KaleidaGraph (v4.0, Synergy Software).
The TMP-linked, Tb3+ complex used in these studies, TMP-TTHA-cs124(Tb3+), was prepared as previously described.[12c]
Preparation of recombinant DNA constructs
The gene encoding FRB was subcloned from plasmid pcDNA-myc-FRB (Addgene, Plasmid 20228) to pRSETb-mTSapphire-eDHFR to generate pRSETb-FRB-eDHFR. A 316 bp fragment encoding FRB was amplified by PCR from pcDNA-myc-FRB using the primers 5’ – CTC GAG GAT CCA ATC CTC TGG CAT GAG ATG TGGC – 3’ (BamHI, coding strand) and 5’ – CCTC TTC TGA GAT GAG TTT GTA CAC CTT TGA GAT TCG TCGG – 3’ (BsrGI, non-coding strand). This fragment was inserted between the BamHI site and the BsrGI site in pRSETb-mTSapphire-eDHFR to give to pRSETb-FRB-eDHFR. Upon tranformation into E. coli, pRSETb-FRB-eDHFR expressed the protein fusion MRGSHHHHHHGMASMTGGQQMGRDLYDDDDKDP -[FRB]-GSGGSG-[eDHFR]. The gene encoding FKBP12 was subcloned from plasmid YFP-FKBP (Addgene, Plasmid 20175) to pRSETb-GFP-eDHFR to generate pRSETb-GFP-FKBP. A 374 bp fragment encoding FKPB12 was amplified by PCR from YFP-FKBP using the primers 5’ – GC ATG GTG TAC AAG TCT GGA AGT GCT GGT GG – 3’ (BsrGI, coding strand) and 5’ – ACC AGC ACA AGC TTC AGC ACT TTC CAG – 3’ (HindIII, non-coding strand). This fragment was inserted between the BsrGI site and the HindIII site in pRSETb-GFP-eDHFR to give to pRSETb-GFP-FKBP. Upon tranformation into E. coli, pRSETb-GFP-FKBP expressed the protein fusion MRGSHHHHHHGMASMTGGQQMGRDLYDDDDKDP-[EGFP]-SGSAGG-[FKBP]. The integrity of all plasmids was verified by direct sequencing.
Protein expression and purification
E. coli strain BL21 DE3 (pLysS) cells were transformed with pRSETb-GFP-FKBP or pRSETb-FRB-eDHFR and grown on agar plates with ampicillin (100 µg ml−1). LB broths (50 mL) with ampicillin (100 µg ml−1) were inoculated with single colonies from agar plates and grown overnight at 37 °C. LB broths (1 L) with ampicillin (100 µg ml−1) were inoculated with overnight grown cultures and grown at 37 °C at 250 rpm until OD600 ~ 0.6–0.7, at which time IPTG was added (to a final concentration of 1 mM). pRSETb-GFP-FKBP cultures were grown 6 hours and pRSETB-FRB-FKBP cultures were grown 4 hours after IPTG addition until cells were harvested by centrifugation. The pellets were lysed in lysis buffer (25 mL; 1X BugBuster™ Protein Extraction Reagent, 2 units ml−1 DNase I, 1mM PMSF, 100mM HEPES, 10mM imidazole, pH 7.5). Samples were placed on an orbital shaker for 30 min, and then centrifuged (18,500 rcf, 20 min, 4 °C). The supernatants were passed through HisLink™ protein purification resin and washed with gradually increasing concentrations of imidazole solutions until proteins were eluted. The purities of the proteins were tested with sodium dodecyl sulfate polyacrylamide gel electrophoresis and staining with Coomassie Blue. Following purification, the proteins were concentrated (to ~100 µM), dialyzed in phosphate buffer (10 mM K2HPO4, KH2PO4, pH 7.4), and stored at −80 °C. Concentration of His6-FRB-eDHFR was determined by 280 nm absorption measurement (ε280 = 65,650 cm−1M−1) and concentration of His6-GFP-FKBP was deteremined by absorbance of GFP at 487 nm (ε487 = 57,500 cm−1M−1).
Preparation of cell lysates for direct binding affinity measurements
Following transformation with pRSETb-GFP-FKBP, growth, and expression, BL21 DE3 (pLysS) cell pellets were resuspended in sonication buffer (2× Halt™ Protease/Phosphatase Inhibitor Cocktail, 2 units ml−1 DNase I, 50 mM K2HPO4, KH2PO4, pH 7.2) (to the final concentration of 0.1 mg µL−1 (w/v)). The cell suspension was lysed by sonication (2 minutes, 20 s on/10 s off cycles), centrifuged (20,817 rcf, 15 min, 4 °C) and the supernatant was retained for subsequent analysis. GFP-FKBP concentration was quantified by GFP absorbance (ε487 = 57,500 cm−1M−1), and total protein concentration in the cell lysate was quantified by absorption at 280 nm.[20]
LRET Affinity and Inhibition Assays: Sample Preparation
Measurements of equilibrium binding affinity were carried out in 96-well plates (100 µL/well) at 21–25 °C with analytes diluted into assay buffer (50 mM K2HPO4, KH2PO4, pH 7.2, 0.1 % (w/v) BSA, and 0.1 % (v/v) Tween80). For a given assay, the titrated analyte was serially diluted well-to-well by a factor of 2 to achieve the desired concentration range, and the remaining analytes were then added to achieve the desired final composition, as detailed below. Each sample titration was performed in triplicate. Plates were measured using a Victor 3V luminescence plate reader and data was analyzed as described in the results and discussion section.
Additional Methods
For assay sample plate preparation and figures, see the Supporting Information.
Supplementary Material
Acknowledgements
This study was supported by the National Institutes of Health (National Institute of General Medical Sciences Grant R01-GM081030-01A1).
References
- 1.Pandey A, Mann M. Nature. 2000;405:837–846. doi: 10.1038/35015709. [DOI] [PubMed] [Google Scholar]
- 2.Arkin MR, Wells JA. Nat. Rev. Drug Discov. 2004;3:301–317. doi: 10.1038/nrd1343. [DOI] [PubMed] [Google Scholar]
- 3.Phizicky EM, Fields S. Microbiol. Rev. 1995;59:94–123. doi: 10.1128/mr.59.1.94-123.1995. [DOI] [PMC free article] [PubMed] [Google Scholar]
- 4.Michnick SW, Ear PH, Manderson EN, Remy I, Stefan E. Nat. Rev. Drug Discov. 2007;6:569–582. doi: 10.1038/nrd2311. [DOI] [PubMed] [Google Scholar]
- 5.Heydorn A, Lundholt BK, Praestegaard M, Pagliaro L. Methods Enzymol. 2006;414:513–530. doi: 10.1016/S0076-6879(06)14027-6. [DOI] [PubMed] [Google Scholar]
- 6.a) Roehrl MH, Wang JY, Wagner G. Biochemistry. 2004;43:16056–16066. doi: 10.1021/bi048233g. [DOI] [PubMed] [Google Scholar]; b) Song Y, Madahar V, Liao J. Ann. Biomed. Eng. 2011;39:1224–1234. doi: 10.1007/s10439-010-0225-x. [DOI] [PMC free article] [PubMed] [Google Scholar]
- 7.Gribbon P, Sewing A. Drug Discov. Today. 2003;8:1035–1043. doi: 10.1016/s1359-6446(03)02895-2. [DOI] [PubMed] [Google Scholar]
- 8.Lakey JH, Raggett EM. Curr. Opin. Struct. Biol. 1998;8:119–123. doi: 10.1016/s0959-440x(98)80019-5. [DOI] [PubMed] [Google Scholar]
- 9.a) Mathis G. Clin. Chem. 1995;41:1391–1397. [PubMed] [Google Scholar]; b) Selvin PR. Annu. Rev. Biophys. Biomol. Struct. 2002;31:275–302. doi: 10.1146/annurev.biophys.31.101101.140927. [DOI] [PubMed] [Google Scholar]; c) Degorce F, Card A, Soh S, Trinquet E, Knapik GP, Xie B. Curr. Chem. Genomics. 2009;3:22–32. doi: 10.2174/1875397300903010022. [DOI] [PMC free article] [PubMed] [Google Scholar]
- 10.a) Maurel D, Comps-Agrar L, Brock C, Rives ML, Bourrier E, Ayoub MA, Bazin H, Tinel N, Durroux T, Prezeau L, Trinquet E, Pin JP. Nat. Methods. 2008;5:561–567. doi: 10.1038/nmeth.1213. [DOI] [PMC free article] [PubMed] [Google Scholar]; b) Leyris JP, Roux T, Trinquet E, Verdie P, Fehrentz JA, Oueslati N, Douzon S, Bourrier E, Lamarque L, Gagne D, Galleyrand JC, M'Kadmi C, Martinez J, Mary S, Baneres JL, Marie J. Anal. Biochem. 2011;408:253–262. doi: 10.1016/j.ab.2010.09.030. [DOI] [PubMed] [Google Scholar]
- 11.Newton P, Harrison P, Clulow S. J. Biomol. Screen. 2008;13:674–682. doi: 10.1177/1087057108321086. [DOI] [PubMed] [Google Scholar]
- 12.a) Rajapakse HE, Reddy DR, Mohandessi S, Butlin NG, Miller LW. Angew. Chem. Angew. Chem. Int. Ed. Engl. 2009;2009;12148:5090–5092. 4990–4992. doi: 10.1002/anie.200900858. [DOI] [PMC free article] [PubMed] [Google Scholar]; b) Rajapakse HE, Gahlaut N, Mohandessi S, Yu D, Turner JR, Miller LW. Proc. Natl. Acad. Sci. U S A. 2010;107:13582–13587. doi: 10.1073/pnas.1002025107. [DOI] [PMC free article] [PubMed] [Google Scholar]; c) Reddy DR, Pedro Rosa LE, Miller LW. Bioconjug. Chem. 2011;22:1402–1409. doi: 10.1021/bc200131k. [DOI] [PMC free article] [PubMed] [Google Scholar]
- 13.Ho SN, Biggar SR, Spencer DM, Schreiber SL, Crabtree GR. Nature. 1996;382:822–826. doi: 10.1038/382822a0. [DOI] [PubMed] [Google Scholar]
- 14.Kohler JJ, Bertozzi CR. Chem. Biol. 2003;10:1303–1311. doi: 10.1016/j.chembiol.2003.11.018. [DOI] [PubMed] [Google Scholar]
- 15.Stankunas K, Bayle JH, Gestwicki JE, Lin YM, Wandless TJ, Crabtree GR. Mol. Cell. 2003;12:1615–1624. doi: 10.1016/s1097-2765(03)00491-x. [DOI] [PubMed] [Google Scholar]
- 16.Banaszynski LA, Liu CW, Wandless TJ. J. Am. Chem. Soc. 2005;127:4715–4721. doi: 10.1021/ja043277y. [DOI] [PubMed] [Google Scholar]
- 17.Tsien RY. Annu. Rev. Biochem. 1998;67:509–544. doi: 10.1146/annurev.biochem.67.1.509. [DOI] [PubMed] [Google Scholar]
- 18.Kawai M, Lane BC, Hsieh GC, Mollison KW, Carter GW, Luly JR. FEBS Lett. 1993;316:107–113. doi: 10.1016/0014-5793(93)81196-7. [DOI] [PubMed] [Google Scholar]
- 19.Inglese J, Johnson RL, Simeonov A, Xia M, Zheng W, Austin CP, Auld DS. Nat. Chem. Biol. 2007;3:466–479. doi: 10.1038/nchembio.2007.17. [DOI] [PubMed] [Google Scholar]
- 20.Lovrien R, Matulis D. Curr. Protoc. Microbiol. 2005 Appendix 3, Appendix 3A. [Google Scholar]
Associated Data
This section collects any data citations, data availability statements, or supplementary materials included in this article.


