

Abstract
Viruses represent a continual threat to humans through a number of mechanisms, which include disease, bioterrorism, and destruction of both plant and animal food resources. Many contemporary techniques used for the detection of viruses and viral infections suffer from limitations such as the need for extensive sample preparation or the lengthy window between infection and measurable immune response, for serological methods. In order to develop a method that is fast, cost-effective, and features reduced sample preparation compared to many other virus detection methods, we report the application of silicon photonic microring resonators for the direct, label-free detection of intact viruses in both purified samples as well as in a complex, real-world analytical matrix. As a model system, we demonstrate the quantitative detection of Bean pod mottle virus, a pathogen of great agricultural importance, with a limit of detection of 10 ng/mL. By simply grinding a small amount of leaf sample in buffer with a mortar and pestle, infected leaves can be identified over a healthy control with a total analysis time of less than 45 min. Given the inherent scalability and multiplexing capability of the semiconductor-based technology, we feel that silicon photonic microring resonators are well-positioned as a promising analytical tool for a number of viral detection applications.
Keywords: Microring resonator, Bean pod mottle virus, Silicon photonics, Virus detection, Label-free biosensor, Bioterrorism
1. Introduction
Whether through direct or indirect means, viruses represent a menacing and omnipresent threat to humanity. Worldwide, millions of people each year die or suffer from infections of viruses such as influenza, rotavirus, HIV, and measles, amongst many others, and viruses also pose a threat in the form of bioterrorism. Another key, though often overlooked, threat posed by viruses is to global food production, where viruses can cause significant decreases in crop quality and yield. The battle to prevent or avert disaster in each of these affected sectors is fundamentally tied to the ability to detect the presence of these nanoscopic species.
Current viral detection methods can be broken down into three categories based upon the type of signature analyzed (Cheng et al., 2009). Serological methods take advantage of the host organism's natural immune response to measure antibodies generated in response to infection. While commonly employed, these approaches are often limited by the time required for the infection to generate a measurable immune response, often requiring weeks to months to achieve (Cheng et al., 2009; Tuke et al., 2008). Another common approach to virus detection relies upon the detection of viral proteins, DNA, or RNA. In particular, nucleic acid analysis, via polymerase chain reaction (PCR) or reverse transcriptase (RT)-PCR, respectively, offers very high sensitivity due to the amplification inherent in PCR. There exist a number of methodologies that have been applied to the detection of whole, intact viruses–an approach that has potential advantages of reduced sample preparation and more rapid analysis. Not surprisingly, in pursuit of rapid and sensitive analysis there has recently been considerable activity in the development of micro-and nanoscale tools for viral targets for many different applications.
In this manuscript, we report the application of silicon photonic microring resonators for the label-free detection of viruses. Microring resonators are chip-integrated microcavities supporting optical modes that are exquisitely sensitive to the local dielectric environment. When functionalized to present analyte-specific capture agents, these devices are transformed into sensitive biomolecular sensors, as the wavelengths meeting the cavity resonance condition shift upon target binding-induced changes in the local refractive index, as shown in Scheme 1. We have previously demonstrated the utility of arrays of microring resonators for the label-free detection of protein and nucleic acid targets in both single- and multiplexed formats (Qavi and Bailey, 2010; Washburn et al., 2009, 2010). Herein, we use the same platform for quantitating whole virus particles. Notably, Vollmer et al. (2008) previously utilized a related type of sensor, based upon a microsphere optical resonator, to detect single influenza particles in a buffer solution.
Scheme 1.
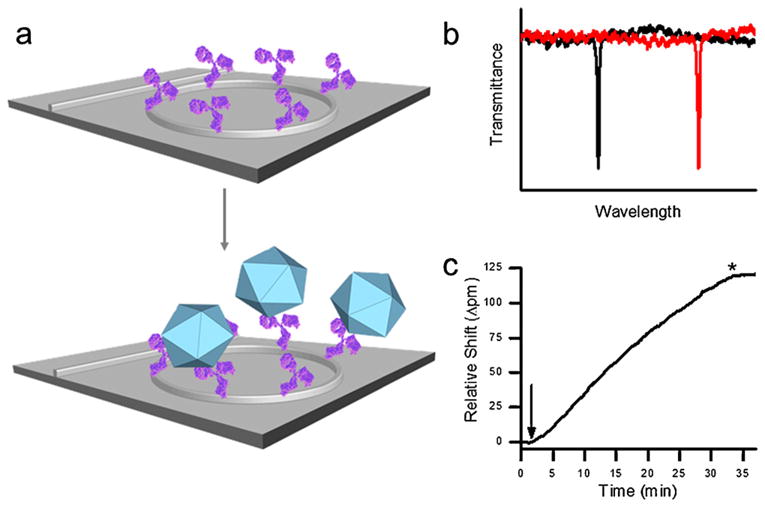
Illustration of viral detection using silicon photonic microring resonators. Microrings functionalized to present antibodies (purple) specific for the virus of interest (blue icosahedron) (a) support optical resonances at particular wavelengths that are extremely sensitive to antigen binding induced changes in the local refractive index. As viruses in a sample bind to the antibodies on the microring, the resonance shifts to longer wavelengths (b), and this shift is monitored in real time (c) to allow quantification of the target virus. In (c) the arrow indicates the time at which the sample is introduced and the * indicates the return to running buffer. (For interpretation of the references to color in this scheme legend, the reader is referred to the web version of the article.)
In this manuscript, we describe the quantitative detection of viruses from both buffer solutions and leaf extract using arrays of chip-integrated microring resonators. These devices are batch fabricated using well-established semiconductor processing methods making them intrinsically multiplexable and inexpensive to mass produce. Therefore we feel that this technology could be promising for point-of-care detection of viruses from within complex matrices and for a range of bioanalytical applications. As a model virus for technology validation, we have chosen a target with strong agricultural importance: Bean pod mottle virus (BPMV). BPMV is an icosahedral RNA virus with a mean diameter of 28 nm and a mass of ∼7MDa(Chen et al., 1989; Giesler et al., 2002; Li et al., 1992). It is the most common viral soybean (Glycine max) pathogen throughout much of the south, southeast, and Midwest portions of the United States and Canada, and it is responsible for decreased quality and yield of soybean production (Giesler et al., 2002). Severe infections can lead to up to 52% losses in crop yield due to smaller seed size and discoloration (Gergerich, 1999). Additionally, co-infection of crops with BPMV and Soybean mosaic virus (SMV) can lead to devastating reductions of crop yields of up to 85% (Mabry et al., 2003; Ross, 1968). Because of the large number of samples to be analyzed in monitoring the speed and breadth of disease transmission, it is clear that techniques capable of detecting viruses with minimal sample preparation and rapid time-to-result are valuable. Herein, we utilize scalable, silicon photonic detection technology to quantitatively detect viruses in BPMV infected soybean leaf extracts in a simple, rapid, and label-free assay format.
2. Materials and methods
2.1. Materials
Unless otherwise specified, reagents were obtained from Sigma–Aldrich (St. Louis, MO) and used as received. Monoclonal antibodies to BPMV (CAB 46400), SMV (CAB 33300), Alfalfa mosaic virus (AMV; CAB 87601), Tobacco ringspot virus (TRSV; CAB 64000), and a BPMV ELISA kit were purchased from Agdia (Elkhart, IN). The 3-N-((6-(N′-isopropylidenehydrazino))nicotinamide)propyltriethoxysilane (HyNic silane) and succinimidyl 4-formyl benzoate (S-4FB) were purchased from Solulink (San Diego, CA). Dulbecco's phosphate buffered saline (PBS), was reconstituted in deionized water and the pH adjusted to either 7.4 or 6.0 with 1 M HCl or 1 M NaOH. BSA–PBS buffer consisted of 0.1 mg/mL bovine serum albumin (BSA) in pH 7.4 PBS. The surface blocking buffer consisted of 2% BSA in pH 7.4 PBS. Zeba spin filter columns were purchased from Pierce (Rockford, IL).
Purified BPMV was isolated from infected leaf samples soybean cultivar Williams 82 infected with BPMV isolate WP2 as described Ghabrial et al. (1977). Leaves were collected from age-matched healthy and BPMV-infected Williams 82 soybean at 2 weeks after inoculation.
2.2. Instrumentation and microring sensor array substrates
The instrumentation utilized to measure shifts in microring resonance wavelengths and sensor substrates were designed in collaboration with and acquired from Genalyte, Inc. (San Diego, CA), and were described previously (Iqbal et al., 2010; Washburn et al., 2009). Briefly, sensor chips, each having an array of 32 individually addressable microring resonators accessed by a linear waveguides with terminal diffractive grating couplers, were fabricated on silicon-on-insulator wafers. The entire surface of the substrate was uniformly coated with a perfluoropolymer and annular openings were created over 24 of the microrings via reactive ion etching, allowing solution to come into contact with the those sensor elements. The remaining 8 microrings remain occluded and are used as thermal controls, as they are not affected by chemical or biomolecular binding events.
Sensor substrates were loaded into a previously described microfluidic cartridge and light from a tunable external cavity laser (center wavelength 1560nm) coupled into the input grating coupler accessing a single microring. The laser wavelength was then swept through a 12 nm spectral window and resonances determined as negative attenuations in light intensity outcoupled through the output grating coupler. This process was repeated for the entire array of 32 resonators, enabling near real-time measurement of shifts in resonance wavelength. Solutions were flowed across the sensor array as directed by the microfluidic gasket under the control of a syringe pump.
2.3. Functionalization of sensor array surface
The sensor chip was cleaned with a piranha solution (3:1 H2SO4:30% H2O2), followed by copious rinsing with water, and then rinsed with isopropanol and dried in a stream of nitrogen.1 To introduce analyte-specific capture agents, the sensor chip was immersed for 20 min in a 1.25 mg/mL solution of HyNic Silane in 95% ethanol and 5% DMF, which installs a HyNic linker on the surface of the microrings. Separately, antibodies were conjugated to S-4FB molecules through the following procedure. Antibody solutions were buffer exchanged using Zeba spin filter columns into PBS pH 7.4 and reacted with a 10-fold molar excess of S-4FB (0.1 mg/mL in DMF) at room temperature for 2 h. Unreacted S-4FB was removed via spin filtration and the buffer exchanged to PBS pH 6.0. The concentration of antibody in solution was determined by absorbance at 280 nm, as measured on a NanoDrop 1000 spectrophotometer (Thermo Scientific). Immediately before surface conjugation, aniline (Byeon et al, 2010) (to a final concentration of 105 mM) was added to a solution of approximately 40 μg/mL of the 4FB-modified antibody and this solution was flowed across the microrings at 2 μL/min for 70 min. The sensor chip was then rinsed with a pH 2.2 glycine buffer to remove non-covalently attached antibody and stored in BSA–PBS at 4 °Cuntil use. Sensor chips were typically functionalized with multiple antibodies, having specificity for BPMV and other soybean viruses, with rings not recognizing BPMV able to be used to correct for non-specific adsorption in complex samples.
2.4. Sample preparation and assay procedure
Standard concentrations of BPMV were prepared by serial dilution of the stock concentrated virus in BSA–PBS. Two leaf extract samples were prepared by grinding approximately 100 mg of leaf material in a mortar and pestle with 1 mL of BSA–PBS buffer until homogeneous. Solid plant debris was quickly removed via a 5 min centrifugation at 10,000 rcf. The supernatant was diluted 200-fold with BSA–PBS before analysis.
Prior to sample analysis, the sensor chip was blocked with blocking buffer and a baseline established in BSA–PBS buffer. The sample was flowed over the surface for 30 min at 10 μL/min followed by a 5-10 min buffer rinse. A pH 2.2 glycine buffer rinse was then used to regenerate the chip surface. The process was repeated for subsequent samples.
2.5. Data analysis
The total shift in resonance wavelength after 30 min of virus binding to antibody-modified microrings was measured and used to generate a calibration curve for BPMV concentration. Despite blocking, leaf extract solutions gave some non-specific binding and therefore the response from the isotype control microrings was subtracted from that of the anti-BPMV functionalized rings (Fig. S1 in Supporting information).
3. Results and discussion
3.1. Sensor specificity
As a test to determine if BPMV could be selectively detected, a four-channel microfluidic gasket was used to immobilize four different antibodies on a single sensor array, each specific for one of four different soybean viruses, BPMV, SMV, TRSV, and AMV. A purified sample of BPMV was then flowed over the entire sensor array. As shown in Fig. 1, large shifts in resonance wavelength are only recorded for the microrings presenting anti-BPMV, confirming the analyte-specific detection of BPMV.
Fig. 1.
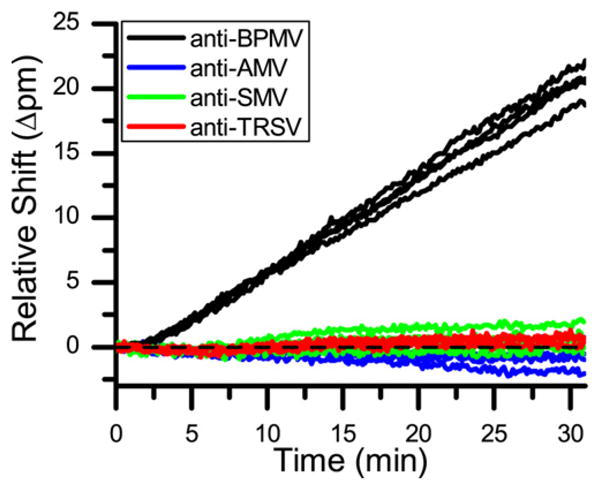
Sensor response to a purified sample of BPMV by sensors functionalized with antibodies to AMV, BPMV, SMV, and TRSV. The specificity of the sensors is clearly evident as the only sensors that respond to the BPMV virus are those that present anti-BPMV antibodies.
3.2. Sensor calibration
We then sought to understand the concentration sensitivity of the platform for quantitative BPMV analysis, which is a function both of the fundamental device sensitivity as well as the affinity of the biomolecular recognition even (the affinity of the antigen–antibody interaction, in this case). Using a two-channel microfluidic architecture, 12 microrings were selectively functionalized with the anti-BPMV antibody and another 12 microrings with the anti-SMV antibody, which served as a negative control to correct for non-specific binding. Standard solutions containing BPMV at concentrations ranging from 25 ng/mL to 1000 ng/mL in BSA–PBS were successively flowed across the entire sensor array, with sensor regeneration in between each concentration, and the relative shifts in resonance wavelength for each microring were monitored in near real-time. Fig. 2a shows an overlay of the responses for the anti-BPMV modified microrings. Negligible binding was observed on the anti-SMV rings, consistent with the previously determined sensor specificity. Plotting the relative shifts in resonance wavelength upon switching back to pure buffer after 30 min of binding versus BPMV concentration allowed for the construction of a sensor calibration curve, as shown in Fig. 2b. The error bars on each point correspond to 95% confidence interval from n ≥ 12 measurements. The calibration curve is fit with a second-order polynomial (R2 = 0.987) since, as expected, the binding response begins to saturate at higher BPMV concentrations. The limit of detection was empirically determined by finding the lowest concentration that generates a measurable response to be 10 ng/mL, which corresponds to ∼1.4pM.
Fig. 2.
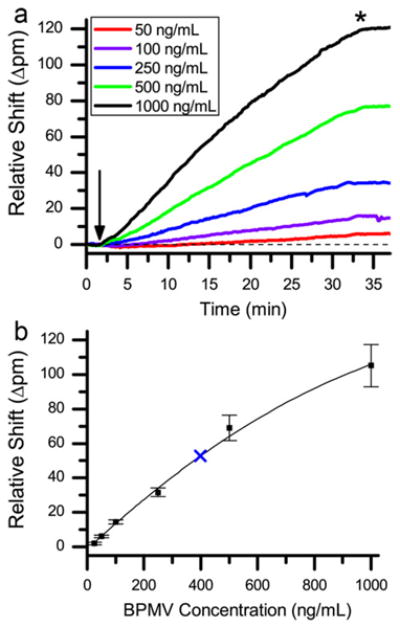
(a) Graph showing the overlaid sensor responses for a representative ring to increasing concentrations of BPMV, arrow indicates the addition of BPMV standards, a dashed line is located at 0 shift; (b) graph showing the calibration curve for BPMV with a second-order polynomial fitting. The blue “X” indicates the response from the 1:200 dilution of the extract from a BPMV infected sample. Error bars represent the 95% confidence interval from n ≥ 12 measurements. (For interpretation of the references to color in this figure legend, the reader is referred to the web version of the article.)
3.3. Demonstration in leaf samples
A key advantage of our silicon-based analysis platform is that sensors can be mass produced at very low cost, and label-free operation removes requirements for multiple detection reagents and/or extensive sample preparation, such as fluorescent or enzymatic labeling. These qualities position microring resonators as a potentially useful technology for “in-the-field” agricultural diagnostics. Importantly, the rapid and widespread analysis of easily attainable samples might allow timely intervention to, for example, limit the regional propagation of viral infections. Therefore, we sought to challenge our platform with a more real-world applicable analytical challenge, focusing on the relatively rapid (<1 h) analysis of healthy and BPMV-infected soybean leaves.
Portions of leaves harvested from both healthy and BPMV-infected soybean plants were simply ground with a small amount of buffer for one minute in a mortar and pestle. Solid plant debris was removed via centrifugation, diluted, and flowed directly across a sensor array that had microrings functionalized with anti-BPMV and anti-SMV. Fig. 3 shows that the presence of BPMV was clearly evident in the infected leaf sample, as the resonance wavelength shift was significantly larger than that from the healthy leaf sample. Notably, the analysis of whole leaf samples (both healthy and infected) was complicated by non-specific adsorption of unknown interferences (see Figure S1 in Supporting Information); however, the presence of anti-SMV control rings allowed this non-specific response to be simply subtracted from the signals from the anti-BPMV-modified sensor elements. This corrected response was considered against the previously established standard curve, and the concentration of BPMV in the extract was determined to be 78.7 μg/mL, which corresponded to 0.79 mg BPMV/g leaf.
Fig. 3.
Sensor response to diluted extracts from soybean leaves. The red trace represents a 1:200 dilution of the leaf extract from a BPMV infected sample, the blue trace represents a 1:200 dilution of the leaf extract from a healthy sample.
The most commonly used method for detection of BPMV is the sandwich enzyme linked immunosorbent assay (ELISA) (Mabry et al., 2003). This method, though highly sensitive, has a number of drawbacks that make it less than ideal for certain applications. For example, per the manufacturer's instructions, the BPMV ELISA assay is only to be used for detecting the presence or absence of infection, providing no quantitative information about viral load. Moreover, standard ELISAs typically take multiple hours to perform and are only capable of detecting a single target antigen from within a sample volume. By comparison, this report describes the quantitative analysis of viral load within a 45 min total assay time, without the need for extensive sample handling or pre-treatment. To our knowledge, this represents the most rapid determination of BPMV infections in terms of both sample preparation and analysis. Furthermore, while it is beyond the scope of this report, the microring resonator analysis platform is intrinsically multiplexable on account of its origins in semiconductor fabrication, and we have previously shown that multiple biomolecular signatures can be simultaneously quantified from a single sample with no loss in device performance (Qavi and Bailey, 2010; Qavi et al., 2011; Washburn et al., 2010). The prospects of detecting multiple viruses from within a single leaf sample is very attractive for crop diagnostics as co-infection with multiple viruses is known to dramatically increase losses in crop yields (Anjos et al., 1992; Calvert and Ghabrial, 1983; Hobbs et al, 2003; Malapi-Nelson et al., 2009; Ross, 1968; Vance, 1991). Therefore, we feel that the silicon photonic microring resonator platform has the potential to be a powerful analytical tool for agricultural detection applications
4. Conclusions
We have demonstrated the ability to quantitatively detect BPMV both in buffer and in complex leaf extracts using silicon photonic microring resonator technology. The simple extraction method and direct detection of intact viruses, combined with comparatively short analysis times of <1 h, provide a straight forward assay that offers advantages over many commonly employed methods. Additionally, the ability to fabricate highly multiplexed sensors will allow for identification of co-infections with no additional sample preparation or analysis, providing a powerful tool for viral detection that can span applications from healthcare and bioterrorism surveillance to agricultural monitoring.
Supplementary Material
Acknowledgments
We acknowledge support from the NIH Director's New Innovator Award Program, part of the NIH Roadmap for Medical Research, through grant number 1-DP2-OD002190-01. MSM is supported through a Robert C. and Carolyn J. Springborn Fellowship from the Department of Chemistry at the University of Illinois at Urbana-Champaign.
Footnotes
Caution: Piranha solution must be handled with care as it reacts violently with organic compounds.
Appendix A. Supplementary data: Supplementary data associated with this article can be found, in the online version, at doi:10.1016/j.bios.2011.10.056.
References
- Anjos JR, Jarlfors U, Ghabrial SA. Phytopathology. 1992;82(10):1022–1027. [Google Scholar]
- Byeon JY, Limpoco FT, Bailey RC. Langmuir. 2010;26(19):15430–15435. doi: 10.1021/la1021824. [DOI] [PMC free article] [PubMed] [Google Scholar]
- Calvert LA, Ghabrial SA. Phytopathology. 1983;73(7):992–997. [Google Scholar]
- Chen Z, Stauffacher C, Li Y, Schmidt T, Bomu W, Kamer G, Shanks M, Lomonossoff G, Johnson JE. Science. 1989;245(4914):154–159. doi: 10.1126/science.2749253. [DOI] [PubMed] [Google Scholar]
- Cheng X, Chen G, Rodriguez W. Analytical and Bioanalytical Chemistry. 2009;393(2):487–501. doi: 10.1007/s00216-008-2514-x. [DOI] [PMC free article] [PubMed] [Google Scholar]
- Gergerich RC. In: Compendium of Soybean Diseases. 4th. Hartman GL, Sinclair JB, Rupe JC, editors. Americal Phytopathological Society; St Paul, MN: 1999. pp. 61–62. [Google Scholar]
- Ghabrial SA, Pickard CM, Stuckey RE. Plant Disease Reporter. 1977;61(8):690–694. [Google Scholar]
- Giesler LJ, Ghabrial SA, Hunt TE, Hill JH. Plant Disease. 2002;86(12):1280–1289. doi: 10.1094/PDIS.2002.86.12.1280. [DOI] [PubMed] [Google Scholar]
- Hobbs HA, Hartman GL, Wang Y, Hill CB, Bernard RL, Pedersen WL, Domier LL. Plant Disease. 2003;87(11):1333–1336. doi: 10.1094/PDIS.2003.87.11.1333. [DOI] [PubMed] [Google Scholar]
- Iqbal M, Gleeson MA, Spaugh B, Tybor F, Gunn WG, Hochberg M, Baehr-Jones T, Bailey RC, Gunn LC. IEEE Journal of Selected Topics in Quantum Electronics. 2010;16(3):654–661. [Google Scholar]
- Li T, Chen Z, Johnson JE, Thomas GJ. Biochemistry. 1992;31(29):6673–6682. doi: 10.1021/bi00144a006. [DOI] [PubMed] [Google Scholar]
- Mabry TR, Hobbs HA, Steinlage TA, Johnson BB, Pedersen WL, Spencer JL, Levine E, Isard SA, Domier LL, Hartman GL. Plant Disease. 2003;87(10):1221–1225. doi: 10.1094/PDIS.2003.87.10.1221. [DOI] [PubMed] [Google Scholar]
- Malapi-Nelson M, Wen RH, Ownley BH, Hajimorad MR. Plant Disease. 2009;93(12):1259–1264. doi: 10.1094/PDIS-93-12-1259. [DOI] [PubMed] [Google Scholar]
- Qavi AJ, Bailey RC. Angewandte Chemie International Edition. 2010;49(27):4608–4611. doi: 10.1002/anie.201001712. [DOI] [PMC free article] [PubMed] [Google Scholar]
- Qavi AJ, Kindt JT, Gleeson MA, Bailey RC. Analytical Chemistry. 2011 doi: 10.1021/ac201340s. [DOI] [PMC free article] [PubMed] [Google Scholar]
- Ross JP. Plant Disease Reporter. 1968;52:344–348. [Google Scholar]
- Tuke PW, Grant PR, Waite J, Kitchen AD, Eglin RP, Tedder RS. Transfusion. 2008;48(4):594–600. doi: 10.1111/j.1537-2995.2007.01584.x. [DOI] [PubMed] [Google Scholar]
- Vance VB. Virology. 1991;182(2):486–494. doi: 10.1016/0042-6822(91)90589-4. [DOI] [PubMed] [Google Scholar]
- Vollmer F, Arnold S, Keng D. Proceedings of the National Academy of Sciences. 2008;105(52):20701–20704. doi: 10.1073/pnas.0808988106. [DOI] [PMC free article] [PubMed] [Google Scholar]
- Washburn AL, Gunn LC, Bailey RC. Analytical Chemistry. 2009;81(22):9499–9506. doi: 10.1021/ac902006p. [DOI] [PMC free article] [PubMed] [Google Scholar]
- Washburn AL, Luchansky MS, Bowman AL, Bailey RC. Analytical Chemistry. 2010;82(1):69–72. doi: 10.1021/ac902451b. [DOI] [PMC free article] [PubMed] [Google Scholar]
Associated Data
This section collects any data citations, data availability statements, or supplementary materials included in this article.