

Abstract
The ENIGMA (Enhancing NeuroImaging Genetics through Meta-Analysis) Consortium was set up to analyze brain measures and genotypes from multiple sites across the world to improve the power to detect genetic variants that influence the brain. Diffusion tensor imaging (DTI) yields quantitative measures sensitive to brain development and degeneration, and some common genetic variants may be associated with white matter integrity or connectivity. DTI measures, such as the fractional anisotropy (FA) of water diffusion, may be useful for identifying genetic variants that influence brain microstructure. However, genome-wide association studies (GWAS) require large populations to obtain sufficient power to detect and replicate significant effects, motivating a multi-site consortium effort. As part of an ENIGMA–DTI working group, we analyzed high-resolution FA images from multiple imaging sites across North America, Australia, and Europe, to address the challenge of harmonizing imaging data collected at multiple sites. Four hundred images of healthy adults aged 18–85 from four sites were used to create a template and corresponding skeletonized FA image as a common reference space. Using twin and pedigree samples of different ethnicities, we used our common template to evaluate the heritability of tract-derived FA measures. We show that our template is reliable for integrating multiple datasets by combining results through meta-analysis and unifying the data through exploratory mega-analyses. Our results may help prioritize regions of the FA map that are consistently influenced by additive genetic factors for future genetic discovery studies. Protocols and templates are publicly available at (http://enigma.loni.ucla.edu/ongoing/dti-working-group/).
Keywords: Diffusion Tensor Imaging (DTI), Imaging genetics, Heritability, Meta-analysis, Multi-site, Reliability
Introduction
The structure of the human brain is genetically influenced, and many measures derived from brain images are heritable, i.e., some proportion of their variance is due to individual differences in the human genome. The degree of heritability, as well as the effects of specific genetic variants, can be mapped using quantitative genetic analysis of measures derived from brain images (Chen et al., 2012; Glahn et al., 2010; Thompson et al., 2001; van den Heuvel et al., 2012). Specific genetic variants affecting cognition or disease risk have been hard to identify as their individual effects are small, leaving much of the genetic effect unaccounted for leading to “missing heritability” (Zuk et al., 2012). Instead of relating clinical or behavioral measures to variants in the genome, imaging genetics offers a direct approach to discover genetic variants that affect brain structure and function. In this context, brain imaging measures can be considered quantitative endophenotypes for neurological or psychiatric illness, and identifying genetic variants associated with these measures provides candidates for disease risk (Braskie et al., 2011b; Glahn et al., 2007; Hasler and Northoff, 2011). The current manuscript focuses on the genetic properties of diffusion tensor imaging (DTI) (Basser et al., 1994), a relatively less utilized data type in imaging genomics.
As MRI-based studies of the brain expanded to include hundreds or even thousands of subjects, it recently became feasible to search the genome for single-base-pair alterations, or polymorphisms, that are related to identifiable features in brain scans. Recent publications from the Enhancing Neuroimaging Genetics though Meta-Analysis (ENIGMA) and Cohorts for Heart and Aging Research in Genomic Epidemiology (CHARGE) Consortia, highlight the potential of large genome-wide association studies (GWAS) – especially meta-analyses of multiple studies – to uncover genetic loci associated with MRI-based phenotypes including hippocampal volumes (Bis et al., 2012; Stein et al., 2012), intracranial volumes (Ikram et al., 2012; Stein et al., 2012), and head circumference (Taal et al., 2012). However, currently these large-scale imaging genomics efforts have been primarily restricted to phenotypes/endophenotypes derived from T1-weighted gray matter images. Recently, we created the ENIGMA Consortium workgroup examining the genetic influences on white matter micro-architecture and integrity, assessed using diffusion tensor imaging (DTI). The goal of the ENIGMA–DTI working group is to identify and homogenize heritable phenotypes that can be reliably obtained from images collected with a wide array of imaging parameters and from subjects of varying ages and different ethnicities. Eventually, we hope to discover specific genetic variants influencing brain DTI. As an initial step towards this goal, it is critical to determine which brain regions and measures to prioritize, based on how consistently they can be measure, and the relative evidence for substantial and consistent genetic influences on them (i.e., heritability).
One of several commonly analyzed scalar maps extracted from DTI (Basser et al., 1994) – the fractional anisotropy (FA) (Basser and Pierpaoli, 1996) – evaluates the extent to which water diffusion is directionally constrained by white matter microstructure. FA reflects fiber coherence, myelination levels, and axonal integrity, and has been widely used as an index of white matter integrity (Thomason and Thompson, 2011). As might be expected, FA shows diffuse abnormalities in many brain disorders including Alzheimer’s disease (AD) (Clerx et al., 2012; Teipel et al., 2012), it is related to cognitive performance (Penke et al., 2010a, 2010b) and is altered in numerous psychiatric disorders including major depressive disorder (Carballedo et al., 2012), bipolar disorder (Barysheva et al., submitted for publication; Sprooten et al., 2011a), and schizophrenia (Kochunov et al., 2012; Mandl et al., 2012).
The heritability of FA mapped voxel-wise in the brain, or averaged within specific tracts, has previously been established independently in various cohorts and also for different ethnic groups (Brouwer et al., 2010; Chiang et al., 2011b; Kochunov et al., 2011b). A meta-analysis of neuroimaging measures has found that FA is heritable with relatively tight confidence intervals, making it extremely promising for further genetic study (Blokland et al., 2012). More recently, DTI measures have begun to be used as phenotypes for genome-wide association and linkage studies (Chiang et al., 2012; Jahanshad et al., 2012a; Kochunov et al., 2011b; Lopez et al., in press; Sprooten et al., 2012) in the quest to identify novel variants and molecular pathways associated with white matter microstructure. While these gene discovery studies have great potential, single-site studies have limited power to discover variants that reliably generalize to other cohorts. Indeed, GWAS findings are often site-specific and may not be replicated in other populations. If the same cohort is imaged with different scanning protocols or analyzed with different processing streams, there may be differences in the sets of variants that are declared to be significant (Jahanshad et al., 2012c). Replication studies and meta-analyses across various independent study cohorts and imaging protocols are therefore vital to identify true positives that are robustly associated with a brain measure.
Before we undertake the task of a GWAS-meta analysis (GWAS-MA) across sites with FA measures, we must first decide on a set of phenotypes that can be reliably derived from the images. Even with rigorous quality control procedures, inter-site measurement variability can be quite high, with adverse effects for multi-site studies (Zhu et al., 2011). To be a useful endophenotype for GWAS, phenotypes must show high levels of heritability regardless of the population under study. Heritability is defined as the proportion of the trait variance in a population that is attributable to genetic factors. While there is no guarantee that GWAS will find specific genetic variants that influence highly heritable traits, non-heritable measures can be used for gene discovery. In this context, phenotype prioritization will focus studies and make them more efficient. As the goal phenotypic prioritization reduced the number of traits tested in GWAS, the correction for multiple testing is reduced, improving the potential to identify genes.
Here, we use FA images from four different imaging cohorts, scanned at various resolutions, and with different population structures, to develop a high-resolution target for image registration in the ICBM/MNI space, in accordance with previously established white matter atlases (Mori et al., 2008). We provide the FA-based registration target and white matter skeleton along with a set of protocols for effective collaboration in multi-site meta-analytical studies, including GWAS-MA (provided on line at http://enigma.loni.ucla.edu/ongoing/dti-working-group/). After processing 5 datasets with this protocol, we perform heritability analysis on a voxel-wise level with a subset of the datasets. These analyses were a meta-analysis of DTI data from 1) a Caucasian (Australian) twin sample and 2) a Mexican–American pedigree to converge on the most reliably heritable features and regions in the image. Large meta-analytic studies have been widely used to estimate the genetic influence of behavioral traits (Bezdjian et al., 2011; Malouff et al., 2008), and to reveal the genetic complexity of disease (Sullivan et al., 2003). This work presented here is the first of its kind, as it harmonizes images from different cohorts into the same high-resolution stereotaxic space and performs voxel-wise meta-analytical tests of heritability along the white matter skeleton, and in the image space. We additionally examine a mega-analytical approach,2 in an effort to boost power to estimate the heritability. We further estimate this heritability on parcellations of the image for a more traditional assessment of regional estimates of heritability, in regions of interest. This work from the ENIGMA–DTI working group lays the foundation to select phenotypes for large future multi-site joint-analytic genetic association studies with DTI data.
Methods
Study subjects and imaging protocols
Four datasets described below (QTIM, GOBS, BFS, LBC1936; the acronyms are also detailed below) were used for template creation. Two (QTIM, GOBS) family-based studies were used for the heritability analyses. A dataset (UMCU) not included in the template creation was used for additional validation.
The datasets used for this work are subsamples of larger datasets and information regarding the images used here are listed in Table 1 and described below:
Table 1.
Diffusion MR imaging parameters for each site included. All contributed scans are part of larger cohorts described below and referenced. N-gradients refers to the number of diffusion weighted images obtained, and N-b0 refers to the number of images obtained with no diffusion sensitization (T2-weighted).
| QTIM | GOBS | BFS | LBC1936 | UMCU | |
|---|---|---|---|---|---|
| Relatedness | Twins | Pedigree | Unrelated | Unrelated | Unrelated |
| Race/ethnicity | Caucasian | Mexican–American | Caucasian | Caucasian | Caucasian |
| #Subjects contributed | 292 | 859 | 100 | 100 | 100 |
| Sex | 106M/186F | 351M/508F | 50M/50F | 50M/50F | 50M/50F |
| Age range (years) | 21–29 | 19–85 | 18–26 | 71–74 | 18–45 |
| Healthy | Yes | Yes | Yes | Yes | No |
| Scanner | Bruker | Siemens | GE | GE | Achieva |
| N-acquisitions | 1 | 1 | 1 | 1 | 2 |
| Field strength | 4 T | 3 T | 1.5 T | 1.5 T | 1.5 T |
| Voxel size (mm) | 1.8 × 1.8 × 2 | 1.7 × 1.7 × 3.0 | 2.5 × 2.5 × 2.5 | 2.5 × 2.5 × 2.5 | 2.5 × 2.5 × 2.5 |
| N-gradients | 94 | 55 | 64 | 64 | 32 |
| N-b0 | 11 | 3 | 7 | 7 | 8 |
| b-Value (s/mm2) | 1159 | 700 | 1000 | 1000 | 1000 |
| Reference | de Zubicaray et al. (2008) | Kochunov et al. (2011b) | Sprooten et al. (2011a) | Wardlaw et al. (2011) | Mandl et al. (2010) |
-
QTIM — the Queensland Twin IMaging study
Subjects: Study subjects included young adult Australian twins and their siblings, all of European ancestry, between the ages of 21 and 29. 146 twin pairs were used in the heritability analysis, 68 monozygotic (MZ) pairs, and 78 dizygotic (DZ) pairs. 106 Male, 186 Female. Mean age 23.00 yr ± 2.06 SD. More information on the cohort, inclusion and exclusion criteria, and the study goals may be found in (de Zubicaray et al., 2008).
Imaging: A high angular resolution diffusion imaging protocol was used, consisting of a 14.2-minute, 105-image acquisition, with a 4-Tesla Bruker Medspec MRI scanner. Imaging parameters were: TR/TE = 6090/91.7 ms, FOV = 23 cm, with a 128 × 128 acquisition matrix. Each 3D volume consisted of 55 2-mm thick axial slices with no gap and 1.8 × 1.8 mm2 in-plane resolution. 105 images were acquired per subject: 11 with no diffusion sensitization (i.e., T2-weighted b0 images) and 94 diffusion-weighted (DW) images (b = 1159 s/mm2) with gradient directions uniformly distributed on the hemisphere.
-
GOBS — Genetics of Brain Structure and Function study
Subjects: The sample comprised 859 Mexican–American individuals from 73 extended pedigrees (average size 17.2 people, range = 1–247) form the San Antonio Family Study (Olvera et al., 2011). The sample was 59% female (351 men/508 women) and had a mean age of 43.2 (SD = 15.0; range = 19–85). Individuals in this cohort have actively participated in research for over 18 years and were randomly selected from the community with the constraints that they are of Mexican–American ancestry, part of a large family, and live within the San Antonio region. All participants provided written informed consent before participating in any aspect of the study. All participants provided written informed consent on forms approved by the Institutional Review Boards at the University of Texas Health Science Center San Antonio (UTHSCSA) and Yale University.
Imaging: Diffusion imaging was performed at the Research Imaging Center, UTHSCSA, on a Siemens 3 T Trio scanner using an eight-channel phased array head coil. A single-shot single refocusing spin-echo, echo-planar imaging sequence was used to acquire diffusion-weighted data with a spatial resolution of 1.7 × 1.7 × 3.0 mm. The sequence parameters were: TE/TR = 87/8000 ms, FOV = 200 mm, 55 isotropically distributed diffusion weighted directions, two diffusion weighting values, b = 0 and 700 s/mm2 and three b = 0 (non-diffusion-weighted) images.
-
BFS — Bipolar Family Study
Subjects: Participants were recruited as part of the Bipolar Family Study, a sample of young individuals at high genetic risk (HR) for bipolar disorder (BD) and of demographically matched healthy controls (HC). Individuals were considered at HR if they had at least one first-degree, or two second-degree, family members with bipolar I disorder. Participants were excluded if they fulfilled SCID criteria for an axis-I mood or psychotic disorder, had a major neurological disorder, history of head injury, history of learning disability or metallic implants or other contraindications to MRI examination. For more details of participant recruitment, screening and demographics, see (Sprooten et al., 2011a). 150 unrelated participants provided high quality DTI data and DNA for the generation of whole-genome data, including 70 HR (34 male; mean age = 21.6 years) and 80 HC (37 male; mean age = 21.3 years) subjects, all between the ages of 16–26 years at the time of recruitment. 100 of the adult (aged 18+) subjects’ scans were used for creating the ENIGMA–DTI template.
Imaging: MRI data were collected on a GE Signa Horizon HDX 1.5 T clinical scanner equipped with a self-shielding gradient set (22 mT/m maximum gradient strength) and a manufacturer-supplied ‘birdcage’ quadrature head coil. Whole brain diffusion imaging data were acquired for each subject using a single-shot pulsed gradient spin-echo echo-planar imaging (EPI) sequence with diffusion gradients (b = 1000 s/mm2) applied in 64 non-collinear directions, and seven T2-weighted EPI baseline (b = 0 s/mm2) scans. Fifty-three 2.5 mm contiguous axial slices were acquired with a field-of-view of 240 × 240 mm2, and an acquisition matrix of 96 × 96 (zero-filled to 128 × 128), giving an acquisition isotropic voxel size of 2.5 mm.
-
LBC1936 Lothian Birth Cohort 1936
Subjects: The LBC1936 is a study of healthy cognitive aging in the Edinburgh area of Scotland. Study participants were all born in 1936 and most had taken part in the Scottish Mental Survey 1947, which had administered a validated cognitive ability test to almost all Scottish schoolchildren born in 1936. The LBC1936 were recruited for Wave 1 of cognitive and medical testing at mean age 70 between 2004 and 2007 (N = 1091). None had dementia. Their recruitment and testing are described fully elsewhere (Deary et al., 2007, in press). At Wave 2, where the LBC1936 mean age was 73 years, the cognitive and medical examinations were repeated (N = 866), and a detailed structural magnetic resonance brain imaging examination was undertaken (N = 700 consented to imaging, with about 650 available for most variables). The imaging protocol is fully described by (Wardlaw et al., 2011). 100 healthy individuals (50 M/50 F) were used for template creation.
Imaging: Subjects underwent high angular resolution diffusion MRI using a GE Signa Horizon HDxt 1.5 T clinical scanner (General Electric, Milwaukee, WI, USA) equipped with a self-shielding gradient set (33 mT/m maximum gradient strength) and manufacturer supplied 8-channel phased-array head coil. The protocol consisted of 7 T2-weighted (b ~ 0 s/mm2) and sets of diffusion-weighted (b = 1000 s/mm2) axial single-shot spin-echo EPI volumes acquired with diffusion gradients applied in 64 non-collinear directions. Imaging parameters were: FOV = 25.6 × 25.6 mm, acquisition matrix 128 × 128 and TR/TE = 16500/98 ms. Each 3D volume consisted of 72 2 mm thick axial slices with no gap giving 2 mm isotropic voxels.
-
UMCU — University Medical Center Utrecht
Subjects: Subjects were recruited as part of a schizophrenia study at the University Medical Center Utrecht, The Netherlands (Boos et al., 2012). Patients with schizophrenia and healthy participants matched for age, sex, handedness, and parental education participated in the study all between ages 18 and 45. For this work, DTI scans from 49 patients with schizophrenia and 51 controls were used to evaluate template registration.
Imaging: 2 transverse DTI scans were acquired on a 1.5 Philips Achieva MR scanner (32 diffusion-weighted volumes with different non-collinear diffusion directions with b-factor = 1000 s/mm2 and 8 diffusion-unweighted volumes with b-factor = 0 s/mm2; parallel imaging SENSE factor = 2.5; flip angle = 90°; 60 slices of 2.5 mm; no slice gap; 96 × 96 acquisition matrix; reconstruction matrix 128 × 128; FOV = 240 mm; TE = 88 ms; TR = 9822 ms; no cardiac gating; and total scan duration = 296 s). More information may be found in (Mandl et al., 2010).
ENIGMA template creation
One hundred (50 male, 50 female) healthy unrelated subjects randomly selected from each of the first four datasets (QTIM, GOBS, BFS, LBC1936) listed above were used to create a common template. The fifth sample, UMCU was excluded from the template creation due to lower directional resolution and an insufficient number of healthy individuals, but was used as an external sample to validate the template. FA images from all subjects were aligned, using FSL’s ‘flirt’ (Jenkinson et al., 2002), to the Johns Hopkins University (JHU) DTI atlas in ICBM space (ICBM-DTI-81 white matter labels atlas) (Mori et al., 2008) available with the FSL package to ensure spatial consistency. A target was created as previously described (Kochunov et al., 2001, 2002) from these aligned images. Briefly, FA images from the 100 subjects of each cohort were iteratively registered with nonlinear registration (Andersson et al., 2008) to create a custom mean atlas, using a target ICBM space defined by the JHU DTI atlas (ICBM-DTI-81 white-matter labels atlas) (Mori et al., 2008). Once the target was created, all linearly aligned FA images, including those not used for the template, were nonlinearly registered to this custom FA atlas image.
Deformation analysis
One goal of creating a custom template from the subjects in a dataset is to create a target image for non-linear spatial normalization that requires the least amount of spatial transformation (i.e., distortion) of images from the subjects in the study. Non-linear spatial registration methods iteratively calculate the parameters of a deformation field from the coarse-to-fine resolution scales and the use of the custom template reduces some sources of bias in this normalization process (Kochunov et al., 2001). To assess the closeness of the template to the individual data being aligned to it, the average deformation across all voxels was calculated for all subjects in each cohort for registration to each template. The degree of deformation at each voxel was quantified as the absolute value of the difference between the determinant of the deformation field Jacobian matrix (simply referred to as the Jacobian here) and unity, as one represents no volumetric change (although there may still be deformations, in an incompressible flow). This may be written as: , where Jv is the Jacobian matrix at voxel v, from a total of Nv voxels, and k represents each cohort. Mean deformations to the templates were compared for each cohort.
Tract-based spatial statistics with reference to a common template
As described in the seminal tract-based spatial statistics (TBSS) paper (Smith et al., 2006), our template FA image was “skeletonized” to reveal an estimated structural core of the white matter. Subsequently, FA images from all subjects in each cohort were used to project voxels onto the same template skeleton, creating a unique FA skeleton in the same space for each individual in each cohort.
Checking the projection distance
Once all images were projected on to the skeleton, we find the mean and maximum projection distance across all voxels along the skeleton. This allows us to quantitatively evaluate the projections onto the template and search for outliers with extremely high projection distances, which may suggest poor image quality or failure of images to register correctly.
Heritability
Typical heritability studies involving related individuals, including either twin samples (as in QTIM) or pedigrees (as in GOBS), break down the total observed phenotypic variance, Vp, into a genetic component, Vg, and an environmental component, Ve, where Vp = Vg + Ve. These factors may be further broken down into additive versus dominant sources of genetic influence, as well as shared versus unique environmental influences on the trait of interest. We carried out our heritability studies using the full GOBS pedigree sample, and the paired-twin subsample of the QTIM, i.e., not including singletons or non-twin siblings.
Heritability calculation using SOLAR
To take into account the more complex structure of the GOBS pedigree, a variance components method, as implemented in the Sequential Oligogenic Linkage Analysis Routines (SOLAR) software package (http://www.nitrc.org/projects/se_linux) (Almasy and Blangero, 1998) was used. For comparison and combinatory purposes, the same analysis was also performed for the QTIM twin sample. Methods used to calculate heritability in SOLAR are detailed elsewhere (Kochunov et al., 2010; Winkler et al., 2010).
Briefly, the algorithms in SOLAR employ maximum likelihood variance decomposition methods and are an extension of the strategy developed by (Amos, 1994). The covariance matrix Ω for a pedigree of individuals is given by the following:
where is the genetic variance due to the additive genetic factors, Φ is the kinship matrix representing the pair-wise kinship coefficients among all individuals, is the variance due to individual-specific environmental effects, and I is an identity matrix. In this model heritability is
where σ2P refers to the phenotypic variance.
The variance parameters are estimated by comparing the observed phenotypic covariance matrix with the covariance matrix predicted by kinship (Almasy and Blangero, 1998). Significance of heritability is tested by comparing the likelihood of the model in which is constrained to zero with that of a model in which is estimated. Twice the difference between the two loge likelihoods of these models yields a test statistic, which is asymptotically distributed as a 1/2:1/2 mixture of a χ2 variable with 1 degree-of-freedom and a point mass at zero. Prior to testing for the significance of heritability, phenotype values for each individual were adjusted for covariates including sex, age, age2, age × sex interaction, and age2 × sex interaction. Inverse Gaussian transformation was also applied to ensure normality of the measurements. Outputs from SOLAR include the heritability value, its significance value (p), and its standard error.
Meta analysis
Various methods have been proposed for meta-analyzing heritability data (Li et al., 2003). To obtain our mean meta-analyzed heritability (h2) and standard error measurements, here we chose to observe two methods:
-
Weight the heritability from each study by its sample size as was previously shown to be successful (Verweij et al., 2010) in twin studies. The mean heritability weighted by sample size (Sutton, 2000) is:
for v = 1 to Nv — the total number of voxels along the skeleton, or the total number of ROIs; subscripts 1 and 2 refer to the two datasets used in this analysis.
-
Weight the heritability from each study by the heritability standard error, as extracted from the variance component model of Solar. The heritability weighted by standard error (Sutton, 2000) is:
for v = 1 to Nv — the total number of voxels along the skeleton, or the total number of ROIs; subscripts 1 and 2 refer to the two datasets used in this analysis.
As the heritability for both datasets was computed with SOLAR, the standard error for the heritability at each voxel was also available. In an analogous way, we also computed the joint standard error by weighting estimates from each cohort by its sample size.
Mega analysis
In addition to meta-analysis, we jointly analyze the two separate cohorts in a mega-analysis of heritability. A mega-analysis program developed for the SOLAR (Blangero et al., 2005) computer package was implemented on the LONI Pipeline infrastructure (Dinov et al., 2010) for mega-analysis of heritability on both a voxelwise and an ROI level. Meta-analysis approaches fit separate models, while a mega-analysis fits a single model that allows certain parameters to be shared over datasets. Thus, especially for combining a small number of datasets, the mega-analysis approach may be more efficient, though necessarily makes more assumptions. Primarily, we assume that the pattern of inheritance of the trait is similar among the populations. We then force the phenotype to have the same distribution for each population. In the mega-analysis, we specifically test that the degree of shared genetic variance is not different between populations before combining them. To do this, we fit the model separately first for each cohort and test for the difference in the heritability values. A joint pedigree structure was produced by merging the kinship matrices for QTIM and GOBS cohorts. For each of the cohorts, a model was fitted including adjustment for covariates and finding the inverse normal transformation of the traits. Individual cohort heritability estimates can be obtained and using the full pedigree structure and the normalized FA values, a joint heritability estimate can be obtained.
Region of interest (ROI) extraction
Regions of interest were parcellated from the ENIGMA target in ICBM space according to the multi-subject JHU white matter parcellation atlas described by Mori et al. (2008). Here, we removed several regions that are often cropped out of the imaging field of view (FOV), which could lead to unstable and unreliable estimates. For heritability analysis, in some cases, we joined together several regions of the same tract. This was done to aggregate data from regions expected to behave in a relatively homogeneous way, and to avoid analyzing very small regions, which may suffer from various levels of partial voluming depending on the imaging protocol.
For example, the internal capsule is comprised of the left and right anterior limb, posterior limb, and retrolenticular parts of the internal capsule, as defined in the atlas. An overall mask was created from all these regions and the average FA value within this entire mask was considered to be the average value within the full bilateral region. Our protocols and executables, which are publicly available (http://enigma.loni.ucla.edu/ongoing/dti-working-group/), provide mean FA value information for all portions of these combined tracts for each hemisphere, but in our analysis here we focus on the combined bilateral measures.
Additionally, we analyze the average FA value along the full skeleton (including all peripheral voxels not included in any of the aforementioned parcellations). A generalized workflow of our processing can be seen in Fig. 1.
Fig. 1.
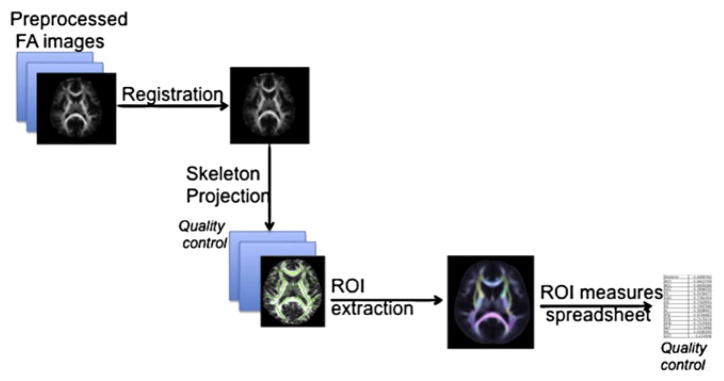
A generalized workflow for ENIGMA–DTI. Preprocessed images are registered to the ENIGMA–DTI template, and skeletal projection is performed using TBSS (Smith et al., 2006) in FSL software. Common ROIs are extracted and averaged and all information is stored in a spreadsheet. Various quality control steps are also implemented to identify outliers.
A final list of regions used in this paper is shown in Table 2.
Table 2.
Regions of interest parcellated on the white matter skeleton of the ENIGMA template, according to the JHU White Matter Atlas (Mori et al., 2008).
| Average skeleton FA | |
|---|---|
| GCC | Genu of the corpus callosum |
| BCC | Body of corpus callosum |
| SCC | Splenium of corpus callosum |
| FX | Fornix |
| CGC | Cingulum (cingulate gyrus) — L and R combined |
| CR | Corona radiata — L and R anterior and posterior sections combined |
| EC | External capsule — L and R combined |
| IC | Internal capsule — L and R anterior limb, posterior limb, and retrolenticular parts combined |
| IFO | Inferior fronto-occipital fasciculus — L and R combined |
| PTR | Posterior thalamic radiation — L and R combined |
| SFO | Superior fronto-occipital fasciculus |
| SLF | Superior longitudinal fasciculus |
| SS | Sagittal stratum (include inferior longitudinal fasciculus and inferior fronto-occipital fasciculus) — L and R combined |
| CST | Corticospinal tract |
Factor analysis
To obtain a general estimate of FA heritability, we perform an exploratory factor analysis on all ROIs examined using the covariance structure of each cohort independently. The analysis was performed using the ‘psych’ package in the statistical software ‘R’ to obtain a single factor score with maximum likelihood estimation and a default oblimin rotation.
Covariates and multiple comparison correction
Covariates were chosen to be consistent for both datasets. For all methods of analysis and for both datasets, these standard covariates included age, sex, age-squared, age-by-sex interaction, and age-squared by sex interaction.
Performing multiple statistical tests, whether at each voxel, or for each ROI, inflates the chance of reporting false positives at a given significance threshold. We use two different approaches to controlling false positives, the false discovery rate (FDR) (Genovese et al., 2002) and familywise error rate (FWE) (Nichols and Hayasaka, 2003). FDR is a more lenient measure, controlling the average proportion of false positives among the detected voxels or ROIs, whereas FWE is more specific (but less powerful), controlling the chance any false positive voxels or ROIs. We report FDR-corrected significances for both voxel-wise and ROI analyses. Obtaining FWE inferences that account for dependence between tests that require permutation methods (Nichols and Hayasaka, 2003) was additionally conducted on the ROI data.
Permutation inference must be performed in a way that takes into account the dependence in the data. For the twin sample, the null hypothesis of no heritability allows randomly exchanging the MZ and DZ labels on twin pairs (twins pairs are kept intact, to control for common environmental effects). For the pedigree sample, the null hypothesis means that family members are exchangeable, and so we randomly permute the phenotypes of subjects within families while ensuring that all covariates remain linked to each individual. 1000 permutations were used for each test.
Results
The template (Fig. 2, bottom row) derived from FA images from four sites with relatively high resolution DTI may be found, along with its corresponding skeleton for TBSS processing here: http://enigma.loni.ucla.edu/wp-content/uploads/2012/06/enigmaDTI.targets.tar.gz.
Fig. 2.
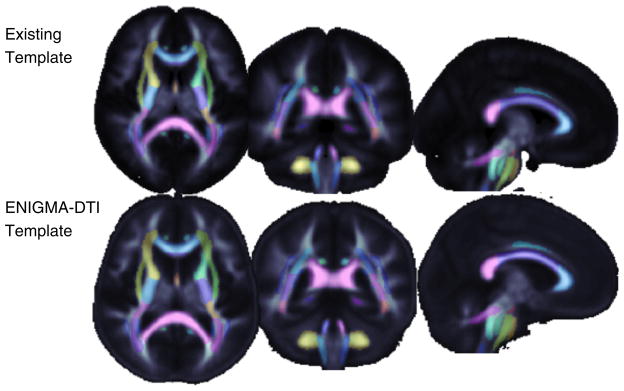
The Johns Hopkins University FA template is compared to the ENIGMA–DTI FA template, both in standard MNI space. The ENIGMA–DTI FA template was created from 400 subject (200 M/200 F) FA maps obtained with high spatial and directional resolution imaging at 4 independent sites.
This section is organized as follows:
ENIGMA template: We present the results of the average deformation (measured as the determinant of the Jacobian matrix at every voxel derived from the nonlinear registration deformation fields) across the full brain when registering the FA images from each cohort’s subjects to the ENIGMA template as well as the JHU FA template.
-
Heritability results:
QTIM Twin and GOBS Pedigree Comparison: Heritability using SOLAR was computed for both cohorts. We computed the correlation between the heritability of two cohorts on a voxelwise level.
Meta-analysis of both samples as weighted by sample size and by standard error. Meta analysis weighted by standard error is more powerful in this case as heritability in a twin sample can be estimated with a smaller total N than is the case for a pedigree sample.
-
Exploratory analyses:
Mega-analysis: an analysis of heritability is conducted using the information from both cohorts simultaneously, and permutation testing enables the visualization of the null distribution. Jointly analyzing the samples is possibly advantageous for picking up heritability effects.
Factor analysis: a non-localized measure of general FA heritability is investigated. Regional associations may serve as more powerful phenotypes.
ENIGMA–DTI FA template
Fig. 2 provides a visual comparison of the existing template with the high resolution template created from 400 subjects here, 200M/200F, from 4 separate imaging studies.
Despite the stereotaxic similarities between the original template and the ENIGMA–DTI template, a single image registration to each one will produce different deformations primarily along tract peripheries where the templates differ most. Table 3 shows an analysis of the average deformation (measured from the determinant of the Jacobian matrix at every voxel derived from the nonlinear registration deformation fields) across the full brain when registering the FA images from each cohort’s subjects to the existing JHU template and the newly created ENIGMA–FA template. All datasets show registration improvements, i.e., less overall deformation necessary, when the data were registered to the ENIGMA–DTI template. Significant improvement was also seen in UMCU, a cohort not used in the creation of the template, although the difference was not as pronounced.
Table 3.
Average deformations (measured as the determinant of the Jacobian matrix at every voxel derived from the nonlinear registration deformation fields) are listed across the entire skull stripped brain when registering the FA images from each cohort’s subjects to the existing JHU template and the newly created ENIGMA–FA template. When comparing individuals from each site, there was a significant reduction in the amount of overall deformation required to warp the brains. Although the difference was not as pronounced, the significance and lower deformation level was also true for the UMCU data, which was not included in the creation of the template.
| Average deformation | JHU template | ENIGMA–DTI template | Paired t-test
|
|---|---|---|---|
| p-Value | |||
| GOBS | 0.3905 | 0.0555 | <1 × 10−06 |
| QTIM | 0.3506 | 0.0374 | <1 × 10−06 |
| BFS | 0.3581 | 0.0595 | <1 × 10−06 |
| LBC | 0.0653 | 0.0026 | <1 × 10−06 |
| UMCU | 0.3961 | 0.3178 | <1 × 10−06 |
Whereas the target was created from healthy subjects only, approximately half the UMCU sample used for validation was comprised of schizophrenic patients. When broken down by sex into patient and control groups (Table 4), each subgroup showed less overall registration deformation towards the ENIGMA–DTI template, with less variance in the population. No statistical differences were found within control or patients per protocol, ensuring the ENIGMA–DTI template, as well as the JHU template, is not biasing towards healthy controls of similar sex and age.
Table 4.
When broken down by sex into patient and control groups, each subgroup showed less overall registration deformation towards the ENIGMA–DTI template, with less variance in the population. No statistical differences were found within control or patients between either the JHU template or the ENIGMA template. This suggests that both templates are not biased towards healthy controls of similar sex and age.
| UMCU | Patients
|
Controls
|
||
|---|---|---|---|---|
| Male | Female | Male | Female | |
| N-subjects | 21 | 28 | 29 | 22 |
| Age in years (sd) | 27.7 (7.3) | 27.0 (8.4) | 25.9 (5.2) | 28.3 (6.9) |
| ENIGMA–DTI Jacobian (sd) | 0.316 (0.046) | 0.308 (0.055) | 0.317 (0.042) | 0.332 (0.053) |
| JHU Jacobian (sd) | 0.393 (0.131) | 0.388 (0.122) | 0.376 (0.129) | 0.435 (0.129) |
Additionally, we analyzed the projection distances of this independent cohort to find that in general, the average projection distance was reduced when using the ENIGMA–DTI template. These differences may be due to factors including the wide age range of the subjects that make up the template, or the increased spatial resolution of the images used for template construction.
Multi-site heritability using twin and pedigree samples
To determine whether regions of interest along the skeleton would result in similar heritability estimates regardless of which template is used to define them, for the QTIM sample, we estimated heritability based on ROIs from both the JHU and ENIGMA templates for registration and skeletonization. As expected, no significant differences were found in heritability estimates across the 15 ROIs, and all heritability values of a region using one template were almost identical or within the standard error of the same measure using the other template. This is shown in Fig. 3.
Fig. 3.

Heritability comparison using two templates. For the QTIM sample, we estimated heritability based on ROIs from both the JHU and ENIGMA templates for registration and skeletonization. As expected, no significant differences were found in heritability estimates across the 15 ROIs, and all heritability values of a region using one template were almost identical or within the standard error of the same measure using the other template.
Fig. 4 shows, qualitatively, various 2D image slices comparing heritability results in the QTIM sample with GOBS.
Fig. 4.

We can visually compare voxelwise heritability values computed from the two cohorts. QTIM is a twin sample of 146 twin pairs of European ancestry and GOBS is a pedigree sample of Mexican–American ancestry. Despite differences in the cohort demographics and image acquisitions, similar profiles are seen in the voxelwise heritability along the white matter skeleton. Warmer colors indicate that a higher proportion of the overall variance is due to genetic factors. For improved visualization the skeleton was dilated with 3 × 3 × 3 maximum kernel.
In Fig. 5, we plot the voxel heritability values of one sample versus the other and examine the correlation between the two on a voxelwise level. Moderate correlations are seen overall at ρ = 0.50.
Fig. 5.

Heritability of the GOBS sample and the QTIM sample are moderately correlated (r = 0.51) at a voxelwise level. Contour plots show the densities of distribution. The heritability of all the voxels along the skeleton is plotted against each other for each cohort. The solid line reflects the best fitting linear relation between the x and y coordinates, as denoted by the equation.
Meta and mega analyses
To combine results from both samples and obtain an overall estimate of heritability per voxel, we first meta-analytically combine the heritability results and additionally analyze the heritability of both cohorts together through a large mega analysis. Fig. 6 shows the results of both the meta- and mega-analyses. The heritability result of the meta-analysis weighted by the sample size follows closely the distribution of the GOBS sample, as is expected as the sample size is much larger. The mega-analysis shows greater heritability overall. Fig. 7 plots the voxelwise correlation between the two types of analyses for both heritability estimate and significance values. Despite differences in the magnitude of both sets of values, we find that the voxelwise correlation between the two methods is extremely high (0.88 for N weighted and 0.89 for SE weighted) (Fig. 8).
Fig. 6.

We can visually compare voxelwise heritability values of the two types of combined analysis, meta and mega. Meta-analysis is performed by sample size weighting, and as would be expected, the meta analysis heritability is quite similar to that of the GOBS cohort, which had a much larger sample size. The mega analysis shows greater heritability estimates overall. Warmer colors indicate that a higher portion of the overall variance is due to heritability. For improved visualization the skeleton was dilated with 3 × 3 × 3 maximum kernel.
Fig. 7.

Comparisons of heritability results from meta- and mega-analyses. The left panel shows the correlation between the heritability of the meta-analysis weighted by the sample size (MA-N) and the right panel shows that for the meta-analysis weighted by standard error (MA–SE). There is a high correlation of r = 0.88 and r = 0.89, respectively, between the two methods of meta analysis and mega-analysis. Contour plots show the densities of distribution. The meta-analyses themselves are also highly correlated at r = 0.97, although heritability values are significantly different as shown through a t-test (p < 10−10). The solid line reflects the best fitting linear relation between the x and y coordinates, as denoted by the equation.
Fig. 8.

The cumulative distribution function of the p-values obtained is plotted against the null expected p-values from a normal distribution. If the spread of the distribution follows that of the dotted line y = x, then a normal distribution is observed. If the slope of the curve is steeper than the y = 20x solid black line, then the distribution of p-values is significant according to the false discovery rate procedure. The steeper the slope of the line is, the greater the heritability effect. The FDR-critical p-value is the point at which the curve crosses the y = 20x line. The close the FDR critical p-value is to 0.05 (the higher it is), the greater the portion of the image that can be claimed to have significant heritability while ensuring the false positive rate is maintained at 0.05. The FDR critical p-values are: QTIM: 0.0315, GOBS: 0.0322, Meta analysis (N): 0.0325, Meta analysis (SE): 0.0330, Mega analysis 0.0437.
In order to adjust our analyses for multiple testing and the likelihood of false positives from over 100,000 voxelwise tests performed on the white matter skeleton, we use the false discovery rate (FDR) procedure, as described in the Methods. We plot the cumulative distribution function of the sorted p-values from the variance component heritability tests from both individual cohorts as well as both the meta- and mega-analyses to show the relative effect size of each cohort and analysis in Fig. 9. The cumulative distribution function (cdf) of the p-values is plotted against the null expected p-values. If the distribution follows the identity (dotted line, y = x), then the data are consistent with noise. If the curve exceeds y = 20x (i.e., y = x/0.05, to control FDR at 5%; solid black line), then the distribution of p-values is significant according to the false discovery rate procedure. The FDR-critical p-value is the point at which the curve crosses the y = 20x line. The close the FDR critical p-value is to 0.05 (the higher it is), the greater the portion of the image that can be claimed to have significant heritability while ensuring the false positive rate is maintained at 0.05. The FDR critical p-values for the plotted lines are: QTIM: 0.0315, GOBS: 0.0322, MA-N: 0.0325, MA–SE: 0.0330, mega-analysis: 0.0437. The mega analysis has the greatest effect, followed by the meta-analysis weighted by the standard deviation. Each individual cohort and the meta analyses have roughly the same effect. The significance of all analyses remains after multiple comparison correction using FDR.
Fig. 9.
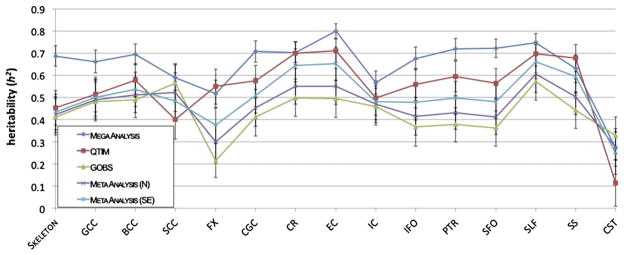
Here we show the proportion of the variance that was estimated to be due to genetic factors for each region listed in Table 2 for each of the two cohorts, as well as for both the meta and mega analyses. For most regions, except for the fornix and the CST, all analyses show high heritability, between 0.4 and 0.8.
Heritability was also assessed for regions of interest parcellated on the JHU white mater atlas. Regions were averaged bilaterally and average tract measures are reported.
Fig. 9 shows the proportion of the variance that was estimated to be due to heritability for each region for each of the two cohorts when registered to the ENIGMA–DTI template, as well as for both the meta and mega analyses. The majority of regions, for all analyses, show high levels of heritability between 0.4 and 0.8. The trend of the meta-analyses weighted by the sample size follows closely that of the GOBS sample, which is expected as GOBS has a much larger sample size. However, the meta-analysis weighted by the standard error is a better medium between the two samples, as the smaller twin design has added power for estimating heritability. The superior longitudinal fasciculus, the external capsule, the corona radiata, and the body of the corpus callosum reliably show high levels of heritability. The corticospinal tract and fornix regions are the least heritable overall. This can be expected as both are rather small and can be difficult to register appropriately. The significance of the heritability of these regions is listed in Table 5 for each cohort and for the meta and mega analyses. 1000 permutations for the data in each cohort were also performed to obtain a null distribution on the heritability and significance estimates on the individual cohorts and the mega-analysis. Note that 1000 permutations lead to a minimum possible p-value of 0.001. According to permutation results, the most significantly heritable regions were the genu, body, and splenium of the corpus callosum, the superior longitudinal fasciculus, the sagittal stratum, and the corona radiata all at p < 0.005.
Table 5.
The significance of the heritability in the ROIs is listed for each cohort and for the meta and mega analyses. 1000 permutations for the data in each cohort were also performed to obtain a null distribution on the heritability and significance estimates on the individual cohorts and the mega-analysis.
| Region of interest | Meta (SE) P | Meta (N) P | Mega P | Mega P perm | QTIM P | QTIM P perm | GOBS P | GOBS P perm |
|---|---|---|---|---|---|---|---|---|
| Skeleton | 6.35E-07 | 3.34E-07 | <1 × 10⁻¹⁰ | 0.750 | 1.30E-6 | 0.359 | 6.48E-09 | 0.137 |
| GCC | 8.92E-08 | 5.12E-08 | <1 × 10⁻¹⁰ | 0.001 | 2.00E-7 | 0.194 | 6.35E-10 | 0.004 |
| BCC | 7.84E-09 | 4.25E-09 | <1 × 10⁻¹⁰ | 0.001 | 1.68E-08 | 0.616 | <1 × 10⁻¹⁰ | 0.001 |
| SCC | 2.46E-05 | 1.22E-05 | <1 × 10⁻¹⁰ | 0.004 | 5.00E-05 | 1.000 | <1 × 10⁻¹⁰ | 0.028 |
| FX | 3.90E-05 | 6.02E-04 | <1 × 10⁻¹⁰ | 0.040 | 4.16E-08 | 0.519 | 0.00083 | 0.005 |
| CGC | 1.58E-08 | 1.93E-08 | <1 × 10⁻¹⁰ | 0.710 | 2.03E-09 | 0.053 | 2.52E-08 | 0.001 |
| CR | <1 × 10⁻¹⁰ | <1 × 10⁻¹⁰ | <1 × 10⁻¹⁰ | 0.003 | <1 × 10⁻¹⁰ | 0.003 | <1 × 10⁻¹⁰ | 0.001 |
| EC | 3.21E-10 | 3.31E-10 | <1 × 10⁻¹⁰ | 0.240 | <1 × 10⁻¹⁰ | 0.046 | 4.44E-10 | 0.001 |
| IC | 9.29E-08 | 5.13E-08 | <1 × 10⁻¹⁰ | 0.034 | 2.00E-7 | 0.121 | 8.01E-10 | 0.004 |
| IFO | 9.35E-07 | 1.19E-06 | <1 × 10⁻¹⁰ | 0.009 | 5.84E-09 | 0.001 | 1.60E-6 | 0.001 |
| PTR | 2.19E-09 | 2.65E-09 | <1 × 10⁻¹⁰ | 0.026 | 8.59E-10 | 0.415 | 3.26E-09 | 0.001 |
| SFO | 5.91E-08 | 7.48E-08 | <1 × 10⁻¹⁰ | 0.871 | 7.64E-10 | 0.525 | 1.00E-07 | 0.001 |
| SLF | <1 × 10⁻¹⁰ | <1 × 10⁻¹⁰ | <1 × 10⁻¹⁰ | 0.001 | <1 × 10⁻¹⁰ | 0.007 | <1 × 10⁻¹⁰ | 0.001 |
| SS | 6.92E-10 | 8.01E-10 | <1 × 10⁻¹⁰ | 0.002 | <1 × 10⁻¹⁰ | 0.001 | 1.07E-09 | 0.001 |
| CST | 0.0914 | 0.0369 | 4 × 10⁻⁷ | 0.246 | 0.146 | 0.974 | 2.00E-06 | 0.942 |
Note 1000 permutations lead to a minimum possible p-value of 0.001.
As a further exploration of a general factor of FA, we performed a factor analysis of all regions of interest and estimated the per-cohort and overall heritability. The heritability for the GOBS cohort was h2 = 0.36 (SE = 0.08), for QTIM h2 = 0.59 (SE = 0.07), the SE-weighted meta-analysis was therefore h2 = 0.45, and the mega-analyzed heritability estimate was h2 = 0.55 (p < 1 × 10⁻¹⁰), suggesting that the general FA factor heritability is not as high as examining specific localized regions.
Discussion
The protocol harmonization work presented here aims to serve as a foundation for multi-site meta-analytic studies with a focus on diffusion tensor neuroimaging genetics. Our analysis had several main results:
We created a publicly available FA template composed of images from 4 sites, each of which included 50 male and 50 female subjects ranging from age 18 to 85. These sites differed in study population and imaging protocols, although all diffusion imaging protocols had relatively high spatial and directional resolution.
We showed the usefulness and practicality of our pipeline for multi-site imaging-genetics studies by computing heritability voxelwise along the FA-skeleton from two datasets, allowing us to find moderate correlations between heritability in two datasets different in family structure, ethnicity, and image acquisition.
Our meta-analysis weighted by the standard error was more accurate and less biased than one weighted by the sample size in this situation, suggesting that a mega-analysis of gene effects may show promise for future studies.
We partitioned the images into white matter regions of interest based on the JHU white matter atlas and found tracts and regions with corresponding high levels of heritability to rank regional phenotypes from FA images.
We made our template and its skeletonized FA map available to the public and provide protocols for worldwide meta-analysis, so that groups at any site can harmonize scans for readily extendible meta-analytical applications of brain mapping (http://enigma.loni.ucla.edu/ongoing/dti-working-group/), with explicit promise for imaging genetic studies.
As voxelwise and skeleton-wise analyses require that all images be registered to a common space, we registered all our images to both our template and the existing JHU template to observe the differences in the amount of overall deformation. As expected and shown in Table 1, all datasets require, on average, less overall deformations when being registered to the ENIGMA–DTI template as compared to the current standard multi-subject DTI-FA template. Despite improvements in registration, our template is not meant to alter anatomic localization of existing tract regions of interest. In fact, we showed here that there is no statistical difference in the heritability (h2 values, standard errors, or significance) in the regions of interest when either template is used. Therefore, results from previous studies using the current standard template could still be valid using this template, yet due to the large sample size and high resolution images used to obtain the ENIGMA–DTI-FA template, we predict it would allow for a wider variety of cohorts to map their individual data to the standard space with less variability and registration error.
Much effort has been dedicated to understanding the sources of variability in multi-site DTI studies and developing harmonized protocols using clinical or phantom data (Walker et al., 2012), or both (Teipel et al., 2011; Zhan et al., 2012). These efforts are of high value when starting new large multicenter imaging studies and can help identify outliers or problems at scan sites before the analysis is underway. However, these efforts are only applicable for data that has yet to be acquired and, despite the projected size of the study, will still be only limited to that study itself. Some multicenter studies, such as the Alzheimer’s Disease Neuroimaging Initiative, or ADNI (Weiner et al., 2012), harmonized their image acquisition protocols at the outset, but a far larger sample can be amassed if data can be combined from multiple studies that were initially planned and performed independently. Our harmonization scheme here is intended to complement such efforts after data has already been collected, so that study groups can compare, contrast and meta-analyze various DTI-based analyses in the same space. One of the most pressing and fundamental aspects of all scientific research is the ability to reproduce and replicate findings, as consistently replicated results are the only way to guarantee true positives in scientific research. This is particularly clear in the search for genetic associations to traits.
There are also genetic correlations, i.e. a common proportion of variance that two traits share because of common genetic influences — between FA and other traits such as intellectual performance (Chiang et al., 2009) or cerebrovascular measures (Kochunov et al., 2011a; Jahanshad et al., 2012b). Due to this, FA may be a promising target for genetic analyses but may also be used to identify genetic variants with pleiotropic relations to disease. Additionally, there is some evidence that FA is altered in groups of individuals with genetic variants that may put them at higher risk for certain brain diseases. FA differences are found in carriers of common variants in genes associated with neurodegeneration such as APOE (Honea et al., 2009; Jahanshad et al., 2012d; Westlye et al., 2012), CLU (Braskie et al., 2011a), HFE (Jahanshad et al., 2012b), as well as genes associated with psychiatric disorders including BDNF (Chiang et al., 2011a; Carballedo et al., 2012), DISC1 (Sprooten et al., 2011b), neuregulin and neurotrophin-related genes (Braskie et al., 2012; McIntosh et al., 2008; Zuliani et al., 2011) and several others. Several of these variants may even be combined to help predict FA in young normal adults (Kohannim et al., 2012).
Here, we use two datasets, a Caucasian twin sample, and a large Mexican–American pedigree, to individually and jointly analyze the heritability in order to narrow down regions of the image where we might expect a meta-analytical GWAS study to help discover new genetic loci influencing brain structure and potential risk for disease. Whereas heritability is considered a property of the population under study, and may not be appropriately meaningful as a single parameter estimate across various populations, our meta-analytic efforts here are designed to map brain regions that are heritable in different populations despite variability in population ethnicity, structure, and variations due to image acquisition. Meta-analytic approaches as described above have been successful in narrowing down trait heritability estimates across populations for a more general genome-wide scan. As an exploratory analysis, and because we began with a limited number of cohorts for meta-analysis, we jointly analyzed the two separate cohorts in a mega-analysis of heritability. For a trait to be found to be heritable in the mega-analysis, the reliability of the trait within and across cohorts must be high. We can use this approach to map, on a voxelwise level, an estimate of heritability that may be unreliable in single site analyses while taking into account reliability across cohorts and, hence, image acquisition parameters. Mega analysis may be more powerful than meta-analysis in this case, although larger studies of voxelwise white matter heritability and genetic associations are needed to confirm the findings.
For a more regional analysis, we also examined the heritability of mean FA along parcellated white matter labels representing specific tracts. Almost all regions, except the corticospinal tract, exhibited high heritability across and within the cohorts. This suggests that if not specifically imaged for a study, the CST may not serve as a reliable endophenotype, particularly when combining multi-site data with different acquisitions. Genetic studies involving whole-brain analyses with results concentrated in the CST should be approached cautiously. Certain regions were shown to be more heritable than the overall mean FA across the skeleton and a general factor derived from all ROIs, confirming that the genetic influence over brain structure is not uniform; hence, a prioritization of regions with highest heritability may help accelerate the search for specific genetic influences on brain structure. Regions (averaged bilaterally) that showed the greatest heritability overall are the superior longitudinal fasciculus, the sagittal stratum, the external capsule, the corona radiata, and the body of the corpus callosum. These were consistently found to be highly heritable despite differences in image acquisition between the two groups and the different ethnic backgrounds of the two cohorts.
A mean measure from these specific regions or tracts may serve as a good endophenotype, by independently showing high heritability for at least one of the measures (Brouwer et al., 2010; Gatt et al., 2012) (although these studies also found high heritability elsewhere as well), by showing genetic associations with white matter alterations in one or more of these regions (Barnes et al., 2012; Sprooten et al., 2011b) or by associating the mean measure to a genetically-mediated disease such as Rett Syndrome (Mahmood et al., 2010), psychosis (Karlsgodt et al., 2009) or schizophrenia (Clark et al., 2011).
If brain measures are more strongly affected by risk-associated genetic variation than clinical or behavioral measures, more efficient association studies could be designed using imaging measures as quantitative traits, However, at this point, it is not clear if imaging genetics studies require smaller samples compared to those in case–control designs. We previously aggregated evidence from over 20,000 MRI scans to discover genome-wide significant variants that consistently affect the brain (Stein et al., 2012), providing further evidence in support of imaging genetics.
This study, from the ENIGMA–DTI working group, was conducted to identify reliably measured endophenotypes from FA maps that are computable, in principle, from dozens of DTI studies worldwide. Consortium efforts are indeed needed to help discover the genes that affect the living human brain. Mapping out the statistical effects of these genes in a common space will help us understand the mechanistic properties of genes that influence behavior, cognition, and neurological diseases.
Conclusion
Our template, and its skeletonized FA map are readily available (http://enigma.loni.ucla.edu/ongoing/dti-working-group/). We provide protocols for interested parties to have their images skeletonized and transformed into the same space as our template using FSL’s TBSS pipeline, and to extract lateral and bilateral mean FA values from the skeletonized regions of interest from the JHU parcellated white matter atlas already popular in many clinical DTI studies. Results will be made public and downloadable on voxel-wise and region of interest levels for future, larger meta-analytical approaches of variance components based heritability estimates of white matter integrity. We hope the work presented as a part of this working group, and the rest of the ENIGMA efforts, emphasizes the power of imaging harmonization programs for previously collected data, allowing for increased power and replication across the neuroimaging community.
Uncited references
Acknowledgments
This study was supported by R01 HD050735 to PT, R01 EB015611 to PK, MH0708143 and MH083824 grants to DCG, MH078111 to JB. SOLAR is supported by MH59490 to JB. The QTIM study was supported by National Health and Medical Research Council (NHMRC 486682), Australia. Additional support for algorithm development was provided by NIH R01 grants EB008432, EB008281, and EB007813 (to PT). GdZ is supported by an ARC Future Fellowship (FT0991634). JES is supported by a Clinical Research Training Fellowship from the Wellcome Trust (087727/Z/08/Z). AMM is supported by a NARSAD Independent Investigator Award and by a Scottish Funding Council Senior Clinical Fellowship. Data collection for the Bipolar Family Study was supported by an Academy of Medical Sciences/Health Foundation Clinician Scientist Fellowship to AMM.
Footnotes
The meta-analysis uses an aggregation of statistics derived from each cohort, but the mega individually normalizes each cohort, and then pools all data after joining cohort kinship structures before estimating heritability, See Methods for more details.
References
- Almasy L, Blangero J. Multipoint quantitative-trait linkage analysis in general pedigrees. Am J Hum Genet. 1998;62:1198–1211. doi: 10.1086/301844. [DOI] [PMC free article] [PubMed] [Google Scholar]
- Amos CI. Robust variance-components approach for assessing genetic linkage in pedigrees. Am J Hum Genet. 1994;54:535–543. [PMC free article] [PubMed] [Google Scholar]
- Barnes A, Isohanni M, Barnett JH, Pietilainen O, Veijola J, Miettunen J, Paunio T, Tanskanen P, Ridler K, Suckling J, Bullmore ET, Jones PB, Murray GK. Neuregulin-1 genotype is associated with structural differences in the normal human brain. NeuroImage. 2012;59:2057–2061. doi: 10.1016/j.neuroimage.2011.10.007. [DOI] [PubMed] [Google Scholar]
- Barysheva M, Jahanshad N, Foland-Ross L, Altshuler LL, Thompson PM. White Matter Microstructural Abnormalities in Bipolar Disorder: A Whole Brain Diffusion Tensor Imaging Study. 2013. (submitted for publication) [DOI] [PMC free article] [PubMed] [Google Scholar]
- Basser PJ, Pierpaoli C. Microstructural and physiological features of tissues elucidated by quantitative-diffusion-tensor MRI. J Magn Reson B. 1996;111:209–219. doi: 10.1006/jmrb.1996.0086. [DOI] [PubMed] [Google Scholar]
- Basser PJ, Mattiello J, LeBihan D. MR diffusion tensor spectroscopy and imaging. Biophys J. 1994;66:259–267. doi: 10.1016/S0006-3495(94)80775-1. [DOI] [PMC free article] [PubMed] [Google Scholar]
- Bezdjian S, Baker LA, Tuvblad C. Genetic and environmental influences on impulsivity: a meta-analysis of twin, family and adoption studies. Clin Psychol Rev. 2011;31:1209–1223. doi: 10.1016/j.cpr.2011.07.005. [DOI] [PMC free article] [PubMed] [Google Scholar]
- Bis JC, DeCarli C, Smith AV, van der Lijn F, Crivello F, Fornage M, Debette S, Shulman JM, Schmidt H, Srikanth V, Schuur M, Yu L, Choi SH, Sigurdsson S, Verhaaren BF, DeStefano AL, Lambert JC, Jack CR, Jr, Struchalin M, Stankovich J, Ibrahim-Verbaas CA, Fleischman D, Zijdenbos A, den Heijer T, Mazoyer B, Coker LH, Enzinger C, Danoy P, Amin N, Arfanakis K, van Buchem MA, de Bruijn RF, Beiser A, Dufouil C, Huang J, Cavalieri M, Thomson R, Niessen WJ, Chibnik LB, Gislason GK, Hofman A, Pikula A, Amouyel P, Freeman KB, Phan TG, Oostra BA, Stein JL, Medland SE, Vasquez AA, Hibar DP, Wright MJ, Franke B, Martin NG, Thompson PM, Nalls MA, Uitterlinden AG, Au R, Elbaz A, Beare RJ, van Swieten JC, Lopez OL, Harris TB, Chouraki V, Breteler MM, De Jager PL, Becker JT, Vernooij MW, Knopman D, Fazekas F, Wolf PA, van der Lugt A, Gudnason V, Longstreth WT, Jr, Brown MA, Bennett DA, van Duijn CM, Mosley TH, Schmidt R, Tzourio C, Launer LJ, Ikram MA, Seshadri S. Common variants at 12q14 and 12q24 are associated with hippocampal volume. Nat Genet. 2012;44:545–551. doi: 10.1038/ng.2237. [DOI] [PMC free article] [PubMed] [Google Scholar]
- Blangero J, Goring HH, Kent JW, Jr, Williams JT, Peterson CP, Almasy L, Dyer TD. Quantitative trait nucleotide analysis using Bayesian model selection. Hum Biol. 2005;77:541–559. doi: 10.1353/hub.2006.0003. [DOI] [PubMed] [Google Scholar]
- Blokland GA, de Zubicaray GI, McMahon KL, Wright MJ. Genetic and environmental influences on neuroimaging phenotypes: a meta-analytical perspective on twin imaging studies. Twin Res Hum Genet. 2012;15:351–371. doi: 10.1017/thg.2012.11. [DOI] [PMC free article] [PubMed] [Google Scholar]
- Boker S, Neale M, Maes H, Wilde M, Spiegel M, Brick T, Spies J, Estabrook R, Kenny S, Bates T, Mehta P, Fox J. OpenMx: an open source extended structural equation modeling framework. Psychometrika. 2011;76:306–317. doi: 10.1007/s11336-010-9200-6. [DOI] [PMC free article] [PubMed] [Google Scholar]
- Boos HB, Mandl RC, van Haren NE, Cahn W, van Baal GC, Kahn RS, Hulshoff Pol HE. Tract-based diffusion tensor imaging in patients with schizophrenia and their non-psychotic siblings. Eur Neuropsychopharmacol. 2012 doi: 10.1016/j.euroneuro.2012.05.015. [DOI] [PubMed] [Google Scholar]
- Braskie MN, Jahanshad N, Stein JL, Barysheva M, McMahon KL, de Zubicaray GI, Martin NG, Wright MJ, Ringman JM, Toga AW, Thompson PM. Common Alzheimer’s disease risk variant within the CLU gene affects white matter microstructure in young adults. J Neurosci. 2011a;31:6764–6770. doi: 10.1523/JNEUROSCI.5794-10.2011. [DOI] [PMC free article] [PubMed] [Google Scholar]
- Braskie MN, Ringman JM, Thompson PM. Neuroimaging measures as endophenotypes in Alzheimer’s disease. Int J Alzheimers Dis. 2011b;2011:490140. doi: 10.4061/2011/490140. [DOI] [PMC free article] [PubMed] [Google Scholar]
- Braskie MN, Jahanshad N, Stein JL, Barysheva M, Johnson K, McMahon KL, de Zubicaray GI, Martin NG, Wright MJ, Ringman JM, Toga AW, Thompson PM. Relationship of a variant in the NTRK1 gene to white matter microstructure in young adults. J Neurosci. 2012;32:5964–5972. doi: 10.1523/JNEUROSCI.5561-11.2012. [DOI] [PMC free article] [PubMed] [Google Scholar]
- Brouwer RM, Mandl RC, Peper JS, van Baal GC, Kahn RS, Boomsma DI, Hulshoff Pol HE. Heritability of DTI and MTR in nine-year-old children. NeuroImage. 2010;53:1085–1092. doi: 10.1016/j.neuroimage.2010.03.017. [DOI] [PubMed] [Google Scholar]
- Carballedo A, Amico F, Ugwu I, Fagan AJ, Fahey C, Morris D, Meaney JF, Leemans A, Frodl T. Reduced fractional anisotropy in the uncinate fasciculus in patients with major depression carrying the met-allele of the Val66Met brain-derived neurotrophic factor genotype. Am J Med Genet B Neuropsychiatr Genet. 2012;159B:537–548. doi: 10.1002/ajmg.b.32060. [DOI] [PubMed] [Google Scholar]
- Chen CH, Gutierrez ED, Thompson W, Panizzon MS, Jernigan TL, Eyler LT, Fennema-Notestine C, Jak AJ, Neale MC, Franz CE, Lyons MJ, Grant MD, Fischl B, Seidman LJ, Tsuang MT, Kremen WS, Dale AM. Hierarchical genetic organization of human cortical surface area. Science. 2012;335:1634–1636. doi: 10.1126/science.1215330. [DOI] [PMC free article] [PubMed] [Google Scholar]
- Chiang MC, Barysheva M, Shattuck DW, Lee AD, Madsen SK, Avedissian C, Klunder AD, Toga AW, McMahon KL, de Zubicaray GI, Wright MJ, Srivastava A, Balov N, Thompson PM. Genetics of brain fiber architecture and intellectual performance. J Neurosci. 2009;29:2212–2224. doi: 10.1523/JNEUROSCI.4184-08.2009. [DOI] [PMC free article] [PubMed] [Google Scholar]
- Chiang MC, Barysheva M, Toga AW, Medland SE, Hansell NK, James MR, McMahon KL, de Zubicaray GI, Martin NG, Wright MJ, Thompson PM. BDNF gene effects on brain circuitry replicated in 455 twins. NeuroImage. 2011a;55:448–454. doi: 10.1016/j.neuroimage.2010.12.053. [DOI] [PMC free article] [PubMed] [Google Scholar]
- Chiang MC, McMahon KL, de Zubicaray GI, Martin NG, Hickie I, Toga AW, Wright MJ, Thompson PM. Genetics of white matter development: a DTI study of 705 twins and their siblings aged 12 to 29. NeuroImage. 2011b;54:2308–2317. doi: 10.1016/j.neuroimage.2010.10.015. [DOI] [PMC free article] [PubMed] [Google Scholar]
- Chiang MC, Barysheva M, McMahon KL, de Zubicaray GI, Johnson K, Montgomery GW, Martin NG, Toga AW, Wright MJ, Shapshak P, Thompson PM. Gene network effects on brain microstructure and intellectual performance identified in 472 twins. J Neurosci. 2012;32:8732–8745. doi: 10.1523/JNEUROSCI.5993-11.2012. [DOI] [PMC free article] [PubMed] [Google Scholar]
- Clark KA, Nuechterlein KH, Asarnow RF, Hamilton LS, Phillips OR, Hageman NS, Woods RP, Alger JR, Toga AW, Narr KL. Mean diffusivity and fractional anisotropy as indicators of disease and genetic liability to schizophrenia. J Psychiatr Res. 2011;45:980–988. doi: 10.1016/j.jpsychires.2011.01.006. [DOI] [PMC free article] [PubMed] [Google Scholar]
- Clerx L, Visser PJ, Verhey F, Aalten P. New MRI markers for Alzheimer’s disease: a meta-analysis of diffusion tensor imaging and a comparison with medial temporal lobe measurements. J Alzheimers Dis. 2012;29:405–429. doi: 10.3233/JAD-2011-110797. [DOI] [PubMed] [Google Scholar]
- de Zubicaray GI, Chiang MC, McMahon KL, Shattuck DW, Toga AW, Martin NG, Wright MJ, Thompson PM. Meeting the challenges of neuroimaging genetics. Brain Imaging Behav. 2008;2:258–263. doi: 10.1007/s11682-008-9029-0. [DOI] [PMC free article] [PubMed] [Google Scholar]
- Deary IJ, Gow AJ, Taylor MD, Corley J, Brett C, Wilson V, Campbell H, Whalley LJ, Visscher PM, Porteous DJ, Starr JM. The Lothian Birth Cohort 1936: a study to examine influences on cognitive ageing from age 11 to age 70 and beyond. BMC Geriatr. 2007;7:28. doi: 10.1186/1471-2318-7-28. [DOI] [PMC free article] [PubMed] [Google Scholar]
- Deary IJ, Gow AJ, Pattie A, Starr JM. Cohort profile: the Lothian Birth Cohorts of 1921 and 1936. Int J Epidemiol. 2013 doi: 10.1093/ije/dyr197. (in press) [DOI] [PubMed] [Google Scholar]
- Dinov I, Lozev K, Petrosyan P, Liu Z, Eggert P, Pierce J, Zamanyan A, Chakrapani S, Van Horn J, Parker DS, Magsipoc R, Leung K, Gutman B, Woods R, Toga A. Neuroimaging study designs, computational analyses and data provenance using the LONI pipeline. PLoS One. 2010:5. doi: 10.1371/journal.pone.0013070. [DOI] [PMC free article] [PubMed] [Google Scholar]
- Gatt JM, Korgaonkar MS, Schofield PR, Harris A, Clark CR, Oakley KL, Ram K, Michaelson H, Yap S, Stanners M, Wise V, Williams LM. The TWIN-E project in emotional wellbeing: study protocol and preliminary heritability results across four MRI and DTI measures. Twin Res Hum Genet. 2012;15:419–441. doi: 10.1017/thg.2012.12. [DOI] [PubMed] [Google Scholar]
- Genovese CR, Lazar NA, Nichols T. Thresholding of statistical maps in functional neuroimaging using the false discovery rate. NeuroImage. 2002;15:870–878. doi: 10.1006/nimg.2001.1037. [DOI] [PubMed] [Google Scholar]
- Glahn DC, Thompson PM, Blangero J. Neuroimaging endophenotypes: strategies for finding genes influencing brain structure and function. Hum Brain Mapp. 2007;28:488–501. doi: 10.1002/hbm.20401. [DOI] [PMC free article] [PubMed] [Google Scholar]
- Glahn DC, Winkler AM, Kochunov P, Almasy L, Duggirala R, Carless MA, Curran JC, Olvera RL, Laird AR, Smith SM, Beckmann CF, Fox PT, Blangero J. Genetic control over the resting brain. Proc Natl Acad Sci U S A. 2010;107:1223–1228. doi: 10.1073/pnas.0909969107. [DOI] [PMC free article] [PubMed] [Google Scholar]
- Hasler G, Northoff G. Discovering imaging endophenotypes for major depression. Mol Psychiatry. 2011;16:604–619. doi: 10.1038/mp.2011.23. [DOI] [PubMed] [Google Scholar]
- Honea RA, Vidoni E, Harsha A, Burns JM. Impact of APOE on the healthy aging brain: a voxel-based MRI and DTI study. J Alzheimers Dis. 2009;18:553–564. doi: 10.3233/JAD-2009-1163. [DOI] [PMC free article] [PubMed] [Google Scholar]
- Ikram MA, Fornage M, Smith AV, Seshadri S, Schmidt R, Debette S, Vrooman HA, Sigurdsson S, Ropele S, Taal HR, Mook-Kanamori DO, Coker LH, Longstreth WT, Jr, Niessen WJ, DeStefano AL, Beiser A, Zijdenbos AP, Struchalin M, Jack CR, Jr, Rivadeneira F, Uitterlinden AG, Knopman DS, Hartikainen AL, Pennell CE, Thiering E, Steegers EA, Hakonarson H, Heinrich J, Palmer LJ, Jarvelin MR, McCarthy MI, Grant SF, St Pourcain B, Timpson NJ, Smith GD, Sovio U, Nalls MA, Au R, Hofman A, Gudnason H, van der Lugt A, Harris TB, Meeks WM, Vernooij MW, van Buchem MA, Catellier D, Jaddoe VW, Gudnason V, Windham BG, Wolf PA, van Duijn CM, Mosley TH, Jr, Schmidt H, Launer LJ, Breteler MM, DeCarli C. Common variants at 6q22 and 17q21 are associated with intracranial volume. Nat Genet. 2012;44:539–544. doi: 10.1038/ng.2245. [DOI] [PMC free article] [PubMed] [Google Scholar]
- Jahanshad N, Hibar DP, Ryles A, Toga AW, McMahon KL, de Zubicaray GI, Hansell NK, Montgomery GW, Martin NG, Wright MJ, Thompson PM. Discovery of genes that affect human brain connectivity: a genome-wide analysis of the connectome. Proc IEEE Int Symp Biomed Imaging. 2012a:542–545. doi: 10.1109/ISBI.2012.6235605. [DOI] [PMC free article] [PubMed] [Google Scholar]
- Jahanshad N, Kohannim O, Hibar DP, Stein JL, McMahon KL, de Zubicaray GI, Medland SE, Montgomery GW, Whitfield JB, Martin NG, Wright MJ, Toga AW, Thompson PM. Brain structure in healthy adults is related to serum transferrin and the H63D polymorphism in the HFE gene. Proc Natl Acad Sci U S A. 2012b;109:E851–E859. doi: 10.1073/pnas.1105543109. [DOI] [PMC free article] [PubMed] [Google Scholar]
- Jahanshad N, Kohannim O, Toga AW, McMahon KL, de Zubicaray GI, Hansell NK, Montgomery GW, Martin NG, Wright MJ, Thompson PM. Diffusion imaging protocol effects on genetic associations. Proc IEEE Int Symp Biomed Imaging. 2012c:944–947. doi: 10.1109/ISBI.2012.6235712. [DOI] [PMC free article] [PubMed] [Google Scholar]
- Jahanshad N, Valcour VG, Nir TM, Kohannim O, Busovaca E, Nicolas K, Thompson P. Disrupted brain networks in the aging HIV+ population. Brain Connect. 2012d doi: 10.1089/brain.2012.0105-Rev. [DOI] [PMC free article] [PubMed] [Google Scholar]
- Jenkinson M, Bannister P, Brady M, Smith S. Improved optimization for the robust and accurate linear registration and motion correction of brain images. NeuroImage. 2002;17:825–841. doi: 10.1016/s1053-8119(02)91132-8. [DOI] [PubMed] [Google Scholar]
- Karlsgodt KH, Niendam TA, Bearden CE, Cannon TD. White matter integrity and prediction of social and role functioning in subjects at ultra-high risk for psychosis. Biol Psychiatry. 2009;66:562–569. doi: 10.1016/j.biopsych.2009.03.013. [DOI] [PMC free article] [PubMed] [Google Scholar]
- Kochunov P, Lancaster JL, Thompson P, Woods R, Mazziotta J, Hardies J, Fox P. Regional spatial normalization: toward an optimal target. J Comput Assist Tomogr. 2001;25:805–816. doi: 10.1097/00004728-200109000-00023. [DOI] [PubMed] [Google Scholar]
- Kochunov P, Lancaster J, Thompson P, Toga AW, Brewer P, Hardies J, Fox P. An optimized individual target brain in the Talairach coordinate system. NeuroImage. 2002;17:922–927. [PubMed] [Google Scholar]
- Kochunov P, Glahn DC, Fox PT, Lancaster JL, Saleem K, Shelledy W, Zilles K, Thompson PM, Coulon O, Mangin JF, Blangero J, Rogers J. Genetics of primary cerebral gyrification: heritability of length, depth and area of primary sulci in an extended pedigree of Papio baboons. NeuroImage. 2010;53:1126–1134. doi: 10.1016/j.neuroimage.2009.12.045. [DOI] [PMC free article] [PubMed] [Google Scholar]
- Kochunov P, Glahn DC, Lancaster J, Winkler A, Karlsgodt K, Olvera RL, Curran JE, Carless MA, Dyer TD, Almasy L, Duggirala R, Fox PT, Blangero J. Blood pressure and cerebral white matter share common genetic factors in Mexican Americans. Hypertension. 2011a;57:330–335. doi: 10.1161/HYPERTENSIONAHA.110.162206. [DOI] [PMC free article] [PubMed] [Google Scholar]
- Kochunov P, Glahn DC, Nichols TE, Winkler AM, Hong EL, Holcomb HH, Stein JL, Thompson PM, Curran JE, Carless MA, Olvera RL, Johnson MP, Cole SA, Kochunov V, Kent J, Blangero J. Genetic analysis of cortical thickness and fractional anisotropy of water diffusion in the brain. Front Neurosci. 2011b;5:120. doi: 10.3389/fnins.2011.00120. [DOI] [PMC free article] [PubMed] [Google Scholar]
- Kochunov P, Glahn DCLMR, Olvera R, Wincker P, Yang D, Sampath H, Carpenter W, Duggirala R, Curran J, Blangero J, Hong LE. Testing the hypothesis of accelerated cerebral white matter aging in schizophrenia and major depression. Biol Psychiatry. 2012 doi: 10.1016/j.biopsych.2012.10.002. http://dx.doi.org/10.1016/j.biopsych.2012.10.002. [DOI] [PMC free article] [PubMed]
- Kohannim O, Jahanshad N, Braskie MN, Stein JL, Chiang MC, Reese AH, Hibar DP, Toga AW, McMahon KL, de Zubicaray GI, Medland SE, Montgomery GW, Martin NG, Wright MJ, Thompson PM. Predicting white matter integrity from multiple common genetic variants. Neuropsychopharmacology. 2012;37:2012–2019. doi: 10.1038/npp.2012.49. [DOI] [PMC free article] [PubMed] [Google Scholar]
- Li MD, Cheng R, Ma JZ, Swan GE. A meta-analysis of estimated genetic and environmental effects on smoking behavior in male and female adult twins. Addiction. 2003;98:23–31. doi: 10.1046/j.1360-0443.2003.00295.x. [DOI] [PubMed] [Google Scholar]
- Lopez LM, Bastin ME, Maniega SM, Penke L, Davies G, Christoforou A, Hernández MCV, Royle NA, Tenesa A, Starr JM, Porteous DJ, Wardlaw JM, Deary IJ. A genome-wide search for genetic influences and biological pathways related to the brain’s white matter integrity. Neurobiol Aging. 2013 doi: 10.1016/j.neurobiolaging.2012.02.003. (in press) [DOI] [PubMed] [Google Scholar]
- Mahmood A, Bibat G, Zham AL, Izbudak I, Farage L, Horska A, Mori S, Naidu S. White matter impairment in Rett syndrome: diffusion tensor imaging study with clinical correlations. Am J Neuroradiol. 2010;31:295–299. doi: 10.3174/ajnr.A1792. [DOI] [PMC free article] [PubMed] [Google Scholar]
- Malouff JM, Rooke SE, Schutte NS. The heritability of human behavior: results of aggregating meta-analyses. Curr Psychol. 2008;27:153–161. [Google Scholar]
- Mandl RC, Schnack HG, Luigjes J, van den Heuvel MP, Cahn W, Kahn RS, Hulshoff Pol HE. Tract-based analysis of magnetization transfer ratio and diffusion tensor imaging of the frontal and frontotemporal connections in schizophrenia. Schizophr Bull. 2010;36:778–787. doi: 10.1093/schbul/sbn161. [DOI] [PMC free article] [PubMed] [Google Scholar]
- Mandl RC, Rais M, van Baal GC, van Haren NE, Cahn W, Kahn RS, Hulshoff Pol HE. Altered white matter connectivity in never-medicated patients with schizophrenia. Hum Brain Mapp. 2012 doi: 10.1002/hbm.22075. [DOI] [PMC free article] [PubMed] [Google Scholar]
- McIntosh AM, Moorhead TW, Job D, Lymer GK, Munoz Maniega S, McKirdy J, Sussmann JE, Baig BJ, Bastin ME, Porteous D, Evans KL, Johnstone EC, Lawrie SM, Hall J. The effects of a neuregulin 1 variant on white matter density and integrity. Mol Psychiatry. 2008;13:1054–1059. doi: 10.1038/sj.mp.4002103. [DOI] [PubMed] [Google Scholar]
- Mori S, Oishi K, Jiang H, Jiang L, Li X, Akhter K, Hua K, Faria AV, Mahmood A, Woods R, Toga AW, Pike GB, Neto PR, Evans A, Zhang J, Huang H, Miller MI, van Zijl P, Mazziotta J. Stereotaxic white matter atlas based on diffusion tensor imaging in an ICBM template. NeuroImage. 2008;40:570–582. doi: 10.1016/j.neuroimage.2007.12.035. [DOI] [PMC free article] [PubMed] [Google Scholar]
- Neale MC, Cardon LR North Atlantic Treaty Organization. Scientific Affairs Division. Methodology for Genetic Studies of Twins and Families. Kluwer Academic Publishers; Dordrecht; Boston: 1992. [Google Scholar]
- Nichols T, Hayasaka S. Controlling the familywise error rate in functional neuroimaging: a comparative review. Stat Methods Med Res. 2003;12:419–446. doi: 10.1191/0962280203sm341ra. [DOI] [PubMed] [Google Scholar]
- Olvera RL, Bearden CE, Velligan DI, Almasy L, Carless MA, Curran JE, Williamson DE, Duggirala R, Blangero J, Glahn DC. Common genetic influences on depression, alcohol, and substance use disorders in Mexican–American families. Am J Med Genet B Neuropsychiatr Genet. 2011;156B:561–568. doi: 10.1002/ajmg.b.31196. [DOI] [PMC free article] [PubMed] [Google Scholar]
- Penke L, Munoz Maniega S, Houlihan LM, Murray C, Gow AJ, Clayden JD, Bastin ME, Wardlaw JM, Deary IJ. White matter integrity in the splenium of the corpus callosum is related to successful cognitive aging and partly mediates the protective effect of an ancestral polymorphism in ADRB2. Behav Genet. 2010a;40:146–156. doi: 10.1007/s10519-009-9318-4. [DOI] [PubMed] [Google Scholar]
- Penke L, Munoz Maniega S, Murray C, Gow AJ, Hernandez MC, Clayden JD, Starr JM, Wardlaw JM, Bastin ME, Deary IJ. A general factor of brain white matter integrity predicts information processing speed in healthy older people. J Neurosci. 2010b;30:7569–7574. doi: 10.1523/JNEUROSCI.1553-10.2010. [DOI] [PMC free article] [PubMed] [Google Scholar]
- Smith SM, Jenkinson M, Johansen-Berg H, Rueckert D, Nichols TE, Mackay CE, Watkins KE, Ciccarelli O, Cader MZ, Matthews PM, Behrens TE. Tract-based spatial statistics: voxelwise analysis of multi-subject diffusion data. NeuroImage. 2006;31:1487–1505. doi: 10.1016/j.neuroimage.2006.02.024. [DOI] [PubMed] [Google Scholar]
- Sprooten E, Sussmann JE, Clugston A, Peel A, McKirdy J, Moorhead TW, Anderson S, Shand AJ, Giles S, Bastin ME, Hall J, Johnstone EC, Lawrie SM, McIntosh AM. White matter integrity in individuals at high genetic risk of bipolar disorder. Biol Psychiatry. 2011a;70:350–356. doi: 10.1016/j.biopsych.2011.01.021. [DOI] [PubMed] [Google Scholar]
- Sprooten E, Sussmann JE, Moorhead TW, Whalley HC, Ffrench-Constant C, Blumberg HP, Bastin ME, Hall J, Lawrie SM, McIntosh AM. Association of white matter integrity with genetic variation in an exonic DISC1 SNP. Mol Psychiatry. 2011b;16 (685):688–689. doi: 10.1038/mp.2011.15. [DOI] [PubMed] [Google Scholar]
- Sprooten E, Fleming KM, Thomson PA, Bastin ME, Whalley HC, Hall J, Sussmann JE, McKirdy J, Blackwood D, Lawrie SM, McIntosh AM. White matter integrity as an intermediate phenotype: exploratory genome-wide association analysis in individuals at high risk of bipolar disorder. Psychiatry Res. 2012 doi: 10.1016/j.psychres.2012.11.002. [DOI] [PubMed] [Google Scholar]
- Stein JL, Medland SE, Vasquez AA, Hibar DP, Senstad RE, Winkler AM, Toro R, Appel K, Bartecek R, Bergmann O, Bernard M, Brown AA, Cannon DM, Chakravarty MM, Christoforou A, Domin M, Grimm O, Hollinshead M, Holmes AJ, Homuth G, Hottenga JJ, Langan C, Lopez LM, Hansell NK, Hwang KS, Kim S, Laje G, Lee PH, Liu X, Loth E, Lourdusamy A, Mattingsdal M, Mohnke S, Maniega SM, Nho K, Nugent AC, O’Brien C, Papmeyer M, Putz B, Ramasamy A, Rasmussen J, Rijpkema M, Risacher SL, Roddey JC, Rose EJ, Ryten M, Shen L, Sprooten E, Strengman E, Teumer A, Trabzuni D, Turner J, van Eijk K, van Erp TG, van Tol MJ, Wittfeld K, Wolf C, Woudstra S, Aleman A, Alhusaini S, Almasy L, Binder EB, Brohawn DG, Cantor RM, Carless MA, Corvin A, Czisch M, Curran JE, Davies G, de Almeida MA, Delanty N, Depondt C, Duggirala R, Dyer TD, Erk S, Fagerness J, Fox PT, Freimer NB, Gill M, Goring HH, Hagler DJ, Hoehn D, Holsboer F, Hoogman M, Hosten N, Jahanshad N, Johnson MP, Kasperaviciute D, Kent JW, Jr, Kochunov P, Lancaster JL, Lawrie SM, Liewald DC, Mandl R, Matarin M, Mattheisen M, Meisenzahl E, Melle I, Moses EK, Muhleisen TW, Nauck M, Nothen MM, Olvera RL, Pandolfo M, Pike GB, Puls R, Reinvang I, Renteria ME, Rietschel M, Roffman JL, Royle NA, Rujescu D, Savitz J, Schnack HG, Schnell K, Seiferth N, Smith C, Steen VM, Valdes Hernandez MC, Van den Heuvel M, van der Wee NJ, Van Haren NE, Veltman JA, Volzke H, Walker R, Westlye LT, Whelan CD, Agartz I, Boomsma DI, Cavalleri GL, Dale AM, Djurovic S, Drevets WC, Hagoort P, Hall J, Heinz A, Jack CR, Jr, Foroud TM, Le Hellard S, Macciardi F, Montgomery GW, Poline JB, Porteous DJ, Sisodiya SM, Starr JM, Sussmann J, Toga AW, Veltman DJ, Walter H, Weiner MW, Bis JC, Ikram MA, Smith AV, Gudnason V, Tzourio C, Vernooij MW, Launer LJ, DeCarli C, Seshadri S, Andreassen OA, Apostolova LG, Bastin ME, Blangero J, Brunner HG, Buckner RL, Cichon S, Coppola G, de Zubicaray GI, Deary IJ, Donohoe G, de Geus EJ, Espeseth T, Fernandez G, Glahn DC, Grabe HJ, Hardy J, Hulshoff Pol HE, Jenkinson M, Kahn RS, McDonald C, McIntosh AM, McMahon FJ, McMahon KL, Meyer-Lindenberg A, Morris DW, Muller-Myhsok B, Nichols TE, Ophoff RA, Paus T, Pausova Z, Penninx BW, Potkin SG, Samann PG, Saykin AJ, Schumann G, Smoller JW, Wardlaw JM, Weale ME, Martin NG, Franke B, Wright MJ, Thompson PM. Identification of common variants associated with human hippocampal and intracranial volumes. Nat Genet. 2012;44:552–561. doi: 10.1038/ng.2250. [DOI] [PMC free article] [PubMed] [Google Scholar]
- Sullivan PF, Kendler KS, Neale MC. Schizophrenia as a complex trait: evidence from a meta-analysis of twin studies. Arch Gen Psychiatry. 2003;60:1187–1192. doi: 10.1001/archpsyc.60.12.1187. [DOI] [PubMed] [Google Scholar]
- Sutton AJ. Methods for Meta-analysis in Medical Research. J. Wiley; Chichester; New York: 2000. [Google Scholar]
- Taal HR, St Pourcain B, Thiering E, Das S, Mook-Kanamori DO, Warrington NM, Kaakinen M, Kreiner-Moller E, Bradfield JP, Freathy RM, Geller F, Guxens M, Cousminer DL, Kerkhof M, Timpson NJ, Ikram MA, Beilin LJ, Bonnelykke K, Buxton JL, Charoen P, Chawes BL, Eriksson J, Evans DM, Hofman A, Kemp JP, Kim CE, Klopp N, Lahti J, Lye SJ, McMahon G, Mentch FD, Muller-Nurasyid M, O’Reilly PF, Prokopenko I, Rivadeneira F, Steegers EA, Sunyer J, Tiesler C, Yaghootkar H, Breteler MM, Decarli C, Debette S, Fornage M, Gudnason V, Launer LJ, van der Lugt A, Mosley TH, Jr, Seshadri S, Smith AV, Vernooij MW, Blakemore AI, Chiavacci RM, Feenstra B, Fernandez-Banet J, Grant SF, Hartikainen AL, van der Heijden AJ, Iniguez C, Lathrop M, McArdle WL, Molgaard A, Newnham JP, Palmer LJ, Palotie A, Pouta A, Ring SM, Sovio U, Standl M, Uitterlinden AG, Wichmann HE, Vissing NH, van Duijn CM, McCarthy MI, Koppelman GH, Estivill X, Hattersley AT, Melbye M, Bisgaard H, Pennell CE, Widen E, Hakonarson H, Smith GD, Heinrich J, Jarvelin MR, Jaddoe VW. Common variants at 12q15 and 12q24 are associated with infant head circumference. Nat Genet. 2012;44:532–538. doi: 10.1038/ng.2238. [DOI] [PMC free article] [PubMed] [Google Scholar]
- Teipel SJ, Reuter S, Stieltjes B, Acosta-Cabronero J, Ernemann U, Fellgiebel A, Filippi M, Frisoni G, Hentschel F, Jessen F, Kloppel S, Meindl T, Pouwels PJ, Hauenstein KH, Hampel H. Multicenter stability of diffusion tensor imaging measures: a European clinical and physical phantom study. Psychiatry Res. 2011;194:363–371. doi: 10.1016/j.pscychresns.2011.05.012. [DOI] [PubMed] [Google Scholar]
- Teipel SJ, Wegrzyn M, Meindl T, Frisoni G, Bokde AL, Fellgiebel A, Filippi M, Hampel H, Kloppel S, Hauenstein K, Ewers M. Anatomical MRI and DTI in the diagnosis of Alzheimer’s disease: a European multicenter study. J Alzheimers Dis. 2012 doi: 10.3233/JAD-2012-112118. [DOI] [PubMed] [Google Scholar]
- Thomason ME, Thompson PM. Diffusion imaging, white matter, and psychopathology. Annu Rev Clin Psychol. 2011;7:63–85. doi: 10.1146/annurev-clinpsy-032210-104507. [DOI] [PubMed] [Google Scholar]
- Thompson PM, Cannon TD, Narr KL, van Erp T, Poutanen VP, Huttunen M, Lonnqvist J, Standertskjold-Nordenstam CG, Kaprio J, Khaledy M, Dail R, Zoumalan CI, Toga AW. Genetic influences on brain structure. Nat Neurosci. 2001;4:1253–1258. doi: 10.1038/nn758. [DOI] [PubMed] [Google Scholar]
- van den Heuvel MP, van Soelen IL, Stam CJ, Kahn RS, Boomsma DI, Hulshoff Pol HE. Genetic control of functional brain network efficiency in children. Eur Neuropsychopharmacol. 2012 doi: 10.1016/j.euroneuro.2012.06.007. [DOI] [PubMed] [Google Scholar]
- Verweij KJ, Zietsch BP, Lynskey MT, Medland SE, Neale MC, Martin NG, Boomsma DI, Vink JM. Genetic and environmental influences on cannabis use initiation and problematic use: a meta-analysis of twin studies. Addiction. 2010;105:417–430. doi: 10.1111/j.1360-0443.2009.02831.x. [DOI] [PMC free article] [PubMed] [Google Scholar]
- Walker L, Curry M, Nayak A, Lange N, Pierpaoli C. A framework for the analysis of phantom data in multicenter diffusion tensor imaging studies. Hum Brain Mapp. 2012 doi: 10.1002/hbm.22081. [DOI] [PMC free article] [PubMed] [Google Scholar]
- Wardlaw JM, Bastin ME, Valdes Hernandez MC, Maniega SM, Royle NA, Morris Z, Clayden JD, Sandeman EM, Eadie E, Murray C, Starr JM, Deary IJ. Brain aging, cognition in youth and old age and vascular disease in the Lothian Birth Cohort 1936: rationale, design and methodology of the imaging protocol. Int J Stroke. 2011;6:547–559. doi: 10.1111/j.1747-4949.2011.00683.x. [DOI] [PubMed] [Google Scholar]
- Weiner MW, Veitch DP, Aisen PS, Beckett LA, Cairns NJ, Green RC, Harvey D, Jack CR, Jagust W, Liu E, Morris JC, Petersen RC, Saykin AJ, Schmidt ME, Shaw L, Siuciak JA, Soares H, Toga AW, Trojanowski JQ. The Alzheimer’s disease neuroimaging initiative: a review of papers published since its inception. Alzheimers Dement. 2012;8:S1–S68. doi: 10.1016/j.jalz.2011.09.172. [DOI] [PMC free article] [PubMed] [Google Scholar]
- Westlye ET, Hodneland E, Haasz J, Espeseth T, Lundervold A, Lundervold AJ. Episodic memory of APOE epsilon4 carriers is correlated with fractional anisotropy, but not cortical thickness, in the medial temporal lobe. NeuroImage. 2012;63:507–516. doi: 10.1016/j.neuroimage.2012.06.072. [DOI] [PubMed] [Google Scholar]
- Winkler AM, Kochunov P, Blangero J, Almasy L, Zilles K, Fox PT, Duggirala R, Glahn DC. Cortical thickness or grey matter volume? The importance of selecting the phenotype for imaging genetics studies. NeuroImage. 2010;53:1135–1146. doi: 10.1016/j.neuroimage.2009.12.028. [DOI] [PMC free article] [PubMed] [Google Scholar]
- Zhan L, Jahanshad N, Ennis DB, Jin Y, Bernstein MA, Borowski BJ, Jack CR, Jr, Toga AW, Leow AD, Thompson PM. Angular versus spatial resolution trade-offs for diffusion imaging under time constraints. Hum Brain Mapp. 2012 doi: 10.1002/hbm.22094. [DOI] [PMC free article] [PubMed] [Google Scholar]
- Zhu T, Hu R, Qiu X, Taylor M, Tso Y, Yiannoutsos C, Navia B, Mori S, Ekholm S, Schifitto G, Zhong J. Quantification of accuracy and precision of multi-center DTI measurements: a diffusion phantom and human brain study. NeuroImage. 2011;56:1398–1411. doi: 10.1016/j.neuroimage.2011.02.010. [DOI] [PMC free article] [PubMed] [Google Scholar]
- Zuk O, Hechter E, Sunyaev SR, Lander ES. The mystery of missing heritability: genetic interactions create phantom heritability. Proc Natl Acad Sci USA. 2012;109:1193–1198. doi: 10.1073/pnas.1119675109. [DOI] [PMC free article] [PubMed] [Google Scholar]
- Zuliani R, Moorhead TW, Bastin ME, Johnstone EC, Lawrie SM, Brambilla P, O’Donovan MC, Owen MJ, Hall J, McIntosh AM. Genetic variants in the ErbB4 gene are associated with white matter integrity. Psychiatry Res. 2011;191:133–137. doi: 10.1016/j.pscychresns.2010.11.001. [DOI] [PMC free article] [PubMed] [Google Scholar]