

Abstract
Tumor suppressors play a major role in the etiology of human cancer, and typically achieve a tumor‐promoting effect upon complete functional inactivation. Bi‐allelic inactivation of tumor suppressors may occur through genetic mechanisms (such as loss of function mutation, copy number (CN) loss, or loss of heterozygosity (LOH)), epigenetic mechanisms (such as promoter methylation or histone modification), or a combination of the two. We report systematically derived status of 69 known or putative tumor suppressors, across 799 samples of the Cancer Cell Line Encyclopedia. In order to generate such resource we constructed a novel comprehensive computational framework for the assessment of tumor suppressor functional “status”. This approach utilizes several orthogonal genomic data types, including mutation data, copy number, LOH and expression. Through correlation with additional data types (compound sensitivity and gene set activity) we show that this integrative method provides a more accurate assessment of tumor suppressor status than can be inferred by expression, copy number, or mutation alone. This approach has the potential for a more realistic assessment of tumor suppressor genes for both basic and translational oncology research.
Keywords: Tumor suppressor, Cancer cell line, CCLE, Loss of function, DNA methylation, Epigenetics
Highlights
Tumor Suppressors Status for 69 tumor suppressors across 799 cancer cell lines.
Status obtained by integrative analysis of sequencing, expression and CN datasets.
Integrative analysis provides a more reliable status than sequencing alone.
Comprehensive computational framework for the assessment of tumor suppressor status.
The companion website is available at http://www.glacombio.net/tsgs.
1. Introduction
Tumor suppressor genes encode proteins that normally inhibit tumor formation caused by abnormal cellular proliferation. Tumor suppressor proteins can participate in a variety of processes such as negative regulation of the cell cycle, positive regulation of apoptosis, regulation of DNA damage response, or other mechanisms (Stanbridge, 1990). The list of tumor suppressor genes includes such names as TP53 (tumor protein p53), RB1 (retinoblastoma), APC (adenomatous polyposis coli), and BRCA1 (breast cancer 1, early onset). The inactivation of these and other tumor suppressor genes plays a major role in many types of cancer (Jones and Thompson, 2009).
Unlike proto‐oncogenes, where a single mutation can be dominant and lead to cellular transformation, a single mutation in a tumor suppressor gene is normally recessive as long as there is a second functional copy of the gene (Knudson, 1971). However, loss of function of both tumor suppressor alleles may promote tumor growth or survival providing that the loss of function is nearly or totally complete. It is possible to infer loss of function of tumor suppressor genes through a number of genomic measurements, such as transcript expression, DNA copy number, and mutation.
The Cancer Cell Line Encyclopedia (CCLE, http://www.broadinstitute.org/ccle/home) is a recently compiled public resource that contains gene expression, chromosomal copy number and massively parallel sequencing data from nearly 1000 cancer cell lines (Barretina et al., 2012). These matched datasets allow for the examination of distinct mechanisms of tumor suppressor inactivation and also for “integrative analyses” of orthogonal data types. In order to further extend the utility of the CCLE both for basic and translational oncology research communities, we have built a comprehensive computational framework for assessing the functional status of tumor suppressor genes. We have then applied this framework to 69 known or putative tumor suppressors across the CCLE. In this paper, we demonstrate that this integrative method provides a more powerful and more reliable tool for tumor suppressor gene analysis than simply utilizing individual datasets.
2. Materials and methods
We compiled a list of 82 well‐known and putative tumor suppressor genes. Among these, 69 genes have mutation, copy number and expression data available and, therefore, were used for the present analysis (Supp. Table 1). We assembled information from the literature on known loss of function missense mutations (Table 1). At this time the number of clearly validated loss of function missense mutations is small (only 38 entries covering 7 genes). However, it is likely that there are other bona fide losses of function missense mutations that have not been sufficiently validated or annotated.
Table 1.
Known loss of function missense mutations.
| Gene | ENTREZ_ID | AA.Change | dbSNP | Dominant negative |
|---|---|---|---|---|
| CDKN2A | 1029 | H83Y | ||
| CDKN2A | 1029 | D84Y | rs11552822 | |
| CDKN2A | 1029 | D108Y | ||
| CDKN2A | 1029 | P114L | ||
| MLH1 | 4292 | V384D | ||
| PTEN | 5728 | R130G | ||
| PTEN | 5728 | R130Q | ||
| PTEN | 5728 | R173C | ||
| PTEN | 5728 | R173H | ||
| RB1 | 5925 | C706F | ||
| STK11 | 6794 | D194N | ||
| STK11 | 6794 | D194V | ||
| STK11 | 6794 | E199K | ||
| STK11 | 6794 | P281L | ||
| TP53 | 7157 | V143A | N | |
| TP53 | 7157 | V157F | Y | |
| TP53 | 7157 | R158L | Y | |
| TP53 | 7157 | R158H | N | |
| TP53 | 7157 | R175H | rs28934578 | Y |
| TP53 | 7157 | Y220C | Y | |
| TP53 | 7157 | M237I | N | |
| TP53 | 7157 | G245S | rs28934575 | Y |
| TP53 | 7157 | R248Q | rs11540652 | Y |
| TP53 | 7157 | R248W | Y | |
| TP53 | 7157 | R249S | Y | |
| TP53 | 7157 | R273C | Y | |
| TP53 | 7157 | R273H | rs28934576 | Y |
| TP53 | 7157 | R273L | Y | |
| TP53 | 7157 | R280K | N | |
| TP53 | 7157 | R280S | N | |
| TP53 | 7157 | R280T | N | |
| TP53 | 7157 | R282G | N | |
| TP53 | 7157 | R282W | Y | |
| VHL | 7428 | P81S | rs5030806 | |
| VHL | 7428 | L85P | rs5030828 | |
| VHL | 7428 | L89H | rs5030807 | |
| VHL | 7428 | L158Q | ||
| VHL | 7428 | R167W | rs5030820 |
Affymetrix U133Plus2 mRNA expression, Affymetrix SNP 6.0 data, OncoMap mutation calls (MacConaill et al., 2009), exome data sequencing (Hodges et al., 2007), and pharmacological profiling data are available at the CCLE website. All expression values are MAS5 normalized, with a 2% trimmed mean of 150 (Hubbell et al., 2002). We summarized cutoffs used for expression, copy number, and mutation data in Table 2.
Table 2.
Cutoffs for expression, copy number, and mutation data.
| Copy number (CN) ratio <0.6 indicates “allelic loss”.CN ratio is the ratio of signal intensity in a tumor sample versus normal reference samples normalized to total DNA quantity; thus a CN ratio of 1 corresponds to a diploid locus. |
| Copy number ratio <0.25 indicates “bi‐allelic loss”, or complete loss. |
| Copy number ratio >0.9 indicates the presence of both alleles. |
| Gene expression <32 is considered to be “not expressed”, when the mean and median expression of this gene across all cell lines are above 100. For calculation of mean and median gene expression values, we discarded cell lines with CN ratio below 0.25, in order to decrease artificial under‐estimation of expression distributions of cell lines with remaining functional DNA. |
| Gene expression >300 is considered as a “high confidence” level of expression. |
| Mutation data: a minimum of 20 mutant reads defines a “trusted mutation”, this is a conservative cutoff designed to minimize false positive calls. No more than one read for the wild type allele is allowed for homozygous calls.(For reference, hybrid capture exome sequencing was performed to an average depth of 60‐fold.) |
| OncoMap mutations are considered to be heterozygous. |
We have divided mechanisms of inactivation of tumor suppressors into three categories. Figure 1 illustrates each sub‐category with a simplified diagram.
Figure 1.
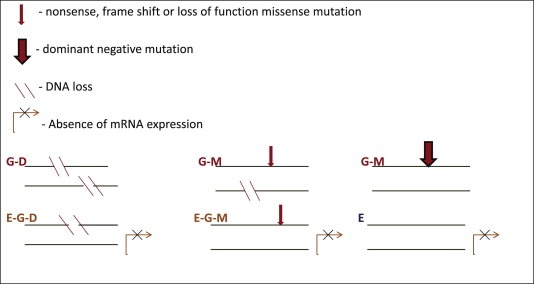
Tumor suppressor inactivation categories. G – stands for genetic alteration, D – stands for deletion, M – stands for mutation, E – stands for absence of expression.
The first category “G” is based completely on genetic mechanisms of inactivation of both alleles (Stanbridge, 1990; Ponder, 2001) and, therefore, can be considered as the highest confidence category.
The genetic category can be subdivided further into 2 sub‐categories:
The sub‐category “G‐M” is based on a homozygous nonsense, frame shift, loss of function missense mutation or heterozygous/homozygous dominant negative mutation.
The sub‐category “G‐D” is based on deletion of both alleles (bi‐allelic loss).
One way for a gene to appear in the sub‐category “G‐M” is to have LOH status derived from Affymetrix SNP 6.0 data and a homozygous mutation deduced from the exome sequencing data. Any nonsense or frame shift mutation is considered to lead to loss of function; however, only validated loss of function missense mutations from Table 1 are used. Figure 1 illustrates a sub‐category “G‐M” with the most likely scenario being the loss of one allele and inactivation of the other by mutation. However it is possible to have identical multiple copies of an allele inactivated by the mutation. It is useful to keep in mind that males have an automatic genetic “LOH” on the X chromosome, and females have a mosaic allele‐specific expression pattern due to random inactivation of one of two X chromosomes during early embryogenesis (Heard et al., 1997).
Another “G‐M” mechanism is dominant negative mutation. As can be seen from Table 1, only TP53 is considered to have dominant negative mutations in the list of 69 tumor suppressors that are examined here. OncoMap mutation calls are also used for this sub‐category.
The second category “E‐G” is based on inactivation of one allele by a genetic mechanism and loss of the expression of the second allele. The loss of the expression could be due to multiple reasons, such as loss of upstream signaling, mutations in promoter and enhancer regions and epigenetic mechanism, such as promoter methylation and possible histone modifications. The epigenetic mechanism of inactivation of tumor suppressor genes is considered to be of fundamental importance in tumorigenesis (Jones and Baylin, 2002). Since epigenetic data is not available at this point for the majority of the CCLE cell lines, gene expression data is used as a proxy for the epigenetic mechanism; this substitution is not perfect, however it provides a reasonable practical approach. This “E‐G” category can be further divided into two sub‐categories:
The sub‐category “E‐G‐D” is characterized by deletion of one allele and absence of gene expression.
The sub‐category “E‐G‐M” is characterized by nonsense, frame shift or loss of function missense mutation on one allele and absence of gene expression. Exome sequencing data and OncoMap mutation calls are used for this sub‐category. Since the second category, in general, requires absence of mRNA expression, sub‐category “E‐G‐M” will mostly cover the scenarios when the mutation leads to mRNA decay.
The third category “E” is based on loss of the expression of both alleles. As in the “E‐G” category, epigenetic mechanisms are likely playing an important role in the loss of the expression. Category “E‐LOH” denotes LOH in addition to absence of mRNA expression.
In order to help identify cell lines with functional wild type tumor suppressors, we established the wild type category. “Wild type” status is based on absence of non‐synonymous mutations, splice sites mutations, CN loss or LOH (based on CN data).
The wild type category is further divided into two sub‐categories:
The sub‐category “WT‐E” has mRNA expression at “high confidence” level.
The sub‐category “WT” has mRNA expression below “high confidence” level.
Finally, a catch‐all category “0” is defined for cases which do not qualify any of the above categories. Category “0” has two additional sub‐categories:
“0‐D” is characterized by deletion of one allele.
“0‐M” is characterized by heterozygous nonsense, frame shift or loss of the function missense mutation.
Figure 2 illustrates category assignment by means of simplified flow chart.
Figure 2.
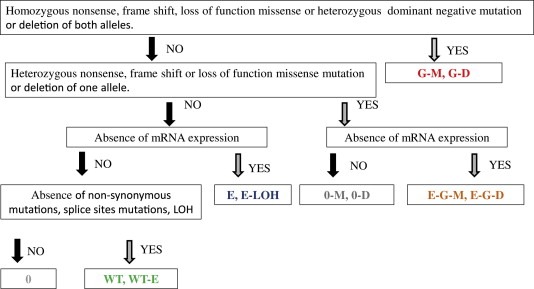
Simplified flow chart of category assignments.
Main reason for using multiple data types is to detect different ways of tumor suppressor genes inactivation. Also multiple data types help dealing with occasional technical artifacts. Coverage drop at the TP53 R273C mutation in SW1710 cell line (Supp. Figure 1) is example of such scenario; in the case of TP53 R273C mutation the mutational data provided by OncoMap for that particular mutation helps to augment sequencing data.
3. Results
For the 69 tumor suppressors for which all data types are available, we generated a systematic and comprehensive matrix of tumor suppressor status across 799 CCLE cell lines using categories described in the “Methods” section (Supp. Table 2). A web‐interface for selecting cell lines with desirable status of tumor suppressor(s) is available at http://cancer.tools.glacombio.net. We also generated summaries of categories for all examined genes. In addition, we summarized the counts for the categories for all 69 genes across all 799 cell lines in Supp. Table 3.
Table 3 shows the 25 most frequently disabled (i.e., functionally inactive) genes, and Supp. Table 4 lists data for all 69 genes. As one would expect, CDKN2A, TP53, RB1, PTEN and APC are among the most frequently disabled genes in cancer cell lines. CDKN2A appears to be the most frequently disabled gene in the CCLE. In about 76% of cases CDKN2A is likely to be inactivated by DNA deletion of both alleles. This is a larger proportion than expected, although the effect may be partially explained by small genomic size of the CDKN2A locus (only 25 kb). CDKN2B is disabled almost as often as CDKN2A, but because it is located just 6 kb from CDKN2A locus these two loci may be deleted together. Not surprisingly, TP53 is inactivated in about 50% cases by dominant negative mutations (Petitjean et al., 2007). As expected for most of the classical tumor suppressor genes, multiple number of different mechanisms of inactivation is observed in collection of 799 cancer cell lines. This points to the importance of systematic and comprehensive characterization of tumor suppressor genes status in cancer models based on “integrative analyses” of orthogonal data types.
Table 3.
Most prevalent genetically inactivated tumor suppressors across CCLE.
| Gene symbol | G# | E‐G# | G‐M# | G‐D# | E‐G‐D# | E‐G‐M# | E# | E‐LOH# | WT‐E# | WT# |
|---|---|---|---|---|---|---|---|---|---|---|
| CDKN2A | 231 | 16 | 0 | 231 | 16 | 0 | 42 | 15 | 97 | 101 |
| CDKN2B | 215 | 0 | 0 | 215 | 0 | 0 | 0 | 0 | 18 | 218 |
| TP53 | 179 | 39 | 176 | 3 | 21 | 18 | 0 | 37 | 84 | 89 |
| RB1 | 36 | 5 | 29 | 7 | 3 | 2 | 0 | 7 | 295 | 5 |
| PTEN | 20 | 9 | 14 | 6 | 9 | 0 | 2 | 7 | 398 | 0 |
| SMAD4 | 20 | 0 | 6 | 14 | 0 | 0 | 0 | 0 | 6 | 353 |
| KDM6A | 15 | 0 | 1 | 14 | 0 | 0 | 0 | 0 | 0 | 132 |
| APC | 13 | 2 | 13 | 0 | 2 | 0 | 0 | 1 | 226 | 141 |
| NF1 | 10 | 0 | 7 | 3 | 0 | 0 | 0 | 0 | 13 | 419 |
| TGFBR2 | 8 | 21 | 0 | 8 | 15 | 6 | 52 | 30 | 235 | 96 |
| MLH1 | 7 | 1 | 6 | 1 | 0 | 1 | 18 | 4 | 350 | 2 |
| FHIT | 6 | 0 | 0 | 6 | 0 | 0 | 0 | 0 | 5 | 232 |
| CDH1 | 5 | 0 | 2 | 3 | 0 | 0 | 0 | 0 | 183 | 234 |
| STK11 | 5 | 0 | 3 | 2 | 0 | 0 | 0 | 0 | 0 | 414 |
| NF2 | 4 | 6 | 3 | 1 | 6 | 0 | 0 | 3 | 224 | 197 |
| MSH2 | 4 | 5 | 2 | 2 | 4 | 1 | 0 | 0 | 519 | 66 |
| ARID1A | 4 | 2 | 3 | 1 | 1 | 1 | 0 | 2 | 98 | 251 |
| DLC1 | 4 | 0 | 2 | 2 | 0 | 0 | 0 | 0 | 103 | 241 |
| VHL | 3 | 4 | 3 | 0 | 4 | 0 | 0 | 0 | 13 | 413 |
| SMARCB1 | 3 | 1 | 0 | 3 | 0 | 1 | 0 | 0 | 288 | 157 |
| ATM | 3 | 0 | 3 | 0 | 0 | 0 | 0 | 1 | 169 | 120 |
| RUNX1 | 3 | 0 | 0 | 3 | 0 | 0 | 0 | 0 | 6 | 496 |
| LATS2 | 2 | 17 | 0 | 2 | 17 | 0 | 52 | 25 | 214 | 88 |
| TSC2 | 2 | 1 | 1 | 1 | 1 | 0 | 1 | 2 | 24 | 427 |
| CREBBP | 2 | 1 | 1 | 1 | 1 | 0 | 0 | 0 | 426 | 5 |
Nutlin‐3 is an inhibitor of MDM2‐driven TP53 protein degradation (Vassilev, 2004; Kubbutat et al., 1997). Mechanistically, only cell lines with wild type TP53 can be potentially sensitive to this inhibitor as confirmed in part by sensitivity of wild type MEFs cells and by the loss of sensitivity in TP53 knockout MEFs (Efeyan et al., 2007). We can use this knowledge to assess our integrative approach to assessing tumor suppressor status. Figure 3 shows the relationship between TP53 status and sensitivity to Nutlin‐3. Cell lines with IC50 below 4.5 μM are considered to be sensitive to Nutlin‐3 and cell lines with IC50 above 6.5 μM are considered to be insensitive to Nutlin‐3 (The IC50 is concentration at which the drug response reached an absolute inhibition of 50%). As illustrated by Figure 3, all cell lines with TP53 inactivated by any mechanism are insensitive to Nutlin‐3. Table 4 shows that each inactivation category is statistically significantly enriched for insensitive cell lines in comparison to wild type ones, by the Fisher's exact test.
Figure 3.
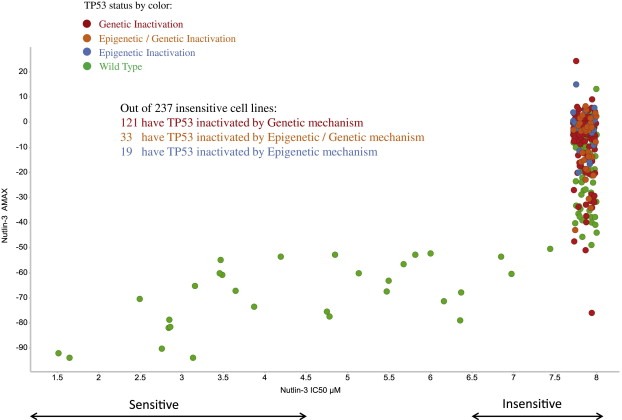
Nutlin‐3 sensitivity across 491 CCLE cell lines in relation to TP53 status. Each dot represents cell line with TP53 inactivation status marked by color. All cell lines with TP53 inactivated by any mechanism are insensitive to Nutlin‐3. TP53 Wild Type status covers: WT‐E and WT categories. TP53 Genetic Inactivation status covers: G‐M and G‐D categories. TP53 Epigenetic Inactivation status covers E‐LOH category. TP53 Epigenetic/Genetic Inactivation status covers: E‐G‐M and E‐G‐D categories.
Table 4.
TP53 inactivation categories and Nutlin‐3 insensitivity.
| TP53 inactivation | Fisher exact p‐value for Nutlin‐3 insensitivity |
|---|---|
| Genetic Inactivation | 3.69E−07 |
| Epigenetic/Genetic Inactivation | 3.43E−03 |
| Epigenetic Inactivation | 2.95E−02 |
| Epigenetic/Genetic Inactivation and Epigenetic Inactivation | 2.82E−04 |
| Epigenetic/Genetic Inactivation, Epigenetic Inactivation and Genetic Inactivation | 1.03E−08 |
Table 4 also illustrates that combining multiple inactivation categories leads to more significant statistical results. In cell lines with inactivated TP53 one would expect to see a drop in TP53‐driven signaling. The KEGG and BIOCARTA (http://www.biocarta.com/genes/allpathways.asp) representations of the TP53 signaling pathway are well‐established references (Kanehisa et al., 2012). Pathway activity scores were calculated for 4162 MSigDB gene sets covering multiple gene sets sources including KEGG and BIOCARTA (Breslin et al., 2005; Lee et al., 2008; Guo et al., 2005; Liberzon et al., 2011). Correlation coefficients were calculated between each TP53 inactivation category/wild type category and TP53 pathway activity scores based on KEGG and BIOCARTA gene sets. Table 5 summarizes results of correlation calculations, as anticipated negative correlations are observed for each inactivation category. Out of 4162 correlation coefficients for each inactivation category, the correlation coefficients for BIOCARTA TP53 pathway have the most negative values in 4 out of 5 cases. The statistical significance of the distribution of TP53 pathway activity scores between cell lines from particular inactivation category and wild type cell lines is confirmed by t‐test. As indicated by above observations, the consideration of multiple mechanisms of inactivation provides us with a more complete and informative landscape of TP53 inactivation and better genomic characterizations of cell lines models.
Table 5.
TP53 inactivation categories and KEGG & BIOCARTA TP53 signaling pathways.
| TP53 inactivation | Correlation coefficient and rank for KEGG TP53 signaling pathway | t‐test p‐value for KEGG TP53 signaling pathway scores | Correlation coefficient and rank for BIOCARTA TP53 signaling pathway | t‐test p‐value for BIOCARTA TP53 signaling pathway scores |
|---|---|---|---|---|
| Genetic Inactivation | −0.35 (2) | 1.15E−10 | −0.45 (1) | 2.41E−17 |
| Epigenetic/Genetic Inactivation | −0.35 (4) | 4.40E−07 | −0.45 (2) | 1.42E−11 |
| Epigenetic Inactivation | −0.39 (2) | 2.67E−08 | −0.51 (1) | 2.47E−14 |
| Epigenetic/Genetic Inactivation and Epigenetic Inactivation | −0.44 (3) | 1.77E−12 | −0.57 (1) | 3.18E−21 |
| Epigenetic/Genetic Inactivation, Epigenetic Inactivation and Genetic Inactivation | −0.39 (2) | 3.95E−16 | −0.51 (1) | 2.54E−27 |
PD‐0332991 is a CDK4/6 inhibitor and mechanistically only cell lines with wild type RB1 can be potentially sensitive to this inhibitor (Finn et al., 2009). Supp. Figure 2 shows the relationship between RB1 status and sensitivity to PD‐0332991. Cell lines with IC50 below 4.5 μM are considered to be sensitive to PD‐0332991 while cell lines with IC50 above 6.5 μM are considered to be insensitive to PD‐0332991. As illustrated by Supp. Figure 2 all cell lines with RB1 inactivated by any mechanism are insensitive to PD‐0332991. Supp. Table 5 shows that each inactivation category by itself is not statistically significantly enriched for insensitive cell lines in comparison to wild type ones, however statistical significance is reached by combining multiple inactivation categories.
The above examples for TP53 and RB1 clearly demonstrate that accounting for multiple mechanisms of tumor suppressor genes inactivation leads to a much more accurate determination of tumor suppressor functional status. Such enhanced accuracy could be useful component in efforts to improve preclinical stratification of anticancer therapeutics.
4. Discussion
The approach presented in this article and its application to CCLE will significantly improve the characterization of the status of tumor suppressor genes in cancer cell line models. In the future, we aim to further refine this methodology along the following lines.
The ability to accurately differentiate between two mutations affecting two different alleles and mutations affecting just one allele is limited by the length of sequencing reads. This limitation may have important implications. For example, in the case of APC, which is often disabled in colorectal cancers, a loss of function mutation affecting the first allele and also a different loss of function mutation affecting the second allele may occur relatively frequently. For example, in familial colorectal cancers one allele may be disabled by a germ line loss of function mutation while the other allele may be disabled by somatic loss of function mutation (Fodde, 2002). Therefore, in the case of APC, the total number of cell lines identified by our framework approach as being genetically inactivated is likely to be underestimated. This situation is likely to improve as publicly available datasets become more refined, but in the meantime our estimates will represent minimum numbers of cell lines in such cases.
It is likely that there are bona fide losses of function missense mutations that have not been sufficiently validated or clearly annotated and therefore did not appear in Table 1. Once again, public databases are an evolving resource and should not be regarded as either fully accurate or fully complete. In future, the creation of a more comprehensive and reliable resource of clearly validated loss of function (as well as gain of function) missense mutations in cancer would be a very useful cancer genetics tool. Hopefully, ongoing efforts like the MutaDATABASE (Bale et al., 2011) and ClinVar (http://www.ncbi.nlm.nih.gov/clinvar/) projects will help to establish such a resource. Also, as can be seen in Table 1, some of the validated somatic loss of function mutations are found in dbSNP (Sherry et al., 2001), and are not always explicitly noted to be somatic variants or pathogenic alleles. Therefore, in order to prevent the incorrect removal of somatic mutations, extra steps must be taken when using dbSNP as a filter to remove germ line SNPs from cancer samples sequencing.
RNA‐seq data will be generated for the CCLE collection during the next phase of the CCLE project (Mortazavi et al., 2008). We expect that these new data will assist in the more accurate identification of cell lines in which there is a lack of expression of particular genes. This would also allow examination of allele‐specific expression and, therefore, could help to identify cases in which alleles that are only inactivated by mutation are expressed. Exome sequencing data has a variable read depth, with the highest coverage approximately in the middle of capture probes and gradually decreasing coverage as the distance increases. As mentioned before OncoMap mutational data helps to augment sequencing data at some locations. RNA‐seq data would help to further improve distribution of read depth coverage here.
Genetic and epigenetic regulation of many tumor suppressors is complemented by posttranslational regulation. For example, TP53 has recently been referred to as one of the group of “massively regulated genes” with several alternative splicing sites and alternative translation initiation sites together generating potentially as many as ten distinct isoforms of the gene product (Hollstein and Hainaut, 2010). At the posttranslational level, the biological activity of TP53 depends on its intracellular concentration and can be modulated by conformational changes, different intracellular localization, DNA‐binding activity and interactions with other proteins. The accumulation and activity of the protein are also regulated by suite of posttranslational modifications that can include phosphorylation, acetylation, ubiquitination, sumoylation, neddylation, methylation and glycosylation. For example negative regulation of TP53 is provided in part by the MDM2 and MDM4 proteins, which are important determinants of TP53 abundance and subcellular localization.
Some of the tumor suppressors can be haploinsufficient (Payne and Kemp, 2005) and, in this case, the decrease in mRNA expression alone could have substantial tumor promoting effects. Future work on incorporating considerations of posttranslational regulations and haploinsufficiency may improve characterization of tumor suppressor genes status in cancer models.
5. Conclusions
Using several orthogonal genomic data types, including mutation data, copy number, loss of heterozygosity, and functional expression we have developed a novel comprehensive computational framework for the assessment of tumor suppressor functional “status”. We applied this approach to a panel of 69 known or putative tumor suppressors, across 799 samples of the Cancer Cell Line Encyclopedia and showed that it provides a more accurate assessment of tumor suppressor status than can be inferred by expression, copy number, or mutation alone. This approach has the potential for a more realistic assessment of tumor suppressors for both basic and translational oncology research.
Authors' contributions
DS conceptualized and carried out the bioinformatics analysis and wrote the first draft of the manuscript. MH developed database and web‐portal. TT and DJM jointly supervised the research project and assisted with data analysis and manuscript preparation.
Authors' information
DS and MH are PhD students, TT is the Head of Computational Biology Research Group and DJM is Professor of Biotechnology at the University of South Wales.
Conflict of interest
The authors report no conflicts of interest.
Supporting information
Supplementary data
Supplementary data
Supplementary data
Supplementary data
Supplementary data
Supplementary data
Supplementary data
Acknowledgements
We are grateful to Farzana Rahman and Negusse Tadesse for the help with the website and database development. This work was supported in part by the University of Glamorgan Research Investment Scheme and Strategic Insight Programme funding from the Higher Education Funding Council for Wales.
Supplementary data 1.
1.1.
Supplementary data related to this article can be found at http://dx.doi.org/10.1016/j.molonc.2013.04.001.
Sonkin Dmitriy, Hassan Mehedi, Murphy Denis J., Tatarinova Tatiana V., (2013), Tumor Suppressors Status in Cancer Cell Line Encyclopedia, Molecular Oncology, 7, doi: 10.1016/j.molonc.2013.04.001.
Contributor Information
Dmitriy Sonkin, Email: dmitriy.sonkin@southwales.ac.uk.
Tatiana V. Tatarinova, Email: tatiana.tatarinova@lapk.org
References
- Bale, S. , Devisscher, M. , Van Criekinge, W. , Rehm, H.L. , Decouttere, F. , Nussbaum, R. , Dunnen, J.T.D. , Willems, P. , 2011. MutaDATABASE: a centralized and standardized DNA variation database. Nat. Biotechnol. 29, 117–118. [DOI] [PubMed] [Google Scholar]
- Barretina, J. , Caponigro, G. , Stransky, N. , Venkatesan, K. , Margolin, A.A. , Kim, S. , Wilson, C.J. , Lehár, J. , Kryukov, G.V. , Sonkin, D. , 2012. The Cancer Cell Line Encyclopedia enables predictive modelling of anticancer drug sensitivity. Nature 483, 603–607. [DOI] [PMC free article] [PubMed] [Google Scholar]
- Breslin, T. , Krogh, M. , Peterson, C. , Troein, C. , 2005. Signal transduction pathway profiling of individual tumor samples. BMC Bioinform. 6, 163 [DOI] [PMC free article] [PubMed] [Google Scholar]
- Efeyan, A. , Ortega-Molina, A. , Velasco-Miguel, S. , Herranz, D. , Vassilev, L.T. , Serrano, M. , 2007. Induction of p53-dependent senescence by the MDM2 antagonist nutlin-3a in mouse cells of fibroblast origin. Cancer Res. 67, 7350–7357. [DOI] [PubMed] [Google Scholar]
- Finn, R.S. , Dering, J. , Conklin, D. , Kalous, O. , Cohen, D.J. , Desai, A.J. , Ginther, C. , Atefi, M. , Chen, I. , Fowst, C. , 2009. PD 0332991, a selective cyclin D kinase 4/6 inhibitor, preferentially inhibits proliferation of luminal estrogen receptor-positive human breast cancer cell lines in vitro. Breast Cancer Res. 11, R77 [DOI] [PMC free article] [PubMed] [Google Scholar]
- Fodde, R. , 2002. The APC gene in colorectal cancer. Eur. J. Cancer 38, 867–871. [DOI] [PubMed] [Google Scholar]
- Guo, Z. , Zhang, T. , Li, X. , Wang, Q. , Xu, J. , Yu, H. , Zhu, J. , Wang, H. , Wang, C. , Topol, E.J. , 2005. Towards precise classification of cancers based on robust gene functional expression profiles. BMC Bioinform. 6, 58 [DOI] [PMC free article] [PubMed] [Google Scholar]
- Heard, E. , Clerc, P. , Avner, P. , 1997. X-chromosome inactivation in mammals. Annu. Rev. Genet. 31, 571–610. [DOI] [PubMed] [Google Scholar]
- Hodges, E. , Xuan, Z. , Balija, V. , Kramer, M. , Molla, M.N. , Smith, S.W. , Middle, C.M. , Rodesch, M.J. , Albert, T.J. , Hannon, G.J. , 2007. Genome-wide in situ exon capture for selective resequencing. Nat. Genet. 39, 1522–1527. [DOI] [PubMed] [Google Scholar]
- Hollstein, M. , Hainaut, P. , 2010. Massively regulated genes: the example of TP53. J. Pathol. 220, 164–173. [DOI] [PubMed] [Google Scholar]
- Hubbell, E. , Liu, W.-M. , Mei, R. , 2002. Robust estimators for expression analysis. Bioinformatics 18, 1585–1592. [DOI] [PubMed] [Google Scholar]
- Jones, P.A. , Baylin, S.B. , 2002. The fundamental role of epigenetic events in cancer. Nat. Rev. Genet. 3, 415–428. [DOI] [PubMed] [Google Scholar]
- Jones, R.G. , Thompson, C.B. , 2009. Tumor suppressors and cell metabolism: a recipe for cancer growth. Genes Dev. 23, 537–548. [DOI] [PMC free article] [PubMed] [Google Scholar]
- Kanehisa, M. , Goto, S. , Sato, Y. , Furumichi, M. , Tanabe, M. , 2012. KEGG for integration and interpretation of large-scale molecular data sets. Nucleic Acids Res. 40, D109–D114. [DOI] [PMC free article] [PubMed] [Google Scholar]
- Knudson, A.G. , 1971. Mutation and cancer: statistical study of retinoblastoma. Proc. Natl. Acad. Sci. U S A 68, 820–823. [DOI] [PMC free article] [PubMed] [Google Scholar]
- Kubbutat, M.H. , Jones, S.N. , Vousden, K.H. , 1997. Regulation of p53 stability by Mdm2. Nature 387, 299–303. [DOI] [PubMed] [Google Scholar]
- Lee, E. , Chuang, H.-Y. , Kim, J.-W. , Ideker, T. , Lee, D. , 2008. Inferring pathway activity toward precise disease classification. PLoS Comput. Biol. 4, e1000217 [DOI] [PMC free article] [PubMed] [Google Scholar]
- Liberzon, A. , Subramanian, A. , Pinchback, R. , Thorvaldsdóttir, H. , Tamayo, P. , Mesirov, J.P. , 2011. Molecular signatures database (MSigDB) 3.0. Bioinformatics 27, 1739–1740. [DOI] [PMC free article] [PubMed] [Google Scholar]
- MacConaill, L.E. , Campbell, C.D. , Kehoe, S.M. , Bass, A.J. , Hatton, C. , Niu, L. , Davis, M. , Yao, K. , Hanna, M. , Mondal, C. , 2009. Profiling critical cancer gene mutations in clinical tumor samples. PLoS ONE 4, e7887 [DOI] [PMC free article] [PubMed] [Google Scholar]
- Mortazavi, A. , Williams, B.A. , McCue, K. , Schaeffer, L. , Wold, B. , 2008. Mapping and quantifying mammalian transcriptomes by RNA-Seq. Nat. Meth. 5, 621–628. [DOI] [PubMed] [Google Scholar]
- Payne, S.R. , Kemp, C.J. , 2005. Tumor suppressor genetics. Carcinogenesis 26, 2031–2045. [DOI] [PubMed] [Google Scholar]
- Petitjean, A. , Mathe, E. , Kato, S. , Ishioka, C. , Tavtigian, S.V. , Hainaut, P. , Olivier, M. , 2007. Impact of mutant p53 functional properties on TP53 mutation patterns and tumor phenotype: lessons from recent developments in the IARC TP53 database. Hum. Mutat. 28, 622–629. [DOI] [PubMed] [Google Scholar]
- Ponder, B.A. , 2001. Cancer genetics. Nature 411, 336–341. [DOI] [PubMed] [Google Scholar]
- Sherry, S.T. , Ward, M.H. , Kholodov, M. , Baker, J. , Phan, L. , Smigielski, E.M. , Sirotkin, K. , 2001. dbSNP: the NCBI database of genetic variation. Nucleic Acids Res. 29, 308–311. [DOI] [PMC free article] [PubMed] [Google Scholar]
- Stanbridge, E.J. , 1990. Human tumor suppressor genes. Annu. Rev. Genet. 24, 615–657. [DOI] [PubMed] [Google Scholar]
- Vassilev, L.T. , 2004. In vivo activation of the p53 pathway by small-molecule antagonists of MDM2. Science 303, 844–848. [DOI] [PubMed] [Google Scholar]
Associated Data
This section collects any data citations, data availability statements, or supplementary materials included in this article.
Supplementary Materials
Supplementary data
Supplementary data
Supplementary data
Supplementary data
Supplementary data
Supplementary data
Supplementary data