Pollen metabolism shows a dynamic transition from pollen grain germination to pollen tube growth and can quickly compensate inhibition of the oxidative phosporylation.
Abstract
Investigation of the metabolome and the transcriptome of pollen of lily (Lilium longiflorum) gave a comprehensive overview of metabolic pathways active during pollen germination and tube growth. More than 100 different metabolites were determined simultaneously by gas chromatography coupled to mass spectrometry, and expressed genes of selected metabolic pathways were identified by next-generation sequencing of lily pollen transcripts. The time-dependent changes in metabolite abundances, as well as the changes after inhibition of the mitochondrial electron transport chain, revealed a fast and dynamic adaption of the metabolic pathways in the range of minutes. The metabolic state prior to pollen germination differed clearly from the metabolic state during pollen tube growth, as indicated by principal component analysis of all detected metabolites and by detailed observation of individual metabolites. For instance, the amount of sucrose increased during the first 60 minutes of pollen culture but decreased during tube growth, while glucose and fructose showed the opposite behavior. Glycolysis, tricarbonic acid cycle, glyoxylate cycle, starch, and fatty acid degradation were activated, providing energy during pollen germination and tube growth. Inhibition of the mitochondrial electron transport chain by antimycin A resulted in an immediate production of ethanol and a fast rearrangement of metabolic pathways, which correlated with changes in the amounts of the majority of identified metabolites, e.g. a rapid increase in γ-aminobutyric acid indicated the activation of a γ-aminobutyric acid shunt in the tricarbonic acid cycle, while ethanol fermentation compensated the reduced ATP production after inhibition of the oxidative phosphorylation.
During fertilization in plants, the male gametophytes, the pollen, deliver the sperm cells to the ovaries, which are embedded in the pistil tissue. After landing on the stigma surface, the pollen grain starts to germinate a pollen tube that grows through the pistil tissue toward the egg cells, where it finally bursts and releases the sperm cells. The growth process of the pollen tube has been extensively studied during the last decades, and a specialized, tightly regulated network of various cellular processes contributes to the fast growth of pollen tubes. For instance, actin filaments transport secretory vesicles, which deliver cell wall and membrane material as well as membrane proteins to the growing tube tip, the plasma membrane H+-ATPase generates an electrochemical H+ gradient for the uptake of ions and nutrients, and several signal transduction pathways, including reversible protein phosphorylation, which regulates protein/enzyme activities, and a tip-localized gradient of cytosolic free Ca2+ concentration determines the growth direction (for review, see Hepler et al., 2001; Cheung and Wu, 2008; Michard et al., 2009). Furthermore, fundamental biological processes such as protein biosynthesis and metabolic pathways are active to provide the fast-growing pollen tube (approximately 10 µm min–1) with material and energy. Recent reviews (Rounds et al., 2011; Colaço et al., 2012) summarized the still very incomplete state of knowledge on pollen energy metabolism. Briefly, pollen germination and tube growth can be autotrophic or heterotrophic: in bicellular pollen, usually initial tube growth is autotrophic, using the stored nutrients, while later on, the heterotrophic pollen tube absorbs and metabolizes external sugars for generation of energy (ATP) and construction of new cell walls (O’Kelly, 1955; Labarca and Loewus, 1973). High rates of respiration usually higher than in sporophytic tissue (Tadege and Kuhlemeier, 1997) have been measured in pollen grains and tubes. For instance, in lily (Lilium longiflorum Thunb.) pollen grains, the first 30 min before germination are accompanied by rapid respiration rates corresponding also with the synthesis of starch grains (Dickinson, 1968; Nakamura et al., 1980). With the beginning of germination, the respiration rate decreases but raises again during the phase of steady tube growth (Dickinson, 1965, 1968), thus, generating all the necessary energy for tube elongation. Furthermore, a direct link between tube growth rates and the activity of oxidative phosphorylation (ATP production) was postulated by monitoring the concentration of cytosolic NAD(P)H+ in living pollen tubes (Cárdenas et al., 2006; Rounds et al., 2010).
However, the partial pressure of oxygen differs along the style tissue (Linskens and Schrauwen, 1966), and therefore, one might assume that tube growth rates may vary inside the style tissue due to changes in oxygen supply that affect the respiration rate. To maintain its high growth speed even in regions of lower partial pressure of oxygen, additional metabolic pathways for energy production may have to be active. Kuhlemeier and coworkers identified the pyruvate dehydrogenase bypass by which pollen grains produce ethanol to support the tricarbonic acid (TCA) cycle and lipid biosynthesis (Tadege et al., 1999; Mellema et al., 2002; Gass et al., 2005). This aerobic fermentation can be induced by blocking aerobic respiration with inhibitors of the electron transport chain (antimycin A, potassium cyanide) or the mitochondrial F-type ATPase (Rounds et al., 2010). Despite the progress during the last years of pollen research, the present knowledge about the role of metabolic pathways during pollen germination and tube growth is still fragmentary and incomplete, not to mention the interaction between metabolism and molecular as well as cellular processes that determine tube growth. For instance, energy metabolism and osmoregulation are likely coupled via the cytosolic ATP concentration and the plasma membrane H+-ATPase activity (Pertl et al., 2010).
Recent transcriptome studies identified a large number of mRNAs mainly in Arabidopsis (Arabidopsis thaliana) pollen that code for enzymes belonging to various metabolic pathways. The majority of studies including proteomic studies focused on differences between the expression levels of pollen and sporophytic tissue or of different states in pollen development (Becker et al., 2003; Honys and Twell, 2003; Pina et al., 2005; Bock et al., 2006). Only few studies focused on pollen tube growth (Dai et al., 2006; Wang et al., 2008; Grobei et al., 2009; Qin et al., 2009). Although metabolic pathway networks were reconstructed from these data (Boavida et al., 2005; Colaço et al., 2012) using the MAPMAN tool (Thimm et al., 2004), the correlation between the presence of mRNA, the amount of protein, and its specific activity remains uncertain (Gry et al., 2009; Taniguchi et al., 2010). So far, one may postulate that the metabolism of pollen is similar to that of sporophytic tissue if marker enzymes of specific metabolic pathways were identified, e.g. isocitrate lyase and malate synthetase for glyoxysomal function (Zhang et al., 1994). But detailed studies may reveal that at least parts of the pollen metabolism might be different due to its specific physiological role as suggested by Colaço et al. (2012).
To obtain a comprehensive view of the metabolic pathways active in pollen, metabolic profiling was performed in a time course during in vitro germination and tube growth and compared with metabolic profiles after inhibition of the mitochondrial electron transport chain. In addition, expression of involved enzymes was determined by next-generation sequencing of the transcriptome of lily. The overlapping of the metabolome and the transcriptome data result in an overview of metabolic pathways active during pollen germination and tube growth.
RESULTS
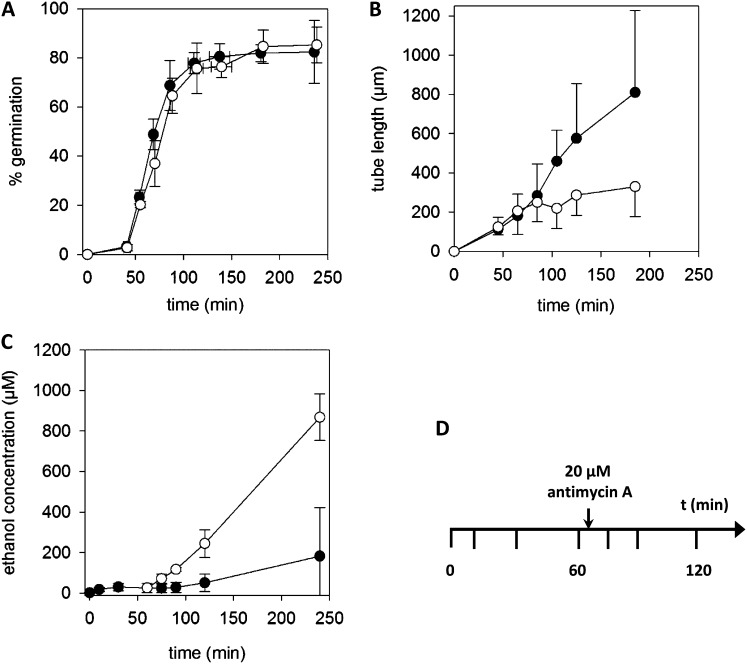
A basic in vitro pollen culture with mannitol-containing germination medium (Med M; autotrophic state) was used for obtaining a first overview of the metabolites and metabolic pathways active in pollen during germination and elongation of pollen tubes. Pollen grains of lily were washed with hexane to remove external hydrophobic compounds (pollenkitt and carotenoids), which might disturb subsequent analysis. Hexane-washed lily pollen grains germinated well in Med M, with more than 80% of germinated pollen grains after 2 h (Fig. 1A). Additionally, an average tube length of approximately 800 µm was reached after 3 h (Fig. 1B), which did not differ from untreated pollen grains (data not shown). The time points at which samples were prepared reflected specific physiological states during germination and growth of pollen tubes (Pertl et al., 2009): 0 min corresponds to mature, dehydrated pollen grains, 10 min corresponds to fully rehydrated pollen grains, 30 min corresponds to rehydrated pollen grains just before germination, 60 min corresponds to just-germinated pollen grains, and 75 to 240 min corresponds to growing pollen tubes. A significant decrease in the mean tube length was observed in the presence of 20 µm antimycin A, an inhibitor of complex III (cytochrome b/c1) of the mitochondrial electron transport chain, whereas the germination frequency was not affected, thus confirming previous studies (Rounds et al., 2010). However, the ethanol concentration of the external medium increased significantly after inhibiting the electron transport chain (Fig. 1C), indicating a switch to ethanolic fermentation (Tadege et al., 1999; Rounds et al., 2010). To study the dynamics of metabolic pathways in pollen, metabolites were not only determined at specific time points during pollen cultures (0, 10, 30, 60, 75, 90, 120, and 240 min), but the well-documented metabolic switch induced by antimycin A was used as an experimental challenge to test the metabolic flexibility of germinating pollen grains too, as shown in Figure 1D.
Figure 1.
Pollen in vitro culture. A, Germination of lily pollen is not affected by inhibition of the oxidative phosphorylation by 20 µm antimycin A (white circles). B, Pollen tube growth almost stops after addition of antimycin A. C, An increase in the ethanol concentration of the germination medium is observed after addition of antimycin A. Antimycin A was dissolved in DMSO and added at 65 min. An equivalent amount of DMSO was added to control experiments (black circles). D, Time scheme of the experimental schedule: pollen grains were suspended in germination medium at time point (t) 0 min, two petri dishes corresponding to 60 mg pollen grains were filtered at the indicated time points, the pollen pellet was frozen immediately in liquid nitrogen, and metabolites were extracted. After 65 min, antimycin A was added to one-half of the pollen cultures. Mean ± sd of four independent experiments.
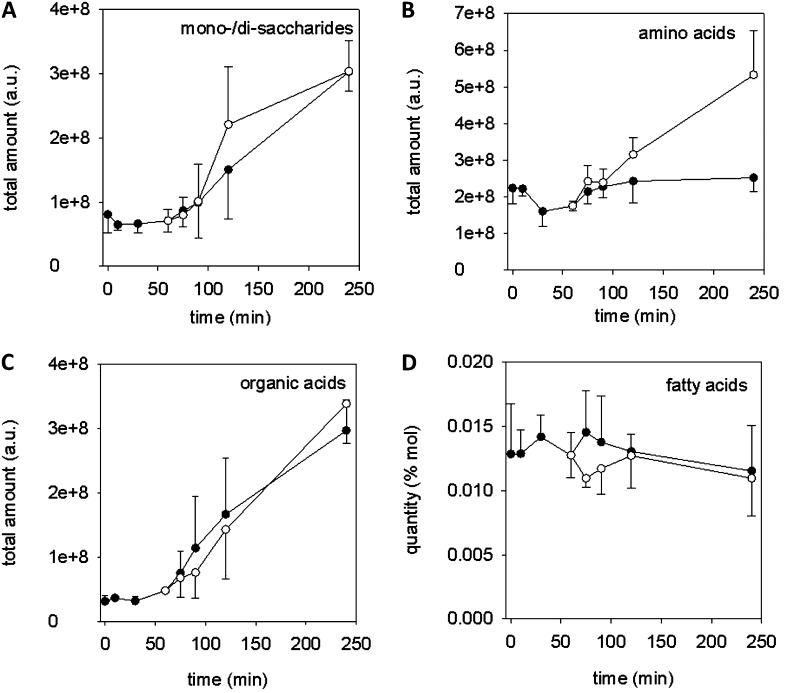
In a first analysis, all identified compounds were allocated to major metabolite classes (Fig. 2). The amount of sugars, represented by monosaccharides and disaccharides, was stable during the first 60 min and rose strongly with the onset of germination and tube growth (Fig. 2A). The amount of amino acids did not change much during pollen culture except for a slight decrease at time points 30 and 60 min, just around the time when germination becomes visible (Fig. 2B). The time course of organic acids (Fig. 2C), e.g. citrate and malate, was similar to the progression of sugars, whereas the amount of fatty acids hardly changed during the incubation time (Fig. 2D). After addition of antimycin A, the time courses of the amounts of sugars and organic acids did not change significantly, whereas the amounts of amino acids strongly increased approximately 45 min after antimycin A addition (Fig. 2B), thus indicating a change in metabolic activity. A sharp decrease of fatty acids was observed immediately after antimycin A addition (Fig. 2D). The majority (approximately 90%) of identified fatty acids consisted of palmitic acid (C16:0) and 18 carbon atom long chains with one, two, and three C = C bonds (C18:1, C18:2, and C18:3; Supplemental Table S1) that all showed the rapid perturbation followed by adjustment to normal levels (Supplemental Fig. S1).
Figure 2.
Time course of major metabolite classes during pollen in vitro culture. The sum of the arbitrary units (a.u.) of all metabolites belonging to the specific class was calculated from the results matrix file. The mean ± sd of three biological replicates is shown. A, Monosaccharides and disaccharides. B, Amino acids. C, Organic acids. D, Fatty acids in percentage of total mole amounts (% mol). Black circles indicate control, and white circles indicate addition of 20 µm antimycin A after 65 min.
Sugars
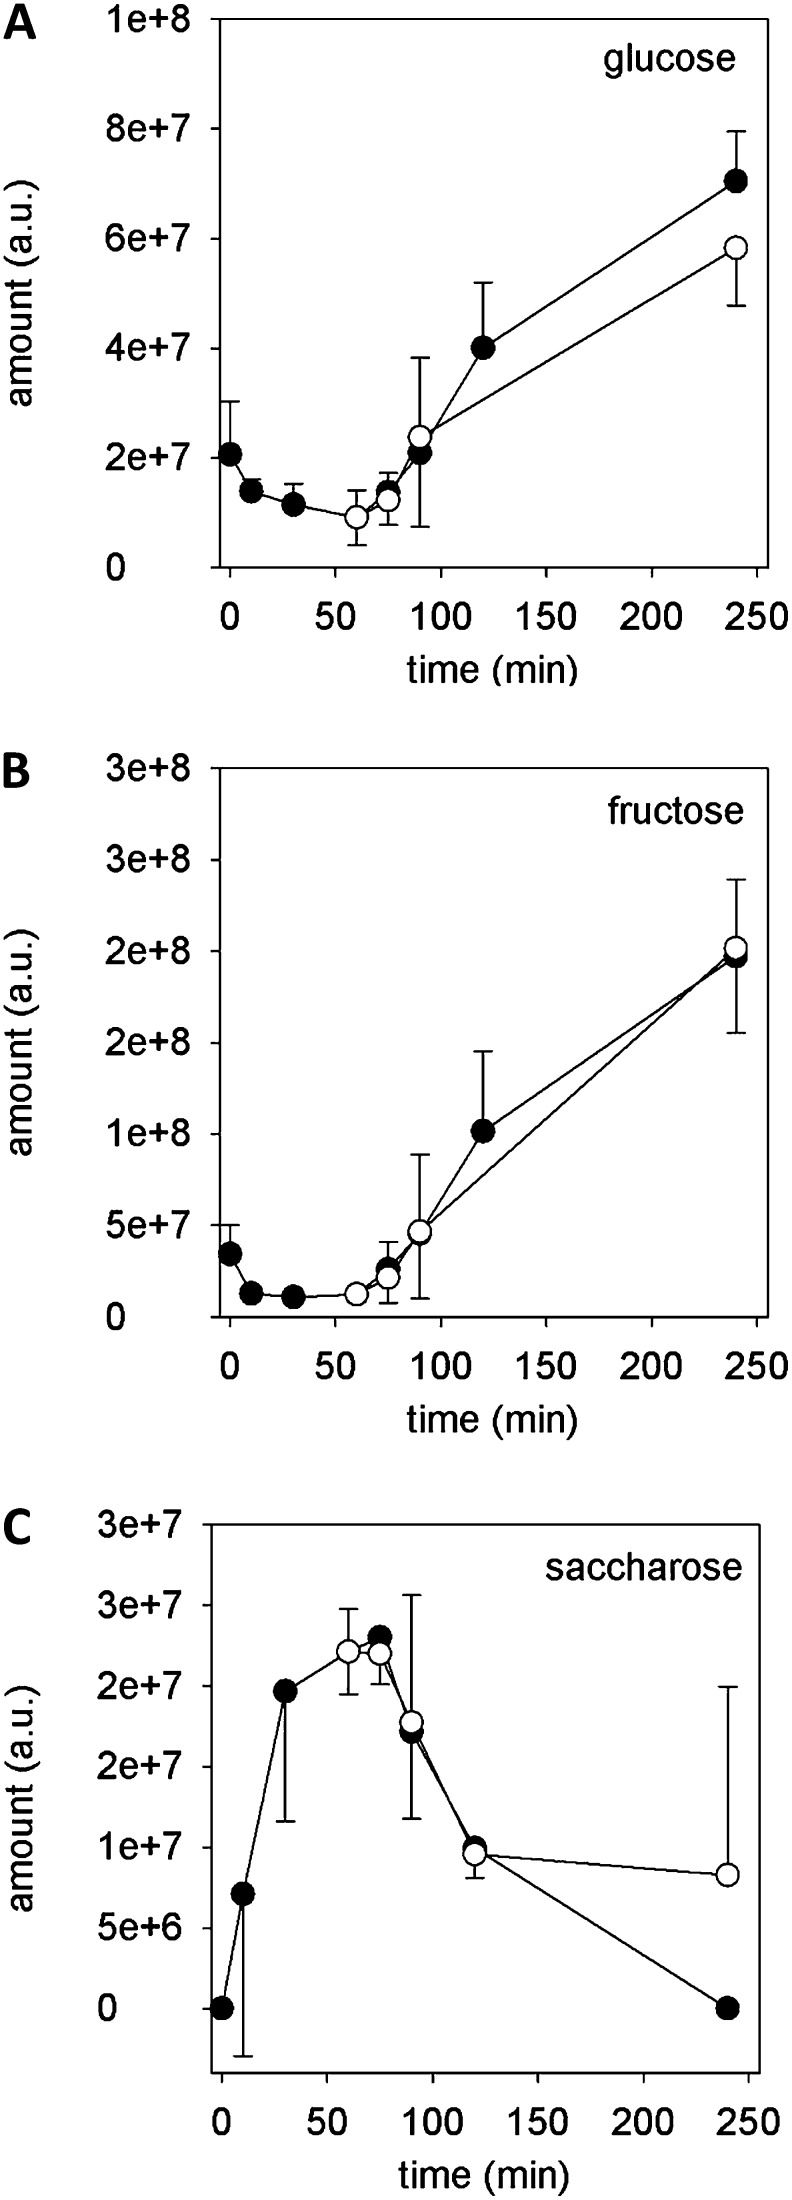
The time courses of Glc, Fru, and sucrose (Suc) amounts (Fig. 3) were selected, as their changes in abundance clearly demonstrated the connection between individual metabolites via metabolic pathways. The amounts of Glc and Fru slightly decreased during the first 30 to 60 min of pollen culture, which reflected the time before tube germination, while during tube growth, the amounts of both sugars increased (Fig. 3, A and B). The time course of the Suc amount was just diametrically opposed to that of Glc and Fru (Fig. 3C), an increase before germination (0–60 min) followed by a decrease during pollen tube growth (90–240 min). However, amounts of these sugars were not affected by inhibition of the oxidative phosphorylation. The decrease of Glc and Fru and the parallel increase in Suc before germination might reflect the generation of starch grains during the first phase of pollen cultivation (Dickinson, 1968; Nakamura et al., 1980). The later increase in both monosaccharides probably indicates starch degradation, which delivers the energy necessary for tube growth, and may also account for an increase in the osmotic potential of the tube’s cytosol to allow influx of water and keeping the turgor pressure constant (Benkert et al., 1997). Other monosaccharides, e.g. galactose or phosphorylated sugars, did not show any time-dependent changes (Supplemental Fig. S2).
Figure 3.
Time course of sugars Glc (A), Fru (B), and Suc (C). Black circles indicate control, and white circles indicate 20 µm antimycin A. Mean ± sd (n = 3).
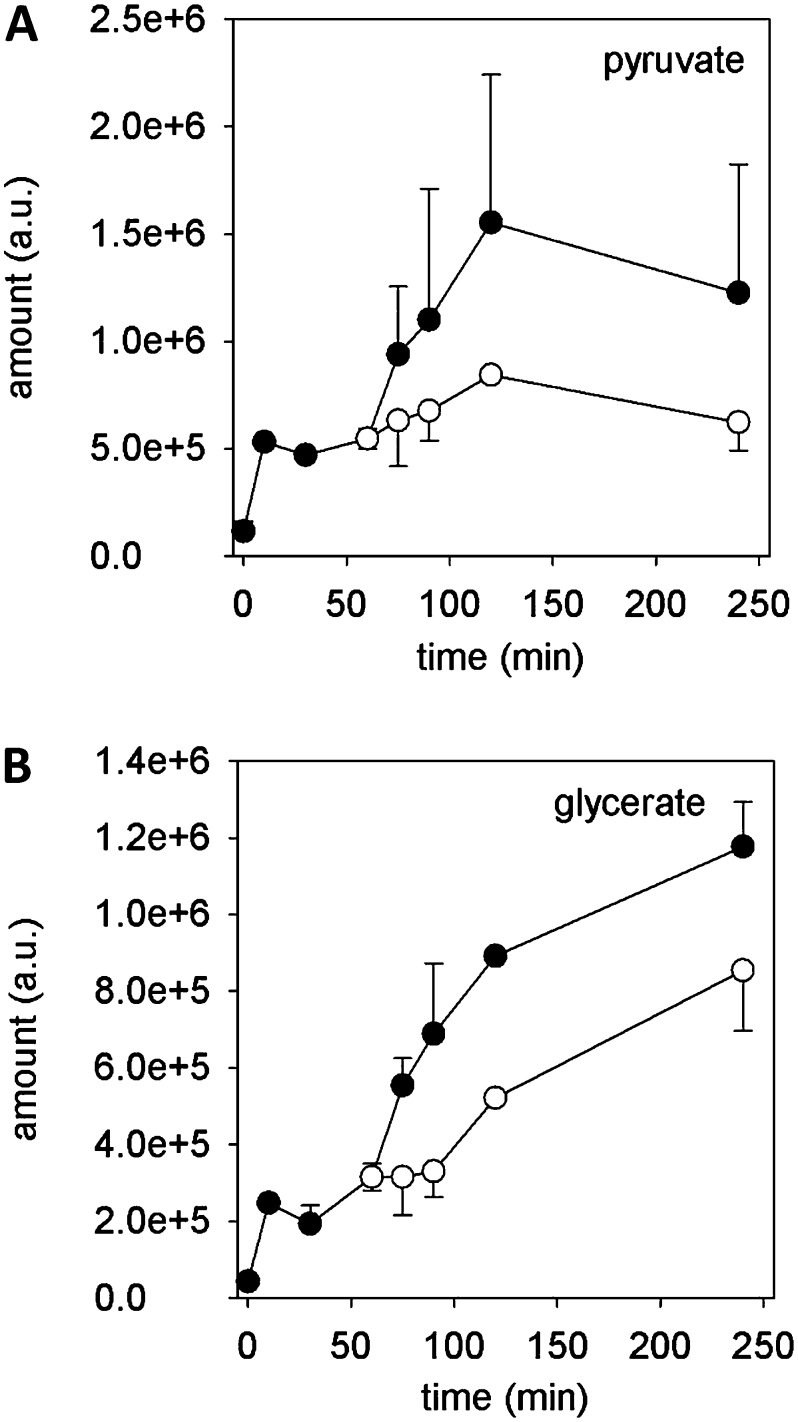
Additionally, degradation of Glc and Fru by glycolysis seems very likely to produce ATP and further compounds that are metabolized by other pathways. For instance, the amount of pyruvate increased with time, reaching a steady state after 120 min (Fig. 4A). An almost similar increase can be observed for glycerate without reaching a steady state (Fig. 4B). Both components may originate from glycolytic degradation of Glc or, in the case of glycerate, from storage lipids (triacylglycerols) and can be used to fuel the TCA cycle and glycerolipid metabolism, respectively. Inhibition of the mitochondrial electron transport chain reduced the amounts of both components (Fig. 4).
Figure 4.
Time-dependent metabolite changes. Pyruvate (A) and glycerate (B) increase during pollen in vitro culture and decrease after addition of antimycin A (black circles). Mean ± sd (n = 3).
Organic Acids
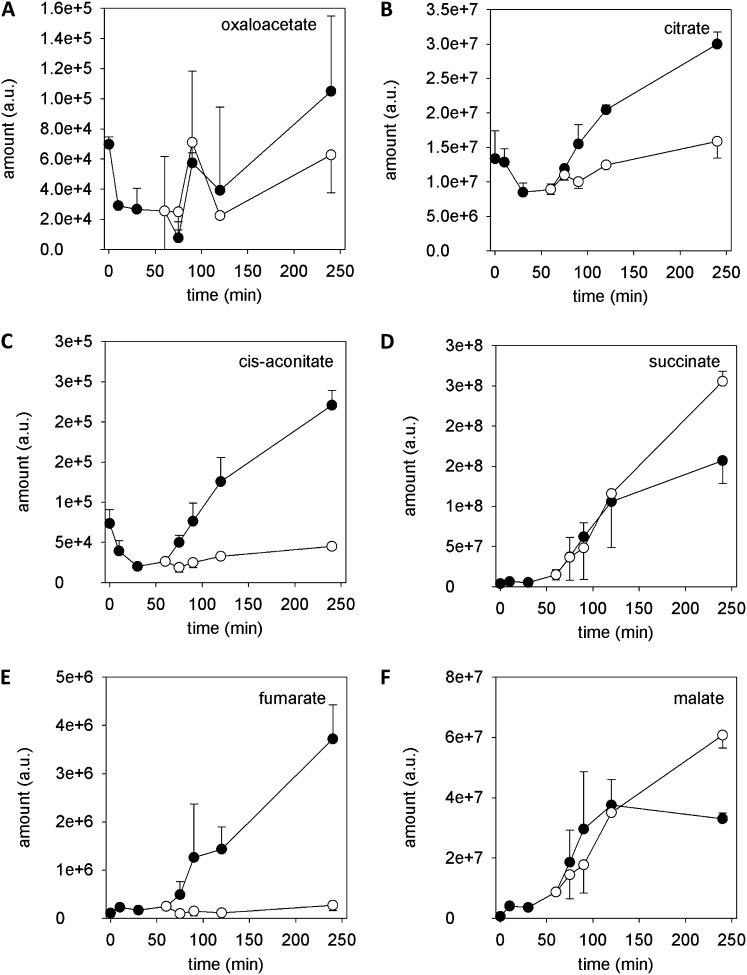
Following the metabolic fate of pyruvate, which enters the citrate cycle after carboxylation to oxaloacetate by the pyruvate carboxylase, 60% of the metabolites of the citrate cycle/TCA cycle (oxaloacetate, citrate, cis-aconitate, succinate, fumarate, and malate) were identified (Fig. 5), just missing isocitrate, oxalosuccinate, 2-oxoglutarate, and succinyl-CoA. The amounts of oxaloacetate, citrate, and cis-aconitate decreased during the first 30 min of pollen culture and increased thereafter (Fig. 5, A–C), whereas the amounts of succinate, fumarate, and malate steadily increased with incubation time (Fig. 5, D–F). Addition of antimycin A reduced the amounts of citrate, cis-aconitate, and fumarate immediately, whereas no instantaneous effects on the amounts of oxaloacetate, succinate, and malate were observed. Nevertheless, at 240 min, the amounts of succinate and malate were higher than in control pollen tubes (Fig. 5, D and F).
Figure 5.
Identified organic acids of the TCA cycle. Black circles indicate control, and white circles indicate 20 µm antimycin A. Mean ± sd (n = 3).
Amino Acids
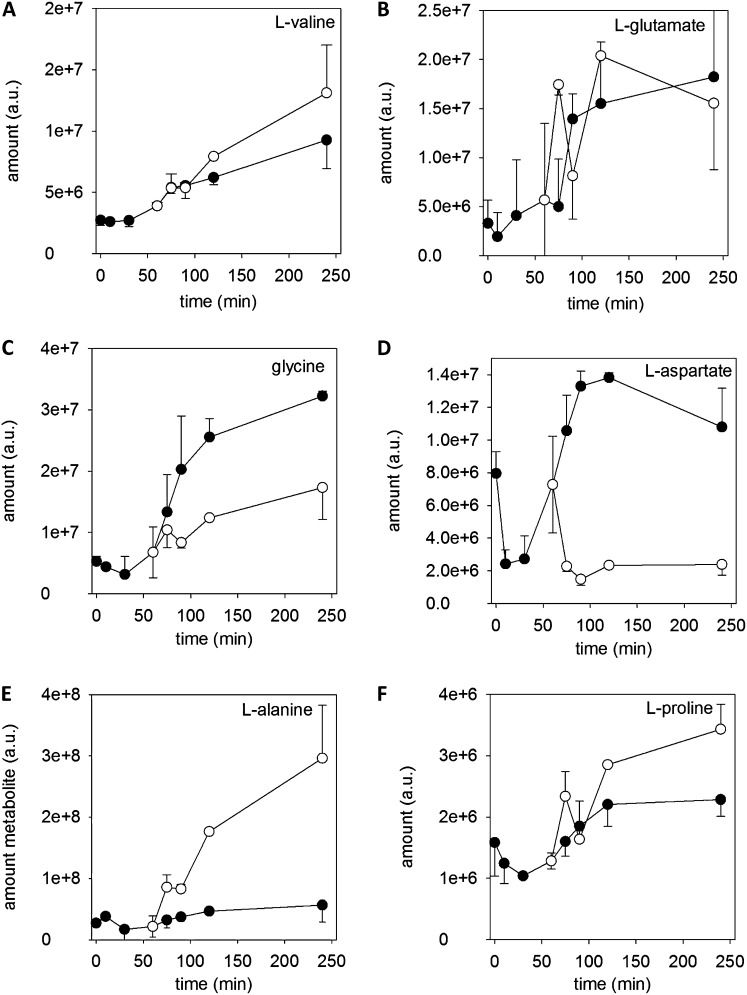
The amounts of amino acids showed a variable time course pattern, possibly due to their involvement in different metabolic pathways. The time course of each single amino acid identified is provided in Supplemental Figures S3 to S6. However, six general patterns can be noticed, which are shown in Figure 6. The largest group of amino acids showed a steady increase with time and a further increase after addition of antimycin A, as shown for Val (Fig. 6A) and noticed for Leu, Ile, Phe, Lys, His, Tyr, Thr, and Asn. A second group with similar time dependence consisted of Glu (Fig. 6B), Arg, and Cys, showing an increase after 60 min and reaching a steady state during tube growth. A likewise time course was observed for Gly (Fig. 6C), Gln, and Ser, whose amounts increased after 60 min to reach a steady level but which decreased after addition of antimycin A. The next groups show the specific time course pattern of three single amino acids, Asp, Ala, and Pro (Fig. 6, D–F). Asp showed a decline in the first 10 min and an increase after 30 min, reaching a steady level after 90 min. Immediately after inhibition of the electron transport chain, the amounts of Asp dropped to a low level (Fig. 6D). An opposite behavior can be assigned to Ala, which immediately increased after addition of antimycin A but whose level did not change during control pollen culture (Fig. 6E). Finally, Pro showed a slight decrease during the first 30 min, followed by an increase that reached a steady level at 120 min, which further increased after addition of antimycin A (Fig. 6F). The immediate responses of Asp and Ala to antimycin A addition, which opposed each other, may indicate the induction of new routes, including transamination and decarboxylation pathways, when oxidative phosphorylation is inhibited.
Figure 6.
Time course of the amount of amino acids. Examples of various time course patterns of amino acids and their responses to antimycin A are shown. A, l-Val as an example for the most common time course pattern. l-Leu, l-Ile, l-Phe, l-Lys, l-His, l-Asn, l-Tyr, and l-Thr show similar time dependence and response to antimycin A. B, l-Glu represents time courses similar to l-Arg and l-Cys. C, Time dependence of Gly similar to l-Gln and l-Ser. D, l-Asp. E, l-Ala. F, l-Pro. Black circles indicate control, and white circles indicate 20 µm antimycin A. Mean ± sd (n = 3).
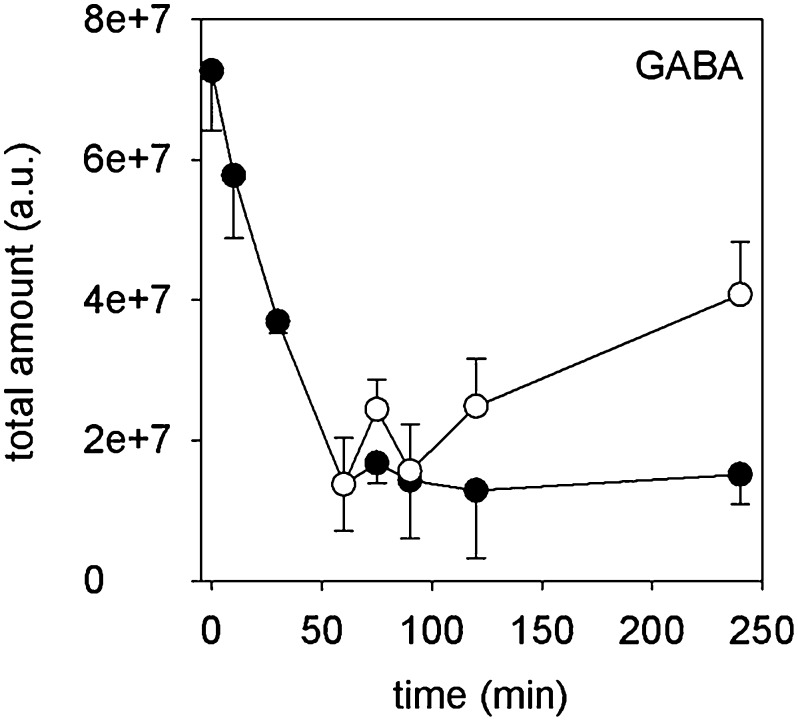
The time course of γ-aminobutyric acid (GABA) showed a special pattern (Fig. 7). The high initial amount of GABA declined during the first 60 min, reaching a low level during tube growth, but increased again after addition of antimycin A. This particular behavior of GABA may indicate the presence of a metabolic pathway until germination starts, which is switched off during tube growth, but again is activated after blocking the oxidative phosphorylation. The GABA shunt linking the amino acid metabolism to the citrate cycle might be a likely candidate for this pathway (Fait et al., 2008).
Figure 7.
Time course of GABA. Black circles indicate control, and white circles indicate 20 µm antimycin A. Mean ± sd (n = 3).
Identification of Enzymes of Metabolic Pathways
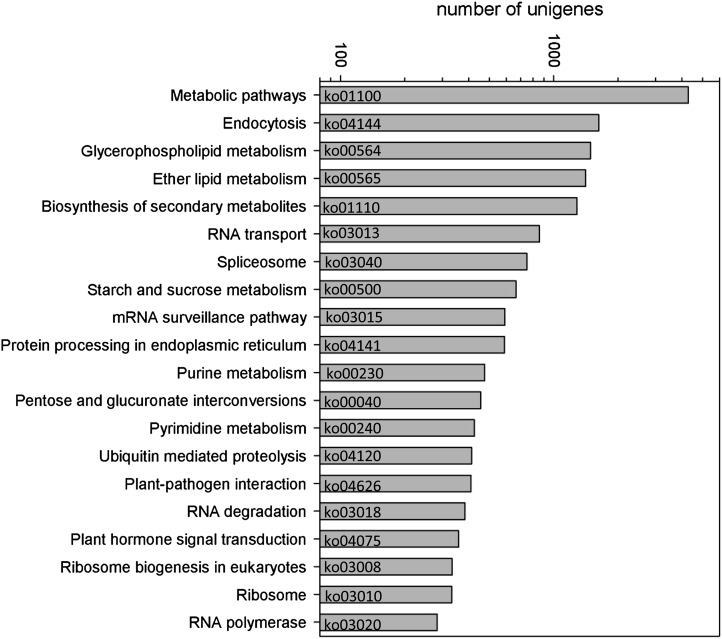
Additional to the metabolome, a transcriptome analysis was performed to confirm respective metabolic pathways by the presence of the corresponding transcript. Therefore, a pool of RNA fractions that were isolated from different phases of pollen grain germination and tube growth (0–240 min) was subjected to transcriptome sequencing. After removal of adapter sequences and low-quality reads (quality score below 20), a total of 59,494,488 clean sequencing reads was obtained, which consisted of 5.35-gigabase-pair nucleotides. These high-quality reads were assembled to 79,163 contigs and 37,409 unigenes with N50 of at least 447 bp for contigs and N50 of at least 752 bp for unigenes (N50 = 50% of the assembled bases were incorporated into sequences of more than 752-bp length). To identify proteins involved in metabolic pathways, unigenes were annotated according to the Kyoto Encyclopedia of Genes and Genomes (KEGG) pathway nomenclature, resulting in 15,787 identified sequences. The majority of unigenes distributed to pathways that were expected to be highly active in germinating and tube-growing pollen (Fig. 8). For instance, processes involved in transcription (RNA transport, splicosome, mRNA surveillance, RNA degradation, and RNA polymerase) and translation (protein processing in endoplasmic reticulum, ribosome biogenesis, and ribosomal proteins) as well as purine and pyrimidine metabolism showed high numbers of unigenes. The KEGG classification “Metabolic pathways” (ko01100 and ko01110) overlaps with specific pathway classification, e.g. “Starch and sucrose metabolism,” and thus showed high numbers of unigenes (>3,000). Approximately 1,000 unigenes were attributed to glycerophospholipid and ether lipid metabolism as well as starch and sucrose metabolism, probably indicating their important role during pollen germination and tube growth.
Figure 8.
Distribution of unigenes to KEGG pathways. The first 20 KEGG pathways with the highest numbers of unigenes are presented. The total number of unigenes was 15,787. KEGG pathway identifiers (e.g. ko01100) are given.
To combine the transcriptome and the metabolome data, all identified metabolites and identified unigenes from the metabolic pathways glycolysis (ko00010), citrate cycle (ko00020), fatty acid metabolism (ko00071), oxidative phosphorylation (ko00190), starch and sucrose (ko00500), and glyoxylate metabolism (ko00630) were chosen and incorporated into the scheme of the general KEGG pathway ko01100 for Arabidopsis (Supplemental Fig. S7), using the basic pathway mapping tool (http://www.genome.jp/kegg/pathway.html). The inserted metabolites and enzymes give an overview of the metabolic pathways that were detected in this study. Details of identified enzymes of specific metabolic pathways, e.g. isocitrate lyase for the glyoxylate cycle (Zhang et al., 1994) or an alcohol dehydrogenase active in ethanolic fermentation (Mellema et al., 2002), are given in Supplemental Table S2, with the corresponding sequences accessible via the Sequence Read Archive of the European Nucleotide Archive (http://www.ebi.ac.uk/ena/data/view/ERP002303; accession no. ERP002303).
Principal Component Analysis
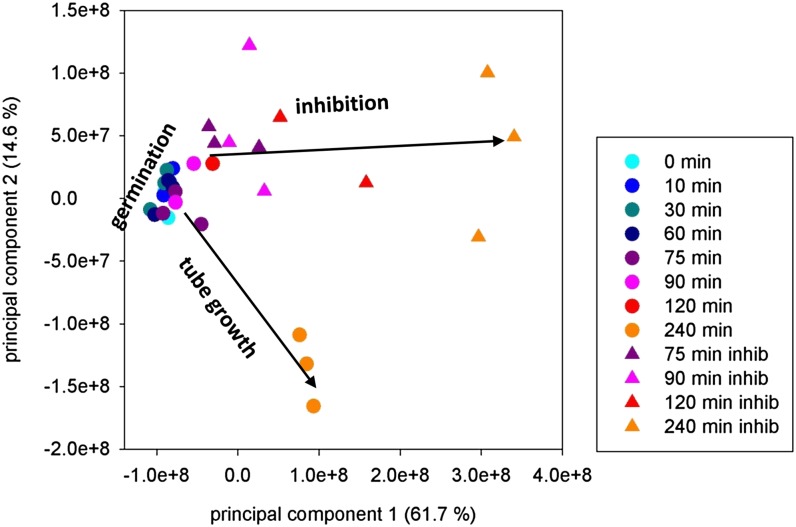
A multivariate statistical analysis of the metabolite data matrix (Supplemental Table S3) allows an unbiased view of pollen metabolism and therefore a principal component analysis was performed (Fig. 9). Clearly, the pregermination phase (0–60 min) and the tube growth phase (≥90 min) were separated (Fig. 9). Tube growth was determined by principal components 2 and 1, while germination was less affected by principal components 1 and 2 than by principal component 3 (Supplemental Fig. S8A). Despite the biological variations, a clear separation of the data of antimycin treated from control pollen tubes can be observed. After addition of antimycin A the inhibited tube growth is mainly determined by principal component 1. Additionally, we performed a biclustering analysis using COVAIN software (Sun and Weckwerth, 2012). In Supplemental Figure S8B, three major sample clusters can be observed: (1) 0 to 75 min, (2) 90 min, and (3) a cluster including the inhibited tube growth time points (90i–240i min) as well as the time points of tube growth 120 and 240 min. In this latter cluster, the time points of inhibited growth (90i–240i min) and normal growth are separated. Although the results of the biclustering analysis deviate from the principal component analysis results in some details, they support metabolic differences in germination, tube growth, and inhibited tube growth.
Figure 9.
Principal component analysis of all measured metabolites during time course and inhibition using a nontransformed data matrix (COVAIN software; Sun and Weckwerth, 2012) was performed. Arrows were drawn to guide the eye. The percentage of variance occupancy for the respective principal component is given in brackets. Unprocessed data matrix of three biological replicates was analyzed. Blue dots represent time points before and during germination (0–60 min), red dots indicate time points 75 to 240 min, and red triangles indicate time points 75 to 240 min in the presence of 20 µm antimycin A. Note that some data points may be covered by symbols of later time points, e.g. 0 min.
DISCUSSION
After landing on a stigma, pollen grains switch from a quiescent to an active state by taking up water and start to germinate and to grow a pollen tube as fast as possible to be first reaching the ovule. Therefore, pollen grains already contain the mRNAs and proteins that they need for fast germination (Mascarenhas, 1990), and as revealed by this study, the majority of metabolites is also immediately available to start germination.
Time Dependence of Pollen Metabolism
The results of the principal component analysis (Fig. 9; Supplemental Fig. S8A) support the idea that pollen metabolism changes at the transition from germination to tube growth, which can also be observed in the time dependence of metabolite abundances. For instance, an increase of Suc correlates with the pregermination phase, whereas during tube growth, Suc decreases (Fig. 3C), while metabolites of the TCA cycle increase during tube growth but show almost no changes prior to germination (Fig. 5). Previous studies also demonstrated metabolic differences between the germination and the tube growth process. While oligomycin, an inhibitor of the F0F1-ATP synthase, slowed down tube growth, germination frequencies of tobacco (Nicotiana tabacum) pollen are not affected (Gass et al., 2005), which was also confirmed for lily pollen (Rounds et al., 2010) and, in this study, for antimycin A (Fig. 1). Additionally, respiration rates were higher in the first 30 min of pollen cultures than during the tube growth phase (Dickinson, 1965), correlating with starch synthesis and starch degradation, respectively (Dickinson, 1968; Nakamura et al., 1980). It has to be noted that in previous studies of pollen metabolism, Suc-containing media were used, which may allow heterotrophic tube growth at later time points. However, these results fit well into the current study, maybe because the tubes were still in the autotrophic phase. A similar difference between the pregermination and the tube growth phase was observed in a proteomic study on lily pollen. Although the study was focused on membrane proteins, time-dependent changes of proteins belonging to carbohydrate and energy metabolism were observed in the first 60 min, where a rapid rise in peptide abundances occurred (Pertl et al., 2009). The changes in metabolome and proteome that accompany the obvious morphological changes between the pregermination and the tube growth phase imply that the pollen grains arrange and prepare their metabolic pathways for the most rapid and steady tube growth later on.
So far, the majority of transcriptome studies did not consider time-dependent aspects during germination and tube growth but were focused on the differences between pollen and sporophytic tissue or emphasized specific biological processes in pollen physiology and development or described differences between pollen grains and tubes of various species (Becker et al., 2003; Honys and Twell, 2003; Bock et al., 2006; Haerizadeh et al., 2009; Qin et al., 2009; Hafidh et al., 2012). A metabolic network was presented for Arabidopsis pollen using the transcriptome data of Pina et al. (2005) and the MAPMAN software (Thimm et al., 2004). This model showed the up- and down-regulation of transcripts of the general metabolism compared with sporophytic tissue (Boavida et al., 2005). Detailed transcriptome studies with a higher time resolution during germination and tube growth are still missing, but the changes in transcript levels between the different time points during pollen cultures might not be significant because the majority of mRNAs necessary for efficient tube growth is already present at a level that allows rapid translation into proteins (Mascarenhas, 1990) or, on the other hand, changes in the transcript level might not reflect differences at the protein and certainly not at the enzyme activity level (Gry et al., 2009; Taniguchi et al., 2010), which are, in combination with metabolite concentrations, absolutely essential for a functional metabolic pathway. Due to these limitations of transcriptome studies, the lily pollen transcriptomic data generated by next-generation sequencing in this study did not reflect a time dependence of transcript levels but gave an overview of the lily pollen transcripts to complement the metabolite data for constructing metabolic pathways (Supplemental Fig. S7). By incorporating the identified metabolites and enzymes of the carbohydrate and energy metabolism into the general metabolic network of Arabidopsis (KEGG, ko00100), the identified transcripts completed the metabolite map by connecting metabolites to putative metabolic pathways, which are very likely active in pollen (Supplemental Fig. S7). Most of the metabolites and enzymes were identified in the carbohydrate and energy pathways (glycolysis, starch degradation, TCA cycle, glyoxylate cycle, etc.), thus supporting the idea of pollen germination and tube growth as a high-energy consumption process (Rounds et al., 2011). Furthermore, reanalysis of ultrastructure images of lily pollen tubes showed a close association of starch grains, lipid droplets, mitochondria, and microbodies (glyoxysomes) as reported previously (Pais and Feijo, 1987; Charzynska et al., 1989), supporting a local connection between these metabolic pathways (Supplemental Fig. S9).
Aerobic Fermentation and GABA Shunt
To test the flexibility of the metabolic pathway network, the germinating pollen grains were challenged by inhibiting the mitochondrial electron transport chain, thus limiting the ATP production. The major results of this inhibition were well characterized by previous studies (Mellema et al., 2002; Gass et al., 2005; Rounds et al., 2010): an immediate increase in ethanol occurred upon addition of antimycin A due to a rerouting of pyruvate to ethanol fermentation. Both enzymes of this bypass, the pyruvate decarboxylase and the alcohol dehydrogenase, were identified in the lily pollen transcriptome (Supplemental Table S2), and the ethanol production was also monitored (Fig. 1C). A principal component analysis of the metabolome data of control and inhibited lily pollen reveal a major change in the entire pollen metabolism (Fig. 9). In antimycin A-treated pollen, the metabolite data depended mainly on principal component 1 instead of principal components 2 and 1 as observed for untreated pollen. These changes can also be observed in the large increases or decreases of specific metabolites after antimycin A treatment (e.g. dramatic changes in Gly, Ala, GABA, fumarate, etc.; Figs. 5–7; Supplemental Figs. S3–S5).
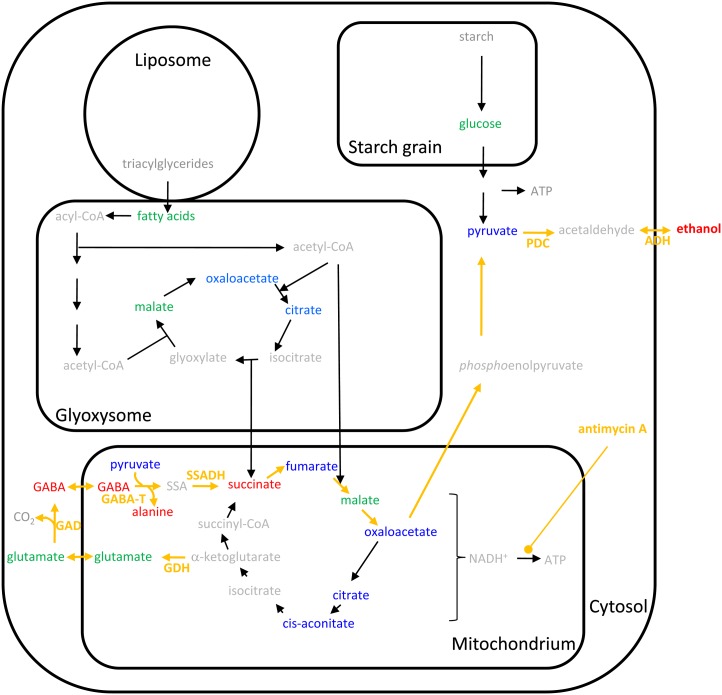
Notably, the already-declined amounts of GABA increased again immediately after inhibition of the electron transport chain (Fig. 7). In plants, changes of GABA levels have been reported due to stress, signaling, energy production, and maintenance of carbon/nitrogen balance by linking the TCA cycle and amino acid metabolism by the so-called GABA shunt (Fait et al., 2008). Inhibition of the ATP production via antimycin A may thus reactivate the GABA shunt to generate pyruvate for ethanol production. This hypothesis has been summarized in Figure 10. Inhibition of the oxidative phosphorylation leads to an increase in reduction equivalents (NAD(P)H+; Rounds et al., 2010) and probably to a decrease in ATP, which now has to be generated by other metabolic pathways, e.g. glycolysis. To avoid the accumulation of NAD(P)H+, which may affect the redox potential and thus the general activity of enzymes, ethanolic fermentation starts to consume reduction equivalents to produce ethanol via the pyruvate decarboxylase and the alcohol dehydrogenase. Furthermore, the GABA shunt, which includes the formation of Glu from α-ketoglutarate, decarboxylation of Glu to GABA, transamination of GABA to succinic semialdehyde, and finally reduction to succinate (Fig. 10), reduces the NAD(P)H+ pool and refills the pyruvate pool, which can then be used to produce ethanol or to generate Glc by gluconeogenesis. Finally, a higher glycolytic activity using Glc from starch degradation or gluconeogenesis can be used to compensate the reduced ATP production by the inhibited oxidative phosphorylation.
Figure 10.
A simplified scheme of changes in metabolic pathways after blocking mitochondrial electron transport chain. Detected metabolites are colored: blue indicates decrease after antimycin A, red indicates increase after antimycin A, green indicates no changes, and gray indicates not detected. Enzymes are given as arrows, with orange arrows indicating the putative pathway leading to ethanol production involving the GABA shunt after addition of antimycin A. Identified enzymes were labeled. SSA, Succinic semialdehyde; GDH, Glu dehydrogenase; GAD, Glu decarboxylase; GABA-T, GABA transaminase; SSADH, succinic semialdehyde dehydrogenase; PDC, pyruvate decarboxylase; ADH, alcohol dehydrogenase. See Supplemental Table S3 for identified enzymes.
CONCLUSION
A first study on the pollen metabolome in combination with a next-generation sequencing approach revealed a comprehensive overview of a putative metabolic pathway network that provides the germinating pollen grain and the growing pollen tube with energy and components for cell wall synthesis, protein biosynthesis, and other tip growth-related cellular processes. Because an omics study per se allows nontargeted analysis, it permits the detection of unexpected metabolites (Bocobza et al., 2012), e.g. GABA, and therefore the hypothesis of the function of a GABA shunt in pollen physiology. The metabolome itself also showed a highly dynamic behavior, indicating a change in metabolic pathways at the transition from the pollen grain to the tube growth phase, and also immediately reflected the compensation of an inhibited oxidative phosphorylation. However, this first study on the pollen metabolome may build the foundation for more detailed, specific investigations that might reveal noncanonical metabolic pathways in pollen (Colaço et al., 2012).
MATERIALS AND METHODS
Plant Material
Lily (Lilium longiflorum ‘White Europe’) plants were grown in the green house under environmental conditions with additional lighting for a 16-h-day/8-h-night cycle. Mature pollen grains from 25 flowers were harvested, frozen in liquid nitrogen, and stored at –80°C. For each time point, 60-mg aliquots of pollen grains were used for in vitro culture. They were first washed in 500 µL n-hexane to remove pollenkitt and other hydrophobic compounds of the pollen coat and then resuspended in 1 mL Med M containing 300 mm mannitol, 1.6 mm H3BO3, 1 mm KCl, and 0.1 mm CaCl2, pH 5.6, adjusted, if necessary, with MES or Tris. This pollen suspension (2 × 500 µL) was transferred to 2 × 20 mL germination medium in large plastic petri dishes (135-mm diameter). Germination frequency and tube length were determined from four time series, including the experiments that were used for metabolite determination (Fig. 1A).
Metabolite Extraction
Preparation of extracts followed the method developed by Weckwerth et al. (2004), with slight modifications. Pollen grains (60 mg) were incubated in Med M for 0, 10, 30, 60, 75, 90, 120, and 240 min (samples 0, 10, 30, 60, 75, 90, 120, and 240). After 65 min, antimycin A (Sigma) dissolved in dimethyl sulfoxide (DMSO) was added (final concentration of 20 µm) to pollen cultures that were collected after 75, 90, 120 and 240 min (samples 75i, 90i, 120i, and 240i; Figure 1D). In total, three independent time series and inhibition experiments were prepared for metabolite extraction. At each specific time point, the pollen grain suspension was rapidly vacuum filtered through 8-µm filters (Millipore), and the pollen pellets were immediately frozen in liquid nitrogen. All samples were homogenized by thoroughly grinding the pollen pellets to a fine powder in liquid nitrogen using a mortar and pestle. Frozen pollen powder was transferred to reaction tubes containing mixed ceramic beads (Peqlab) and 1 mL methanol:chloroform:water (MCW; 2.5:1:1, v/v), which was precooled at –20°C. Pollen grains were lysed by vortexing intervals (15-s vortex and 15 s on ice) for 3 min, freezing in liquid nitrogen, and another 3-min vortex interval. The pollen lysate was then transferred to a new tube, and the ceramic beads were washed with 1 mL MCW. The pooled, 2 mL MCW was centrifuged at 14,000g for 15 min at 4°C, and the supernatant was saved in a 15-mL centrifugation tube. The remaining pellet was washed with 1 mL precooled (–20°C) methanol:chloroform (1:1, v/v), vortexed thoroughly, and centrifuged at 14,000g for 15 min at 4°C. The supernatant was pooled with the previously collected MCW, 500 µL water were added, and the emulsion was mixed and finally centrifuged for 5 min at 1,000g at room temperature. One and one-half milliliters of the upper (methanol/water) phase and 400 µL of the lower (chloroform phase) were collected from each sample. All samples were lyophilized in a vacuum evaporator (Concentrator 5301, Eppendorf).
Metabolite Analysis
Dried hydrophilic extracts were dissolved in 20 µL methoxylamine hydrochloride in dry pyridine (40 mg mL–1) and incubated for 90 min at 30°C in a thermoshaker. One-milliliter aliquots of N-methyl-N-(trimethylsilyl) trifluoroacetamide (Macherey Nagel) were spiked with 60 µL retention index marker solution of even alkanes from C10 to C40 in hexane (Sigma-Aldrich) at a concentration of 50 mg L–1. Eighty microliters of this silylation mixture were added to the samples and incubated at 37°C for 30 min, followed by at least 1 h at room temperature. Samples were centrifuged, and 80 µL were transferred to standard vials with micro inserts.
For gas chromatography-mass spectrometry (GC-MS) analyses of hydrophilic metabolites, a LECO Pegasus 4D GC×GC TOFMS instrument (Mönchengladbach) was used. Injection of samples was performed with a split/splitless injector at a constant temperature of 230°C and equipped with a single-tapered liner with deactivated wool. Injection volume was 1 µL of derivatized sample, injection was performed at a split ratio of 1:50, and all samples were measured in duplicates. Gas chromatographic separation was conducted on HP-5MS column (30 m × 0.25 mm × 0.25 μm, Agilent Technologies) using helium as carrier gas at a flow rate of 1 mL min–1. Temperature gradient started at 70°C isothermal for 1 min, followed by a heating ramp of 9°C min–1 to 330°C held for 7 min. Transfer line temperature was 250°C, and ion source temperature was set to 200°C. Mass spectra were acquired with an acquisition rate of 20 spectra s–1 at a mass range of mass-to-charge ratio 40 to 600 thomson using a detector voltage of 1,500 V and electron impact ionization of 70 eV.
Dried lipophilic extracts were dissolved in 900 µL chloroform and divided into aliquots. A 200-µL aliquot was used for fatty acid methyl ester (FAME) analyses. Internal standard solution was prepared freshly using methyl heptadecanoate (C17) in CHCl3 at a concentration of 1 mg mL–1 and 10 µL were added to each sample before drying in a SpeedVac concentrator (Thermo Fisher Scientific). Small batches of samples (not more than six samples) were subjected to derivatization procedure directly before analyses. Pellet was dissolved in 295 µL methyl-tert-butyl ether, and 5 µL of trimethylsulfonium hydroxide were added and incubated at room temperature for 30 min. Supernatant of centrifuged samples was transferred to vials with microinserts and analyzed immediately by GC-MS. For GC-MS analyses of fatty acids, a Thermo GC-TSQ-MS instrument (Thermo Fisher Scientific) was used. Injector was equipped with a Siltek liner (Restek GmbH) and operated in splitless mode at a constant temperature of 260°C. A HP-5MS column (30 m × 0.25 mm × 0.25 μm) was used, and a temperature program started at 80°C was held for 2 min, followed by two ramps with heating rates of 3°C min–1 to 200°C and 10°C min–1 to 250°C held for 2 min and by postrun conditions of 300°C for 4 min. Flow rate of carrier gas (helium) was set to 5 mL min–1, transfer line temperature was 330°C, and ion source temperature was set to 250°C. Data acquisition was performed in full-scan mode with a scan range of mass-to-charge ratio 40 to 600 Th and at a scan time of 250 milliseconds.
Data Analysis
Data of hydrophilic extracts were analyzed using the instrument vendor’s software ChromaTof (Leco). A few representative chromatograms of different sampling time points were used to generate a reference peak list, and all other data files were processed against this reference. Retention index markers were used to calculate retention indices of compounds and for chromatographic alignment. Deconvoluted mass spectra were matched against an in-house mass spectral library, and this retention index was used for peak annotation too. Peak annotations, as well as peak integrations, were checked manually before exporting peak areas for relative quantification into a Microsoft Excel program. Areas of different trimethylsilyl derivatives of single metabolites were summed, and from methoxyamine products, only one peak was selected for further analyses. All hydrophilic metabolite amounts are given in arbitrary units corresponding to the peak areas of the chromatograms.
Data of lipophilic metabolites (FAMEs) were analyzed using LC-Quan (Thermo Fisher Scientific). Peak areas of identified methyl esters were normalized against the internal standard, and amount of substances was calculated using a calibration curve of various concentrations of reference standards. Amounts of fatty acids are expressed in percentage of total amount (mole) within a measurement.
For pathway annotation, all compounds were manually checked for their KEGG name and number and classified for component class and putative pathways. Compounds that could not be annotated by manual searches were only considered in multivariate statistics, which were performed with three biological replicates (Supplemental Table S3) using COVAIN (Sun and Weckwerth, 2012), a MATLAB tool box including a graphical user interface (MATLAB version 2010b; Math Works).
Determination of External Ethanol Concentrations
The ethanol concentration in the germination medium was determined with a coupled enzyme assay kit (no. 10176290035, Boehringer) following the manufacturer’s instructions.
RNA Isolation, Transcriptome Sequencing, and Data Analysis
Lily pollen grains were incubated in Med M for various times (0–240 min), and total RNA was extracted by a combination of the cetyl-trimethyl-ammonium bromide-based RNA extraction method and silica columns of a commercial (Qiagen RNA Plant Mini Kit) plant RNA extraction kit (Sangha et al., 2010). Samples were also treated by DNase. The isolated RNAs from the different time points were pooled afterward, and the quality was checked (NanoDrop, Thermo Fisher Scientific), giving a ratio of the optical density at 260 to 280 nm of 2.16 and optical density at 230 to 260 nm of 2.35. Agarose gel electrophoresis gave an ribosomal RNA ratio of 28S:18S of 2:1, and reverse transcription into complementary DNA (cDNA) with subsequent amplification of full-length sequences of the plasma membrane H+-ATPases LilHA1 and LilHA2 (accession nos. AY029190.2 and EF397610.2) and 14-3-3 proteins Lil1433_0, Lil1433_1, Lil1433_2, and Lil1433_3 (accession nos. AF191746.1, EF397607.1, EF397608.1, and EF397609.1) resulted in the expected PCR product length. mRNA was isolated from the pooled RNA preparations and transcribed to cDNA. This cDNA library was normalized to allow detection of rare mRNA sequences using Illumina HiSeq2000 technology (BGI Genomics). Sequence reads were assembled and annotated using homolog sequences of public databases (e.g. the nonredundant National Center for Biotechnology Information database and SwissProt), applying the company’s bioinformatics software. Identified sequences of metabolism proteins/enzymes were combined with already identified metabolites and inserted into KEGG pathway schemes. The data were submitted to the Sequence Data Archive (European Nucleotide Archive, http://www.ebi.ac.uk/ena/data/view/ERP002303).
Supplemental Data
The following materials are available in the online version of this article.
Supplemental Figure S1. Amounts of fatty acids during pollen in-vitro culture.
Supplemental Figure S2. Time course of galactose, glucose-6-phosphate and fructose-6-phosphate.
Supplemental Figure S3. Time course and response of aliphatic amino acids.
Supplemental Figure S4. Time course and response of acidic and alkaline amino acids.
Supplemental Figure S5. Time course and response of polar amino acids.
Supplemental Figure S6. Time course and response of sulphur-containing amino acids.
Supplemental Figure S7. Identified unigenes and metabolites mapped to the general metabolic network of Arabidopsis.
Supplemental Figure S8. Principal component and cluster analysis.
Supplemental Figure S9. Storage and metabolic organelles in a growing pollen tube.
Supplemental Table S1. List of fatty acids identified in this study.
Supplemental Table S2. Annotations of transcripts of analyzed KEGG pathways. Obermeyer_etal_metabolomics_Tab_S3_enzymeTranscripts.xls.
Supplemental Table S3. Metabolite data matrix. Obermeyer_etal_metabolomics_Tab_S2_metabolite raw data matrix.xls
Acknowledgments
We thank Sonja Bailer and Takeshi Furuhashi for excellent assistance with pollen in vitro cultures and FAME analysis, respectively, and Björn Usadel (Rheinisch-Westfälische Technische Hochschule Aachen and Forschungszentrum Jülich) for valuable discussions on RNA-seq.
Glossary
- TCA
tricarbonic acid
- Med M
mannitol-containing germination medium
- GABA
γ-aminobutyric acid
- KEGG
Kyoto Encyclopedia of Genes and Genomes
- DMSO
dimethyl sulfoxide
- MCW
methanol:chloroform:water
- GC-MS
gas chromatography-mass spectrometry
- FAME
fatty acid methyl ester
- cDNA
complementary DNA
References
- Becker JD, Boavida LC, Carneiro J, Haury M, Feijó JA. (2003) Transcriptional profiling of Arabidopsis tissues reveals the unique characteristics of the pollen transcriptome. Plant Physiol 133: 713–725 [DOI] [PMC free article] [PubMed] [Google Scholar]
- Benkert R, Obermeyer G, Bentrup F-W. (1997) The turgor pressure of growing lily pollen tubes. Protoplasma 198: 1–8 [Google Scholar]
- Boavida LC, Becker JD, Feijó JA. (2005) The making of gametes in higher plants. Int J Dev Biol 49: 595–614 [DOI] [PubMed] [Google Scholar]
- Bock KW, Honys D, Ward JM, Padmanaban S, Nawrocki EP, Hirschi KD, Twell D, Sze H. (2006) Integrating membrane transport with male gametophyte development and function through transcriptomics. Plant Physiol 140: 1151–1168 [DOI] [PMC free article] [PubMed] [Google Scholar]
- Bocobza S, Willmitzer L, Raikhel NV, Aharoni A. (2012) Discovery of new modules in metabolic biology using ChemoMetabolomics. Plant Physiol 160: 1160–1163 [DOI] [PMC free article] [PubMed] [Google Scholar]
- Cárdenas L, McKenna ST, Kunkel JG, Hepler PK. (2006) NAD(P)H oscillates in pollen tubes and is correlated with tip growth. Plant Physiol 142: 1460–1468 [DOI] [PMC free article] [PubMed] [Google Scholar]
- Charzynska M, Murgia M, Cresti M. (1989) Ultrastructure of the vegetative cell of Brassica napus pollen with particular reference to microbodies. Protoplasma 152: 22–28 [Google Scholar]
- Cheung AY, Wu H-M. (2008) Structural and signaling networks for the polar cell growth machinery in pollen tubes. Annu Rev Plant Biol 59: 547–572 [DOI] [PubMed] [Google Scholar]
- Colaço R, Moreno N, Feijó JA. (2012) On the fast lane: mitochondria structure, dynamics and function in growing pollen tubes. J Microsc 247: 106–118 [DOI] [PubMed] [Google Scholar]
- Dai S, Li L, Chen T, Chong K, Xue Y, Wang T. (2006) Proteomic analyses of Oryza sativa mature pollen reveal novel proteins associated with pollen germination and tube growth. Proteomics 6: 2504–2529 [DOI] [PubMed] [Google Scholar]
- Dickinson DB. (1965) Germination of lily pollen: respiration and tube growth. Science 150: 1818–1819 [DOI] [PubMed] [Google Scholar]
- Dickinson DB. (1968) Rapid starch synthesis associated with increased respiration in germinating lily pollen. Plant Physiol 43: 1–8 [DOI] [PMC free article] [PubMed] [Google Scholar]
- Fait A, Fromm H, Walter D, Galili G, Fernie AR. (2008) Highway or byway: the metabolic role of the GABA shunt in plants. Trends Plant Sci 13: 14–19 [DOI] [PubMed] [Google Scholar]
- Gass N, Glagotskaia T, Mellema S, Stuurman J, Barone M, Mandel T, Roessner-Tunali U, Kuhlemeier C. (2005) Pyruvate decarboxylase provides growing pollen tubes with a competitive advantage in petunia. Plant Cell 17: 2355–2368 [DOI] [PMC free article] [PubMed] [Google Scholar]
- Grobei MA, Qeli E, Brunner E, Rehrauer H, Zhang R, Roschitzki B, Basler K, Ahrens CH, Grossniklaus U. (2009) Deterministic protein inference for shotgun proteomics data provides new insights into Arabidopsis pollen development and function. Genome Res 19: 1786–1800 [DOI] [PMC free article] [PubMed] [Google Scholar]
- Gry M, Rimini R, Strömberg S, Asplund A, Pontén F, Uhlén M, Nilsson P. (2009) Correlations between RNA and protein expression profiles in 23 human cell lines. BMC Genomics 10: 365. [DOI] [PMC free article] [PubMed] [Google Scholar]
- Haerizadeh F, Wong CE, Bhalla PL, Gresshoff PM, Singh MB. (2009) Genomic expression profiling of mature soybean (Glycine max) pollen. BMC Plant Biol 9: 25. [DOI] [PMC free article] [PubMed] [Google Scholar]
- Hafidh S, Breznenová K, Růžička P, Feciková J, Capková V, Honys D. (2012) Comprehensive analysis of tobacco pollen transcriptome unveils common pathways in polar cell expansion and underlying heterochronic shift during spermatogenesis. BMC Plant Biol 12: 24. [DOI] [PMC free article] [PubMed] [Google Scholar]
- Hepler PK, Vidali L, Cheung AY. (2001) Polarized cell growth in higher plants. Annu Rev Cell Dev Biol 17: 159–187 [DOI] [PubMed] [Google Scholar]
- Honys D, Twell D. (2003) Comparative analysis of the Arabidopsis pollen transcriptome. Plant Physiol 132: 640–652 [DOI] [PMC free article] [PubMed] [Google Scholar]
- Labarca C, Loewus F. (1973) The nutritional role of pistil exudate in pollen tube wall formation in Lilium longiflorum. Plant Physiol 52: 87–92 [DOI] [PMC free article] [PubMed] [Google Scholar]
- Linskens HF, Schrauwen J. (1966) Measurement of oxygen tension changes in the style during pollen tube growth. Planta 71: 98–106 [DOI] [PubMed] [Google Scholar]
- Mascarenhas JP. (1990) Gene activity during pollen development. Annu Rev Plant Physiol Plant Mol Biol 41: 317–338 [Google Scholar]
- Mellema S, Eichenberger W, Rawyler A, Suter M, Tadege M, Kuhlemeier C. (2002) The ethanolic fermentation pathway supports respiration and lipid biosynthesis in tobacco pollen. Plant J 30: 329–336 [DOI] [PubMed] [Google Scholar]
- Michard E, Alves F, Feijó JA. (2009) The role of ion fluxes in polarized cell growth and morphogenesis: the pollen tube as an experimental paradigm. Int J Dev Biol 53: 1609–1622 [DOI] [PubMed] [Google Scholar]
- Nakamura N, Sado M, Arai Y. (1980) Sucrose metabolism during the growth of Camellia japonica pollen. Phytochem 19: 205–209 [Google Scholar]
- O’Kelly JC. (1955) External carbohydrates in growth and respiration of pollen tubes in vitro. Am J Bot 42: 322–327 [Google Scholar]
- Pais MS, Feijo JA. (1987) Microbody proliferation during microsporogenesis of Ophrys luta Cav. (Orchidaceae). Protoplasma 138: 149–155 [Google Scholar]
- Pertl H, Pöckl M, Blaschke C, Obermeyer G. (2010) Osmoregulation in Lilium pollen grains occurs via modulation of the plasma membrane H+ ATPase activity by 14-3-3 proteins. Plant Physiol 154: 1921–1928 [DOI] [PMC free article] [PubMed] [Google Scholar]
- Pertl H, Schulze WX, Obermeyer G. (2009) The pollen organelle membrane proteome reveals highly spatial-temporal dynamics during germination and tube growth of lily pollen. J Proteome Res 8: 5142–5152 [DOI] [PubMed] [Google Scholar]
- Pina C, Pinto F, Feijó JA, Becker JD. (2005) Gene family analysis of the Arabidopsis pollen transcriptome reveals biological implications for cell growth, division control, and gene expression regulation. Plant Physiol 138: 744–756 [DOI] [PMC free article] [PubMed] [Google Scholar]
- Qin Y, Leydon AR, Manziello A, Pandey R, Mount D, Denic S, Vasic B, Johnson MA, Palanivelu R. (2009) Penetration of the stigma and style elicits a novel transcriptome in pollen tubes, pointing to genes critical for growth in a pistil. PLoS Genet 5: e1000621. [DOI] [PMC free article] [PubMed] [Google Scholar]
- Rounds CM, Hepler PK, Fuller SJ, Winship LJ. (2010) Oscillatory growth in lily pollen tubes does not require aerobic energy metabolism. Plant Physiol 152: 736–746 [DOI] [PMC free article] [PubMed] [Google Scholar]
- Rounds CM, Winship LJ, Hepler PK. (2011) Pollen tube energetics: respiration, fermentation and the race to the ovule. AoB Plants 2011: plr019. [DOI] [PMC free article] [PubMed] [Google Scholar]
- Sangha JS, Gu K, Kaur J, Yin Z. (2010) An improved method for RNA isolation and cDNA library construction from immature seeds of Jatropha curcas L. BMC Res Notes 3: 126. [DOI] [PMC free article] [PubMed] [Google Scholar]
- Sun X, Weckwerth W. (2012) COVAIN: a toolbox for uni- and multivariate statistics, time-series and correlation network analysis and inverse estimation of the differential Jacobian from metabolomics covariance data. Metabolomics 8: S81–S93 [Google Scholar]
- Tadege M, Dupuis I, Kuhlemeier C. (1999) Ethanolic fermentation: new functions for an old pathway. Trends Plant Sci 4: 320–325 [DOI] [PubMed] [Google Scholar]
- Tadege M, Kuhlemeier C. (1997) Aerobic fermentation during tobacco pollen development. Plant Mol Biol 35: 343–354 [DOI] [PubMed] [Google Scholar]
- Taniguchi Y, Choi PJ, Li G-W, Chen H, Babu M, Hearn J, Emili A, Xie XS. (2010) Quantifying E. coli proteome and transcriptome with single-molecule sensitivity in single cells. Science 329: 533–538 [DOI] [PMC free article] [PubMed] [Google Scholar]
- Thimm O, Bläsing O, Gibon Y, Nagel A, Meyer S, Krüger P, Selbig J, Müller LA, Rhee SY, Stitt M. (2004) MAPMAN: a user-driven tool to display genomics data sets onto diagrams of metabolic pathways and other biological processes. Plant J 37: 914–939 [DOI] [PubMed] [Google Scholar]
- Wang Y, Zhang W-Z, Song L-F, Zou J-J, Su Z, Wu W-H. (2008) Transcriptome analyses show changes in gene expression to accompany pollen germination and tube growth in Arabidopsis. Plant Physiol 148: 1201–1211 [DOI] [PMC free article] [PubMed] [Google Scholar]
- Weckwerth W, Wenzel K, Fiehn O. (2004) Process for the integrated extraction, identification and quantification of metabolites, proteins and RNA to reveal their co-regulation in biochemical networks. Proteomics 4: 78–83 [DOI] [PubMed] [Google Scholar]
- Zhang JZ, Laudencia-Chingcuanco DL, Comai L, Li M, Harada JJ. (1994) Isocitrate lyase and malate synthase genes from Brassica napus L. are active in pollen. Plant Physiol 104: 857–864 [DOI] [PMC free article] [PubMed] [Google Scholar]


