Ocean acidification and fast mixing or fluctuation of solar radiation could act synergistically to lower carbon fixation by G. oceanica, though ocean acidification may decrease UVB-related photochemical inhibition.
Abstract
Mixing of seawater subjects phytoplankton to fluctuations in photosynthetically active radiation (400–700 nm) and ultraviolet radiation (UVR; 280–400 nm). These irradiance fluctuations are now superimposed upon ocean acidification and thinning of the upper mixing layer through stratification, which alters mixing regimes. Therefore, we examined the photosynthetic carbon fixation and photochemical performance of a coccolithophore, Gephyrocapsa oceanica, grown under high, future (1,000 μatm) and low, current (390 μatm) CO2 levels, under regimes of fluctuating irradiances with or without UVR. Under both CO2 levels, fluctuating irradiances, as compared with constant irradiance, led to lower nonphotochemical quenching and less UVR-induced inhibition of carbon fixation and photosystem II electron transport. The cells grown under high CO2 showed a lower photosynthetic carbon fixation rate but lower nonphotochemical quenching and less ultraviolet B (280–315 nm)-induced inhibition. Ultraviolet A (315–400 nm) led to less enhancement of the photosynthetic carbon fixation in the high-CO2-grown cells under fluctuating irradiance. Our data suggest that ocean acidification and fast mixing or fluctuation of solar radiation will act synergistically to lower carbon fixation by G. oceanica, although ocean acidification may decrease ultraviolet B-related photochemical inhibition.
The oceans absorb about 25 million tons of CO2 per day from the atmosphere (Sabine et al., 2004), leading to the acidification of seawater in surface oceans. The pH of oceanic surface seawater will decline by 0.3 to 0.4 units, reflecting a 100% to 150% increase in [H+], by the year 2100 under “a fossil-fuel intensive” emission scenario (Houghton, 2001). This ocean acidification and the associated chemical changes may bring about critical ecological and social consequences (Turley et al., 2010).
Coccolithophores, as a key group of oceanic primary producers, with coccolith scales made of CaCO3, are important to global carbon cycles (Riebesell and Tortell, 2011). Ocean acidification generally decreases calcification by coccolithophores (Riebesell et al., 2000; Zondervan et al., 2002; Delille et al., 2005; Beaufort et al., 2011) and other calcifying algae (Gao and Zheng, 2010; Sinutok et al., 2011), with responses differing across species or different environmental conditions (Langer et al., 2006, 2009; Iglesias-Rodriguez et al., 2008; Doney et al., 2009; Shi et al., 2009). Algal calcification, in turn, influences the impacts of solar ultraviolet radiation (UVR; 280–400 nm) on the algae’s photophysiology (Gao et al., 2009; Gao and Zheng, 2010; Guan and Gao, 2010).
Although the Montreal Protocol has resulted in a slowing of ozone depletion, ultraviolet B (UVB) irradiance (280–315 nm) reaching northern temperate regions increased 10% between 1983 and 2003 (Josefsson, 2006), and a recent observation found an ozone hole above the Arctic (Manney et al., 2011), reflecting ongoing impacts of climate change on ozone depletion. Biologically significant levels of UVR reach as deep as 80 m in pelagic oceans (Smith et al., 1992). In coastal waters or areas with high productivity, UVB irradiance usually penetrates only a few meters due to the attenuation caused by suspended particles and dissolved organic matter (Hargreaves, 2003; Tedetti and Sempéré, 2006). Ultraviolet A (UVA) and photosynthetically active radiation (PAR) are also attenuated but penetrate to much deeper depths due to their wavelength properties and intensities. UVA and UVB can both act synergistically with ocean acidification to inhibit algal photosynthetic performance (Gao et al., 2009), and the inhibition caused by UVB could be about 2.5 times that caused by UVA (Gao and Zheng, 2010); however, an antagonistic effect of UVB and ocean acidification was also found in a diatom (Li et al., 2012).
In parallel, global warming due to increased atmospheric CO2 concentration causes ocean warming, which results in a decrease in the depth of the upper mixing layer (UML; Sarmiento et al., 2004). Such stratification increases integrated exposures of phytoplankton cells within the UML to solar UVR and visible radiation and decreases the upward transport of nutrients from deeper water layers, influencing phytoplankton photophysiology (Beardall et al., 2009; Gao et al., 2012a). Fluctuations of both solar PAR and UVR within the UML affect phytoplankton photosynthetic activity and carbon fixation (Helbling et al., 2003; Villafañe et al., 2007; Guan and Gao, 2008; Dimier et al., 2009). Mixing depths and/or mixing rates in the upper oceans also change in response to increased stratification and/or wind speed due to global climate change (Sarmiento et al., 2004; Boyd et al., 2010).
Phytoplankton responses to fluctuating solar radiation vary, particularly if considered in combination with other environmental factors, due to antagonistic or synergistic interactions. Fluctuation of solar radiation on cloudy days led to higher primary production in the presence of UVA (315–400 nm) as compared with the presence of UVA on sunny days (Gao et al., 2007). Algal acclimation to fluctuating irradiance can lead to differences in growth rates and cellular pigment content compared with the cells acclimated to constant irradiance (Van de Poll et al., 2007, 2010). On the other hand, the mixing rate in the UML is strongly controlled by wind (Denman and Gargett, 1983; MacIntyre, 1993), which may increase due to global warming (Toggweiler and Russell, 2008). Therefore, changes in mixing rate and stratification may interact with ocean acidification to affect the photophysiology of phytoplankton. Nevertheless, to our knowledge, nothing has yet been documented on the combined impacts of the fluctuation of PAR or UVR and ocean acidification on the photosynthetic performance of coccolithophores.
Under this scenario, we expect that the photosynthesis of coccolithophores will respond differentially to fluctuating PAR, with or without UVR, when grown under ocean acidification conditions, since the balance of high PAR- or UVR-induced damage and the counteracting repair could differ under elevated CO2 or acidity. To test these interactions, we grew Gephyrocapsa oceanica, which is widely distributed in temperate and tropical waters (Okabe, 1997), under current and ocean acidification conditions and examined its photochemical activity and photosynthesis under different combinations of fluctuating PAR and UVR.
RESULTS
Carbonate System
The carbonate system in the high-CO2 (HC; 1,000 μatm) growth treatment differed significantly from the low-CO2 (LC; 390 μatm) growth treatment (Table I). Within a CO2 treatment, the carbonate system was stable within 5%, across rounds of culture dilution with fresh medium, showing that the biological activities in the dilute cultures had no significant influence upon the carbonate system, in comparison with the medium composition and the CO2 bubbling regime.
Table I. Parameters of the seawater carbonate system under HC (1,000 μatm) and LC (390 μatm) levels before and after the partial renewal of the medium in semicontinuous cultures of G. oceanica.
pH, pCO2, salinity, nutrient concentration, and temperature were used to derive the other parameters using CO2 system analyzing software (CO2SYS). Data are means ± sd of 24 measurements; the letters represent significant differences between HC and LC cultures. There were no significant changes in the seawater carbonate system before and after medium renewal. DIC, Dissolved inorganic carbon; pHNBS, the National Bureau of Standards pH.
| Condition | pCO2 | pHNBS | DIC | HCO3− | CO32− | CO2 | Total Alkalinity |
|---|---|---|---|---|---|---|---|
| μatm | µmol L−1 | ||||||
| LC, before renewal | 389 ± 11 a | 8.17 ± 0.01 a | 1,929 ± 31 a | 1,730 ± 25 a | 186 ± 8 a | 12.6 | 2,188 ± 40 a |
| LC, after renewal | 402 ± 16 a | 8.15 ± 0.01 a | 1,915 ± 60 a | 1,724 ± 52 a | 178 ± 10 a | 13.1 | 2,163 ± 70 a |
| HC, before renewal | 984 ± 18 b | 7.81 ± 0.01 b | 2,090 ± 28 b | 1,963 ± 25 b | 95 ± 3.3 b | 31.8 | 2,196 ± 32 a |
| HC, after renewal | 1,006 ± 21 b | 7.81 ± 0.01 b | 2,077 ± 36 b | 1,952 ± 32 b | 92 ± 4 b | 32.5 | 2,282 ± 109 a |
Light Absorption Spectra and Photochemical Performance
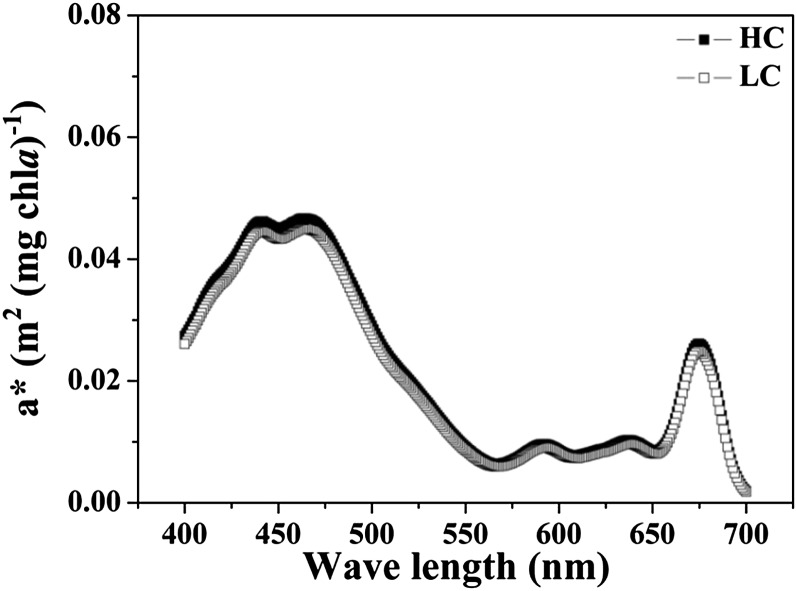
The mean chlorophyll a (chl a)-specific absorption coefficient for the PAR irradiance spectrum supplied by the solar simulator was 0.0184 ± 0.002 (sd) m2 mg−1 chl a in the HC-grown cells and 0.0177 ± 0.003 m2 mg−1 chl a in the LC-grown cells, with no significant difference between treatments (P = 0.580; Fig. 1).
Figure 1.
The chl a-specific absorption coefficient (a*) as a function of the wavelength of G. oceanica cells grown under HC (1,000 μatm) and LC (390 μatm) conditions.
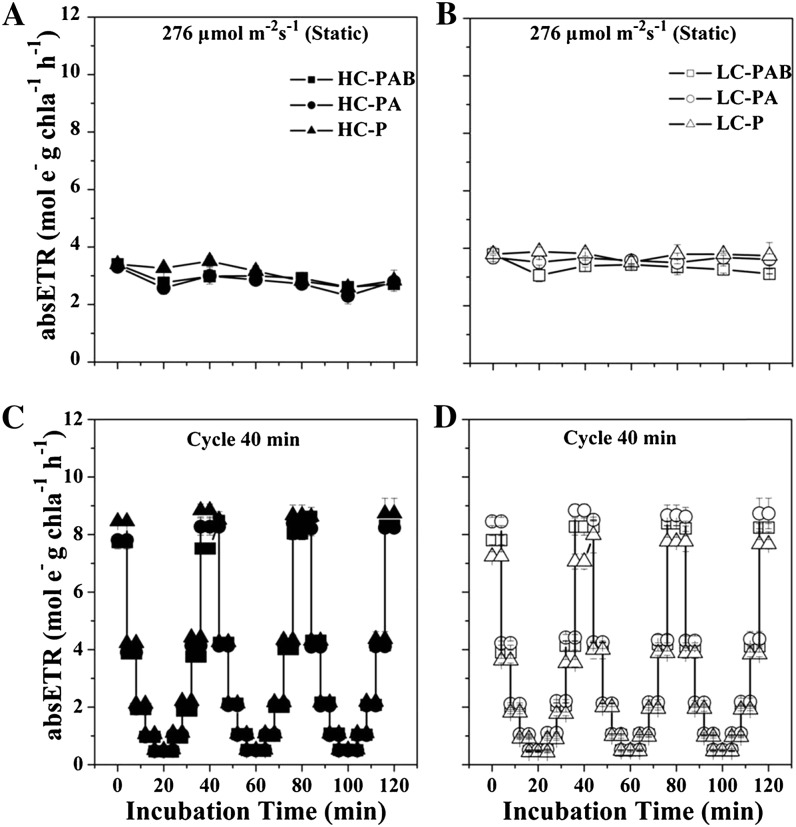
The cumulative absolute electron transport rate (absETR) values of HC- and LC-grown cells at the static light level of 276 μmol photons m−2 s−1 are shown as examples of constant irradiance treatments in Figure 2, A and B. absETR also remained steady over the course of the 120-min exposure period for the other constant irradiance treatment levels (data not shown). Figure 2, C and D, shows the contrasting results under fluctuating irradiances. Compared with the steady values (3–4 mol e− g−1 chl a h−1) of absETR under constant radiation levels, the absETR in the rotating system fluctuated from 0.5 to 9 mol e− g−1 chl a h−1, tracking the changes of light (Fig. 2).
Figure 2.
absETR (mol e− g−1 chl a h−1) in HC- and LC-grown cells as a function of incubation time. A, absETR under HC (A) and LC (B) conditions with constant PAR of 276 μmol photons m−2 s−1. C and D, absETR under fluctuating radiation for the HC (C) and LC (D) cells at 40 min per cycle (Fig. 3). Vertical lines represent sd of triplicate incubations.
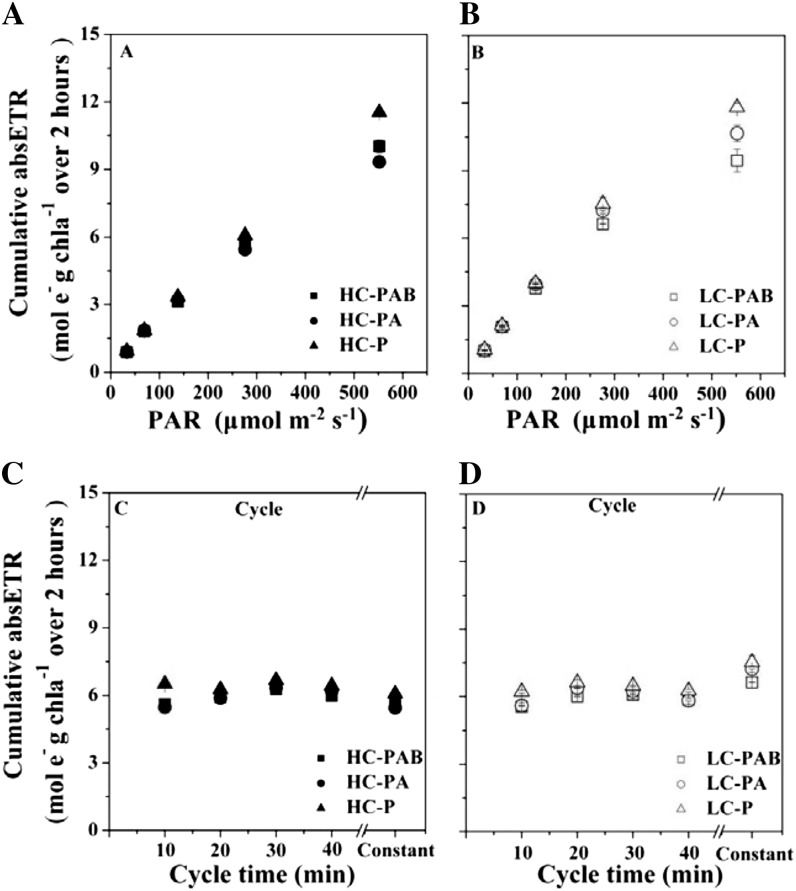
The cumulative absETR of HC- and LC-grown G. oceanica cells over 2-h incubations under the constant (static system) irradiances between 33 and 552 μmol photons m−2 s−1 increased almost linearly with the increase in PAR, regardless of the CO2 level or the presence of UVR (Fig. 4, A and B). The cumulative absETR in the static system was significantly lower, by up to 30%, in the HC-grown cells than in the LC-grown cells across all PAR levels, except for the highest PAR of 552 μmol photons m−2 s−1, at which no significant difference was found between high and low CO2 (Fig. 4, A and B; Table II). The cells exposed to fluctuating irradiance had cumulative absETR of 6.0 to 6.5 mol e− g−1 chl a over the 2-h incubation, a value close to that measured under constant irradiance of 276 μmol photons m−2 s−1 (labeled “Constant” in Fig. 4, C and D) in the static system (Fig. 4). There were no significant differences in the cumulative absETR under fluctuating radiation between HC- and LC-grown cells (three-way ANOVA, post hoc Duncan test, P = 0.136; Fig. 4, C and D). When UVR-induced inhibition was assessed (Table III), the presence of UVB caused 8% inhibition of absETR at 276 μmol photons m−2 s−1 (P = 0.001) and 10% inhibition at 552 μmol photons m−2 s−1 (P = 0.032) in the LC-grown cells. In contrast, UVB led to the stimulation of absETR in the HC-grown cells at 276 μmol photons m−2 s−1 (P = 0.001) and 552 μmol photons m−2 s−1 (P = 0.032), showing an antagonistic effect of UVB and the ocean acidification treatment of high CO2 and low pH (Table III).
Figure 4.
Cumulative absETR (mol e− g−1 chl a over 2 h) for HC- and LC-grown cells under three radiation treatments in static (A and B) and rotating (C and D) systems. The values of static samples under 276 μmol photons m−2 s−1 are shown as “Constant” for comparison. Vertical lines represent sd of triplicate incubations.
Table II. Significance levels of the differences in absETR between and HC- and LC-grown G. oceanica cells when exposed to different constant light levels under P, PA, and PAB treatments.
| Constant PAR Level | Irradiance Treatment | P | Difference |
|---|---|---|---|
| μmol photons m−2 s−1 | |||
| 33 | PAB | <0.001 | 14.0% |
| PA | <0.001 | 14.0% | |
| P | <0.001 | 12.3% | |
| 69 | PAB | <0.001 | 14.0% |
| PA | 0.001 | 12.5% | |
| P | 0.001 | 14.8% | |
| 138 | PAB | <0.001 | 20.5% |
| PA | <0.001 | 23.7% | |
| P | <0.001 | 19.9% | |
| 276 | PAB | <0.001 | 16.9% |
| PA | <0.001 | 32.7% | |
| P | 0.001 | 23.9% | |
| 552 | PAB | 0.160 | 5.8% |
| PA | 0.056 | 14.2% | |
| P | 0.100 | 2.4% |
Table III. UVA- and UVB-induced inhibition of cumulative absETR of HC- and LC-grown cells in static and rotating systems.
UVA- and UVB-induced inhibition was calculated by the equations in “Materials and Methods.” P values of UVA- and UVB-induced inhibition were derived from the comparisons of P with PA treatments and of PA with PAB treatments, respectively.
| Incubation System | CO2 Treatment | PAR Level or Cycle Time | Irradiance Treatment | P | Inhibition |
|---|---|---|---|---|---|
| μmol photons m−2 s−1 or min | |||||
| Fixed system | HC | 33 | UVA | 0.002 | 3.2% |
| UVB | 0.007 | 2.0% | |||
| 69 | UVA | 0.874 | 0.3% | ||
| UVB | 0.077 | 2.8% | |||
| 138 | UVA | 0.002 | 4.1% | ||
| UVB | 0.011 | 2.2% | |||
| 276 | UVA | <0.001 | 10.3% | ||
| UVB | 0.001 | −3.7% | |||
| 552 | UVA | <0.001 | 19.2% | ||
| UVB | 0.032 | −6.0% | |||
| LC | 33 | UVA | 0.130 | 1.7% | |
| UVB | 0.102 | 2.1% | |||
| 69 | UVA | 0.091 | 2.3% | ||
| UVB | 0.258 | 1.5% | |||
| 138 | UVA | 0.127 | 1.0% | ||
| UVB | <0.001 | 4.8% | |||
| 276 | UVA | 0.185 | 3.9% | ||
| UVB | 0.001 | 7.9% | |||
| 552 | UVA | 0.008 | 9.8% | ||
| UVB | 0.027 | 10.3% | |||
| Rotating system | HC | 10 | UVA | <0.001 | 16.0% |
| UVB | 0.248 | −2.0% | |||
| 20 | UVA | 0.026 | 6.2% | ||
| UVB | 0.669 | −6.3% | |||
| 30 | UVA | 0.006 | 5.1% | ||
| UVB | <0.001 | 1.0% | |||
| 40 | UVA | 0.03 | 3.9% | ||
| UVB | 0.169 | 3.3% | |||
| LC | 10 | UVA | <0.001 | 10.1% | |
| UVB | 0.728 | 0.6% | |||
| 20 | UVA | 0.025 | 3.8% | ||
| UVB | <0.001 | 5.5% | |||
| 30 | UVA | 0.002 | 3.8% | ||
| UVB | 0.007 | 2.4% | |||
| 40 | UVA | 0.010 | 7.1% | ||
| UVB | 0.741 | −0.5% |
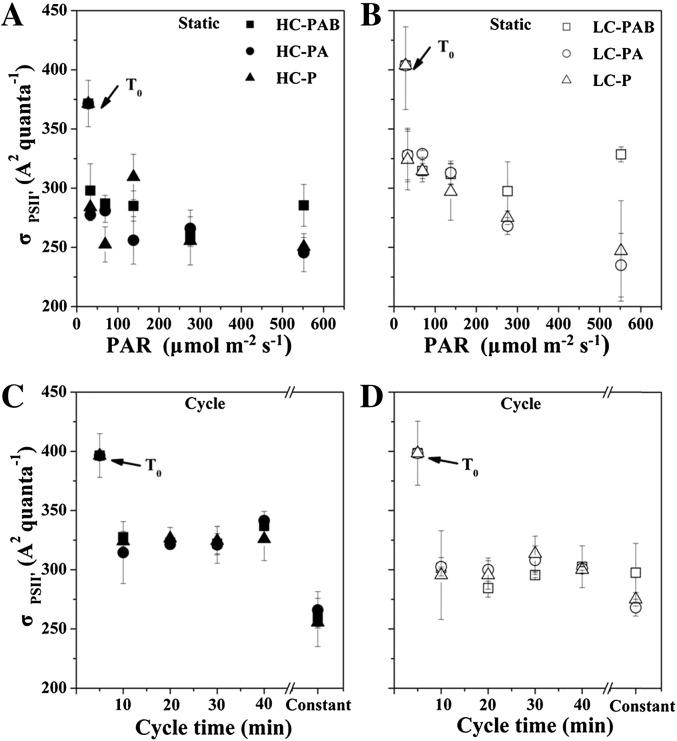
The PSII effective absorption cross section measured under illumination (σPSII′) was initially lower in the HC-grown cells than in the LC-grown cells and further decreased over the 2-h incubation in both the static and fluctuating (mixing) irradiance treatments (Fig. 5). σPSII′ under the PAR + UVA + UVB (PAB) treatment was higher than under photosynthetically active radiation treatment alone (P); at 552 μmol photons m−2 s−1) by 12% for the HC-grown cells (P = 0.011; Fig. 5A) and by 25% for the LC-grown cells (P = 0.010; Fig. 5B). In contrast, the cells exposed to fluctuating radiation did not show significant differences in σPSII′ among the different radiation treatments regardless of the fluctuating radiation frequency (two-way ANOVA, post hoc Duncan test, P = 0.79 [HC] and P = 0.09 [LC]; Fig. 5, C and D). Interestingly, under fluctuating irradiance, the σPSII′ values were higher in the HC-grown cells than in the LC-grown cells (three-way ANOVA, post hoc Duncan test, P < 0.001), opposite to the cells exposed to constant radiation.
Figure 5.
Changes of σPSII′ (A2 quanta−1) for both static (A and B) and rotating (C and D) systems and for HC- and LC-grown cells under three radiation treatments within the simulated UML over a 2-h incubation period. The values of static samples under 276 μmol photons m−2 s−1 are shown as “Constant” for comparison. The values are means and sd (n = 3).
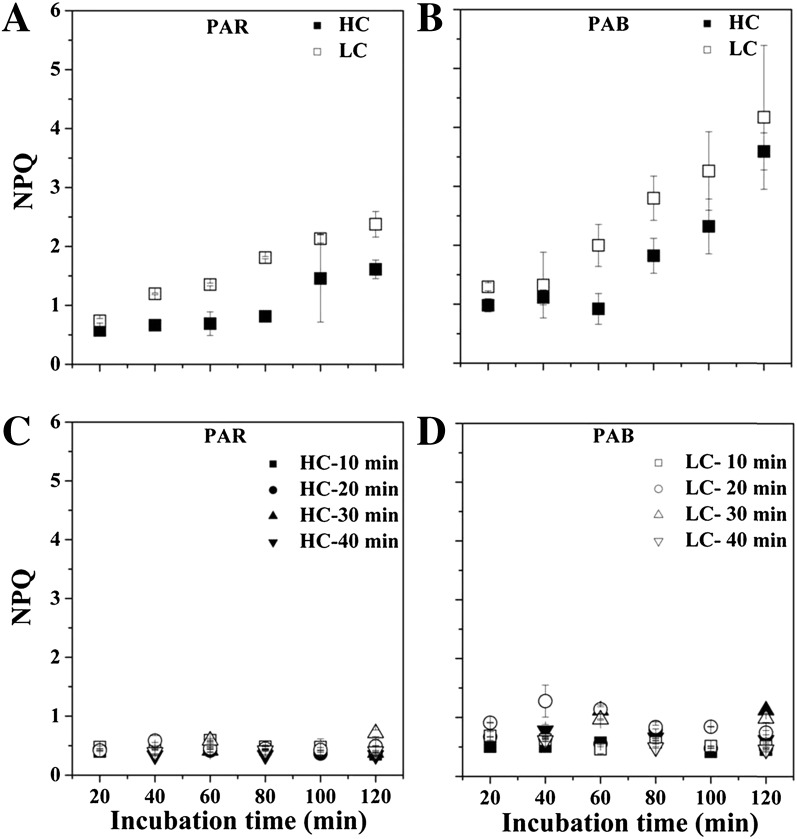
Nonphotochemical quenching (NPQ) increased with time under constant PAR levels, as shown at 552 μmol photons m−2 s−1 (Fig. 6, A and B), with similar increasing trends with time under the other irradiances (data not shown). LC growth (three-way ANOVA, post hoc Duncan test, P < 0.001) and the presence of UVR (three-way ANOVA, post hoc Duncan test, P < 0.001) led to higher NPQ under the static irradiance conditions (Fig. 6, A and B). The presence of UVA increased NPQ by 49% in the HC-grown cells and by 30% in the LC-grown cells. UVB increased NPQ by 24% in the HC-grown cells and by 19% in the LC-grown cells. Under fluctuating radiation, HC treatment led to significantly lower (two-way ANOVA, post hoc Duncan test, P < 0.001) NPQ under PAB treatment (Fig. 6, C and D). Similarly, UVR led to significantly (three-way ANOVA, post hoc Duncan test, P < 0.001) higher NPQ regardless of the CO2 treatments under fluctuating irradiance (Fig. 6, C and D). Nevertheless, the NPQ was lower under the fluctuating than under the constant irradiance even in cells exposed to similar integrated light doses.
Figure 6.
A and B, NPQ of HC- and LC-grown cells under 100% light levels of 552 μmol photons m−2 s−1 with PAR (A) and PAB (B) treatment in the static system. C and D, NPQ under four different rotating speeds of 10, 20, 30, and 40 min under PAR (C) and PAB (D) treatments in the rotating system, with maximum irradiance set to 552 μmol photons m−2 s−1. The values are means and sd (n = 3).
Photosynthetic Carbon Fixation Rates under Static and Fluctuating Irradiance
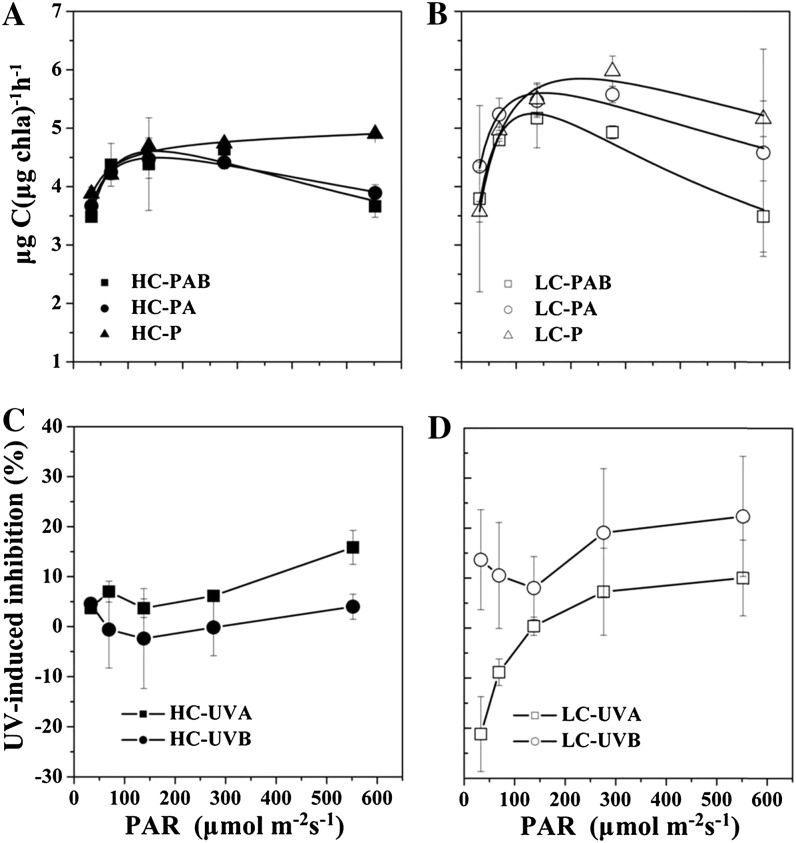
Photosynthetic carbon fixation versus irradiance curves in the static irradiance system under the P, PAR + UVA (PA), and PAB treatments for the HC- and LC-grown cells are shown in Figure 7. The maximum photosynthetic rate (Pmax) of the HC-grown cells did not vary significantly across the three radiation treatments. In the LC-grown cells, however, Pmax was significantly higher in the P treatment as compared with the PA treatment (P = 0.030), with the PAB treatment lower yet (P = 0.043). Pmax in the HC cells was lower by 20.8% (P = 0.01) under P and by 22.1% (P = 0.012) under PA than in the LC cells. Interestingly, under PAB, there was no significant difference in Pmax between the HC and LC cells, because PAB inhibited Pmax in LC cells but not in HC cells.
Figure 7.
A and B, Photosynthetic carbon fixation rates (μg carbon μg−1 chl a h−1) in G. oceanica grown in HC (A) and LC (B) conditions as a function of PAR under different radiation treatments over a 2-h incubation period. C and D, Inhibition of photosynthetic rates induced by UVA or UVB of HC-grown cells (C) and LC-grown cells (D) derived from the data plotted in A and B. Vertical lines represent sd of triplicate incubations.
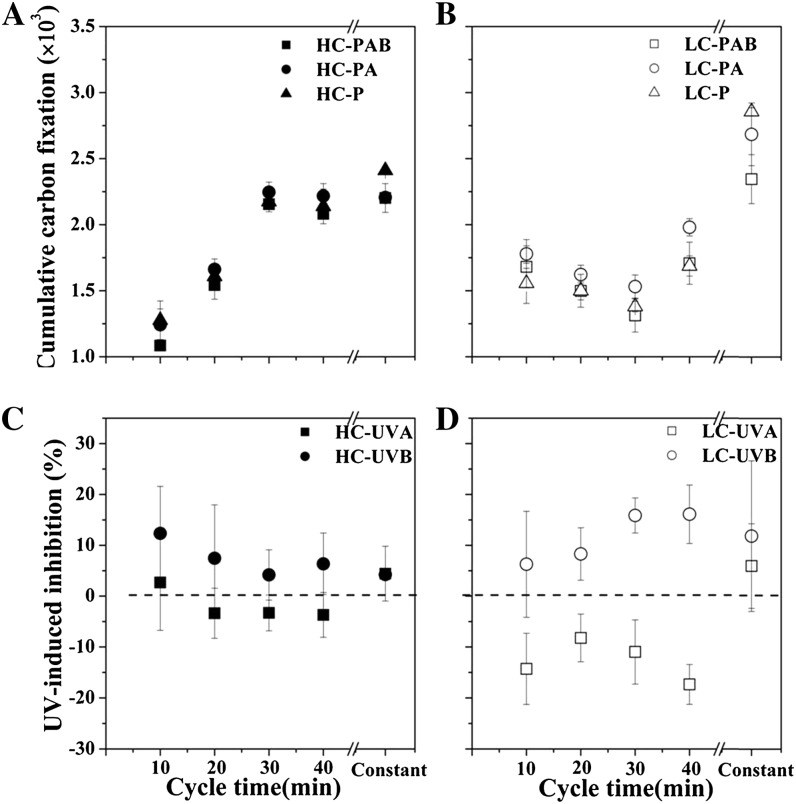
In order to compare the photosynthetic carbon fixation over 2-h incubations under constant and fluctuating radiation, we integrated the values over the different irradiances for each curve in Figure 7 and compared them with those under fluctuating irradiance (Fig. 8). This cumulative carbon fixation had higher values in the static than in the rotating conditions regardless of CO2 growth levels or irradiance treatments (three-way ANOVA, post hoc Duncan test, P < 0.001). In the static system, the cumulative carbon fixation under the P treatment was significantly lower in the HC-grown cells than in the LC-grown cells (P < 0.001). There were no significant differences when comparing the PA or the PAB treatment in HC-grown cells and in LC-grown cells (PAB, P = 0.445; PA, P = 0.105), again because PA and PAB inhibited LC cells more than HC cells. At the shortest cycle time of radiation fluctuation, HC-grown cells showed the lowest cumulative carbon fixation, being about 44% to 51% lower than the static conditions and 18% to 36% lower than the LC-grown cells at the faster circulation (Fig. 8, A and B) but higher by 11% to 45% cumulative carbon fixation at the slower circulations (30 and 40 min). As to the effects of the different UVR wave bands, UVB brought about less inhibition in the HC cells than in the LC cells, and UVA generated less enhancement of the carbon fixation in the HC cells than in the LC cells (Fig. 8, C and D). On average, UVB resulted in about 22% less inhibition and UVA resulted in about 71% stimulation of the carbon fixation under the HC cells compared with that in the LC cells.
Figure 8.
A and B, Cumulative carbon fixation as a function of the cycling rate (minutes per cycle, over the 120-min treatment period) for HC-grown cells (A) and LC-grown cells (B) under three radiation treatments within the simulated UML. The values of static samples are shown as “Constant” for comparison. C and D, UVR inhibition of cumulative carbon fixation in HC-grown cells (C) and LC-grown cells (D) derived from the data plotted in A and B. The values are means and sd (n = 3).
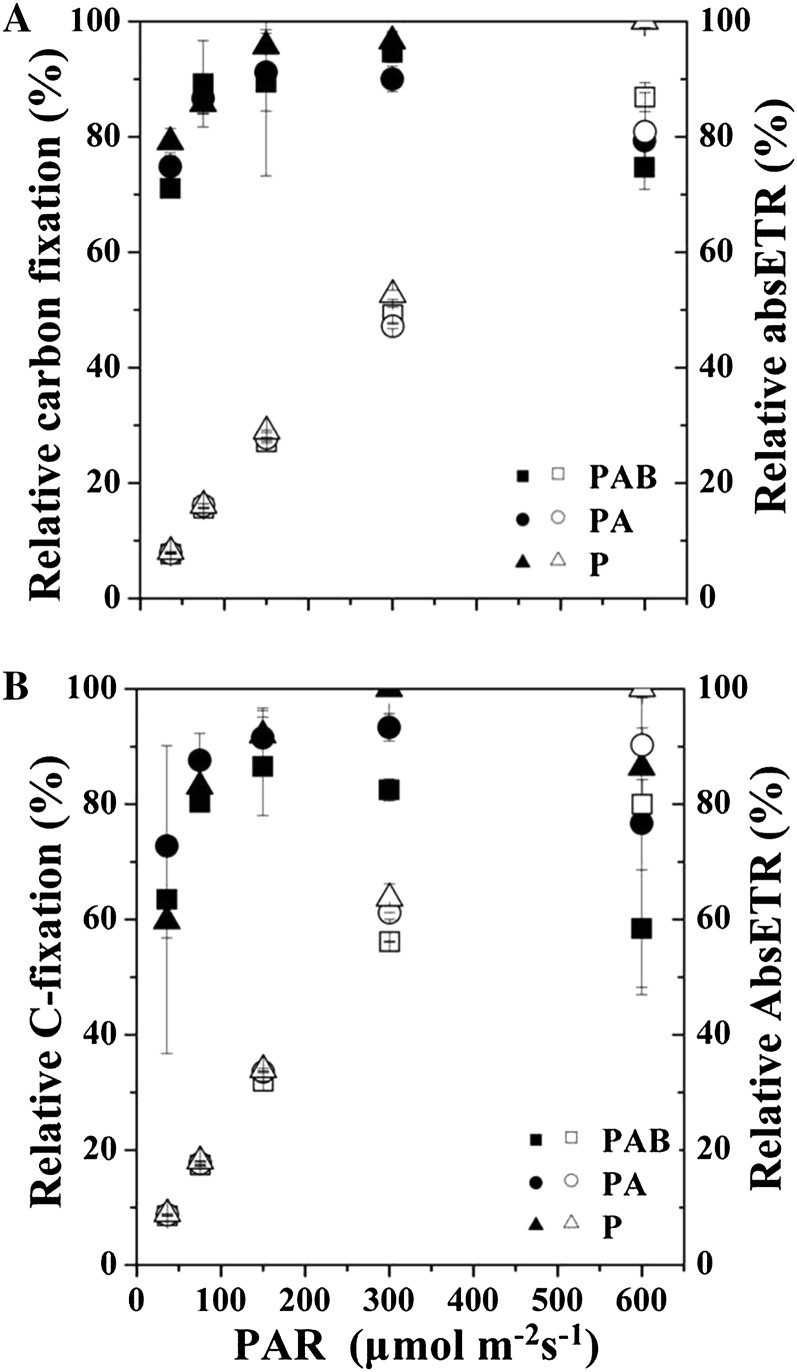
When the light response patterns of absETR (Fig. 4, A and B) were compared with those of photosynthetic carbon fixation rates in the static system (Fig. 7, A and B), carbon fixation rate increased faster than absETR with increasing light levels, although both reached saturation at 276 μmol photons m−2 s−1 or greater (Fig. 9).
Figure 9.
Relative cumulative carbon fixation (left side, black symbols) and absETR (right side, white symbols) in G. oceanica grown at HC (A) and LC (B) levels as a function of PAR under different radiation treatments over a 2-h incubation. Vertical lines represent sd of triplicate incubations.
DISCUSSION
The coccolithophorid G. oceanica grown under ocean acidification conditions showed differential photosynthetic responses to fluctuating irradiance with or without UVR. Ocean acidification led to less UVB-induced inhibition of photosynthetic carbon fixation and lower NPQ (Figs. 6 and 8). The effect of mixing, mimicked by the fluctuating radiation regimes, decreased the effects of ocean acidification on NPQ, so that the differences between the HC- and LC-grown cells became insignificant. UVR-induced inhibition of the absETR also decreased under the mixing condition (Table III). Changes in the fluctuation of the solar radiation regime thus have a greater influence on the short-term photosynthetic performance of the coccolithophorid than the chemical change induced by ocean acidification (high CO2) during growth.
The G. oceanica cells grown under HC concentration become more prone to high irradiance stress, indicating a disruption in their balance between photodamage and repair, compared with cells grown under lower partial pressure of CO2 (pCO2; Fig. 8). Dimier et al. (2009) suggested that the costs for maintenance and repair associated with highly fluctuating radiation would be higher than under less fluctuating radiation conditions. Nevertheless, our results showed little change in the cumulative absETR from PSII, regardless of the fluctuation rate or radiation treatments (Fig. 4, C and D).
There are several mechanisms that could alter the coupling of the PSII function, estimated using variable chlorophyll fluorescence (Fig. 4; Genty et al., 1989; Suggett et al., 2009), with photosynthetic carbon fixation (Figs. 8 and 9). It is only under ideal conditions that there is a strong linear correlation between PSII photochemistry and photosynthetic carbon fixation (Genty et al., 1989), although in situ photochemical yield showed a good correlation with primary productivity (Kolber and Falkowski, 1993; Suggett et al., 2001). Increased carbon loss by photorespiration or respiration was found under high irradiance in HC-acclimated phytoplankton (Gao et al., 2012b; Yang and Gao, 2012). An increase in the water-water cycle (Asada, 1999) could also drain electrons from PSII without contributing to carbon fixation. Calcification increases with increased photosynthetic carbon fixation in coccolithophores (Trimborn et al., 2007) and requires additional energy; therefore, it could also contribute to additional electron drain uncoupled from carbon fixation (Xu and Gao, 2012).
Fluctuating radiation limited or countered the effect of UVB on the absETR and photosynthetic carbon fixation regardless of the growth CO2 levels. Fluctuation of irradiances from low to high and then back to low levels provided the cells the chance to be exposed to low irradiance and the time to acclimate to the changes of light levels. Therefore, repair can reverse photodamage more effectively under fluctuating than under constant radiation levels, since the repair rate generally reaches saturation under low irradiance levels (Edelman and Mattoo, 2008) and can even be inhibited under continuous high irradiance (Takahashi and Murata, 2008). Faster mixing or fluctuation of solar radiation led to less UVR-induced inhibition of photosynthetic carbon fixation of coastal phytoplankton assemblages in the South China Sea (Helbling et al., 2003). In this study, and to our knowledge for the first time, we demonstrated that coccolithophore cells grown under high CO2 exhibited less UVB-induced inhibition compared with cells grown at the LC level, implying antagonistic effects of ocean acidification and UVB under both fluctuating and constant irradiances. Such an antagonistic effect was also found in the diatom Phaeodactylum tricornutum (Li et al., 2012). Different UVR wavelengths differentially affect periplasmic protein synthesis (Wu and Gao, 2009), so that under moderate levels of solar radiation, with PAR of about 170 W m−2, similar to the levels used in this work, UVA and UVB influenced periplasmic proteins to different extents. Under high CO2, such differential effects might diverge further, since the redox poising at the membrane surface differs at different pH levels. UVA under moderate or low levels of solar radiation stimulated photosynthetic carbon fixation (Gao et al., 2007) or oxygen evolution (Gao and Xu, 2008). In this study, UVB led to less inhibition and UVA to less stimulation of carbon fixation under high CO2 (Fig. 8, C and D), showing that the photobiological influences of different UV wave bands will differ under ocean acidification (high CO2/low pH).
The cells of G. oceanica grown under HC conditions calcify less (data not shown), in agreement with Riebesell et al. (2000). Calcification associated with higher NPQ contributes to photoprotection in another coccolithophorid, Emiliania huxleyi (Xu and Gao, 2012). In this study, NPQ was lower in the HC-grown cells than in the LC-grown cells (Fig. 6). Stronger calcification in the LC-grown cells may have drained additional energy and correlated with higher induction of NPQ (Raven and Crawfurd, 2012). NPQ was much lower in the cells exposed to fluctuating irradiance than under constant irradiance (Fig. 6). UVR led to higher NPQ values in the HC- or LC-grown cells, likely through a combination of inhibition of photosystems and UV-stimulated synthesis of xanthophyll pigments that mediate NPQ (Laurion and Roy, 2009; Van de Poll et al., 2010).
Many phytoplankton species modulate the functional antenna size to enable acclimation and growth over a wide range of irradiance, as a photoacclimation strategy, which may differ in different species (Six et al., 2007; Wu et al., 2011). In this study, increased σPSII′ (Fig. 5) correlated well with decreased NPQ (Fig. 6) in the HC-grown cells under constant high irradiance, indicating an increase in operational light harvesting (Gorbunov et al., 2001; Levy et al., 2004). Since optical absorption did not change between the CO2 treatments (Fig. 1), such a functional absorption change reflects a reconfiguration of the antenna under the HC level. Decreased calcification in a coccolithophore has been recently shown to couple with decreased NPQ (Xu and Gao, 2012). Similarly, the HC-grown cells, with less calcification (data not shown) in this study, thus increased their effective σPSII′ without a parallel increase in pigment content (Fig. 5).
Our study demonstrated that progressive ocean acidification, when combined with fast mixing, will decrease photosynthetic carbon fixation rate, NPQ, and UVR-induced inhibition in coccolithophorids. However, increased stratification with ocean warming may expose the calcifying algae to increased integrated exposure to solar radiation. Ocean acidification may mitigate UVR inhibition of photosynthesis, but UVR also decreases the calcification of most coccolithophores, lowering the UVR screening function of the coccolith layer (Gao et al., 2009). Therefore, calcifying phytoplankton responses to ocean acidification and UVR will depend upon the interactions of multiple stressors (Beardall et al., 2009; Boyd et al., 2010; Gao et al., 2012a), with mixing rate and the resulting fluctuation of irradiances primarily influenced by wind speed.
MATERIALS AND METHODS
Culture Conditions
Gephyrocapsa oceanica (NIES-1318), obtained from the National Institute for Environmental Studies in Japan, was grown in natural seawater obtained from the South China Sea and enriched with Aquil medium (110 μm nitrogen, 10 μm phosphorus, with trace metals and vitamins at a salinity of 35; Morel et al., 1979). When the cells reached the exponential growth phase, they were used to initiate cultures under HC (pCO2 = 1,000 μatm) or LC (pCO2 = 390 μatm) conditions. These cultures (HC and LC) were maintained in exponential growth phase for 10 to 20 generations before being used in the experiments. To maintain a stable carbonate system in the semicontinuous cultures, the cell density was maintained within a range of 1.5 to 3.5 × 10⁴ cells mL−1. The cultures either under HC or LC were diluted every 24 h with freshly prepared medium equilibrated with the target CO2 level (Gattuso et al., 2010), so that the cell concentration after dilution was maintained at 1.5 × 10⁴ cells mL−1. As the specific growth rates differed under different conditions, the renewed amount of the medium differed. The high- and low-pCO2 cultures were maintained in tightly closed polycarbonate bottles that were completely filled with culture medium, without any gas head space, to prevent CO2 gas exchange. Since the cell suspension density was low and the medium was diluted every day, the phytoplankton biomass drew down less than 5% of the total dissolved inorganic carbon in the culture medium (Zondervan et al., 2002) between medium renewal cycles. The carbonate system was thus maintained with daily variation in the National Bureau of Standards pH (pHNBS) less than 0.06 across medium renewal cycles, within the acceptable range for manipulating carbonate chemistry in ocean acidification studies (Gattuso et al., 2010). The cultures were maintained under a photon flux density of 100 μmol photons m−2 s−1 (12/12-h light/dark cycle) in a plant growth chamber (GXZ; Ruihua) at a constant temperature of 20°C.
Estimation of Changes of the Carbonate System in the Cultures
The pH in the cultures was measured daily with a pH meter (Benchtop pH510; OAKTON) that was calibrated with National Bureau of Standards buffer solution (Hanna). Other related parameters of the carbonate chemistry were estimated according to known values of pH, salinity, nutrients, and pCO2 using the software CO2SYS (Lewis and Wallace, 1998). The equilibrium constants (K1 and K2) of carbonic acid dissociation (Roy et al., 1993) were used for all calculations.
Experimental Setup
Due to the space constraints under the solar simulator (see below), experiments to determine photosynthetic performance under different radiation/fluctuating regimes were carried out separately for the HC- and LC-grown cells, but using cells after similar acclimation periods of 10 to 20 generations under both CO2 conditions. Samples from either HC or LC treatment (final cell density of 2.5 × 10⁴ cells mL−1) were dispensed in 35-mL quartz tubes for measurements of carbon fixation and fluorescence parameters (see below).
Three radiation treatments were implemented: PAB, tubes covered with a 295-nm cutoff filter (Ultraphan; Digefra) so that cells were exposed to PAR + UVA + UVB, receiving irradiances above 295 nm, a short-wavelength cutoff that excludes the lowest 15 nm of the UVB range; PA, tubes covered with Folex 320 filters, so that cells were exposed to PAR + UVA, receiving irradiances above 320 nm; and P, tubes covered with 395-nm cutoff foil (UV Opak; Digefra), so that the cells received PAR alone. Triplicate samples were used for each irradiance condition for carbon incorporation and fluorescence parameters, and the incubations lasted for 2 h.
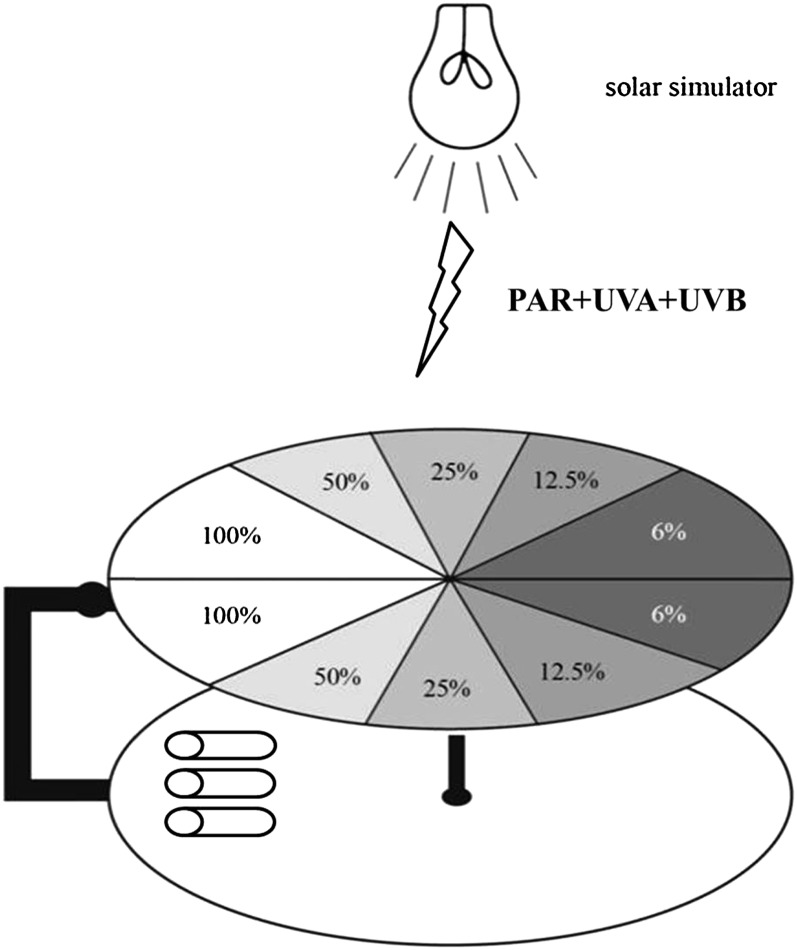
The tubes (both for carbon and fluorescence measurements) were put in one of the following two systems: (1) cells exposed to a fixed irradiance during the whole incubation period; and (2) a rotating system, with the cells exposed to fluctuating irradiance (Fig. 3). The rotating device was similar to that described by Helbling et al. (2003), in which changes of solar irradiance due to mixing within the UML were mimicked. The samples were attached to a horizontal wheel, beneath a second wheel with increasing layers of neutral density screen arranged in sectors (i.e. pie-like pieces) that rotated by means of a stepper motor, thus varying the irradiance to which the cells were exposed. The layer containing the screens had 10 circular sectors of 36° going clockwise from no screens (simulating 100% radiation) to four screens (simulating 6% radiation) and then stepwise back to no screens, thus performing one complete cycle with 10 discrete steps of irradiance; 100%, 50%, 25%, 12.5%, 6%, 6%, 12.5%, 25%, 50%, and back to 100% (Fig. 3).
Figure 3.
Schematic of the cycling device used to impose fluctuations in simulated solar irradiance, ranging from 100% to 50%, 25%, 12.5%, and 6%, then from 6% back to 12.5%, 25%, 50%, and 100% during one cycle. The irradiances at 100% levels were PAR 120 (552 μmol photons m−2 s−1), UVA 32.3 W m−2, and UVB 1.525 W m−2. The rate of irradiance fluctuation was controlled by the cycling rate.
We used four different cycling speeds to impose different rates of irradiance fluctuation, with one cycle simulating cells going from the surface (100%) to the bottom of the stimulated UML (6%) and back to the surface (100%) from 10 to 40 min, by applying 12 to three cycles over the 2-h incubation period. We chose the irradiance level at the bottom of the UML as 6% based on previous measurements carried out in a time series station, the South East Asia Time Series Study (19°N, 118.5°E), of the South China Sea (Chen et al., 2006). Both systems were placed at 95 cm from the solar simulator (Sol 1200W; Dr. Hönle) under irradiances of 120 W m−2 (552 μmol photons m−2 s−1) PAR, 32.3 W m−2 UVA, and 1.525 W m−2 UVB at the 100% irradiance level. The mean PAR levels under the four different cycling speeds were the same, at 213 μmol photons m−2 s−1. The whole setup containing the tubes was then placed in a water bath at 20°C ± 0.1°C controlled with a circulating cooler (CTP-3000; Eyela).
Incubations under different fluctuation regimes were done on different days but under a solar simulator and with cells acclimated to HC and LC conditions for 10 to 20 generations; in this way, we ensured that the irradiance received by the cells was consistent day after day and, thus, that our data were comparable. The reader should be aware that our system using neutral density screens does not completely mimic the differential spectral attenuation of solar radiation in the water column; thus, under the neutral density screens, the UVB-UVA-PAR ratios are a bit higher than the ones at the corresponding water column depths for equivalent PAR levels.
Measurements and Analyses
Radiation Measurements
A broadband ELDONET filter radiometer (Real Time Computer) that has channels for PAR, UVA, and UVB and is calibrated yearly was used to measure the irradiances under the solar simulator.
Determination of Photosynthetic Rates
Samples for the determination of photosynthetic rates were analyzed following the technique described by Holm-Hansen and Helbling (1995). The samples were inoculated with 50 µL to 2.5 µCi (0.0925 MBq) of NaH14CO3 (ICN Radiochemicals). After the incubation, samples were immediately filtered onto Whatman GF/F glass fiber filters (25 mm) under dim light, put into 20-mL scintillation vials, exposed to HCl fumes overnight, and dried (45°C) to remove the nonincorporated inorganic carbon. Then, 3 mL of scintillation cocktail (Hisafe 3; Perkin-Elmer) was added to each vial, and the assimilated radiocarbon was counted using a liquid scintillation counter (Tri-Carb 2800TR; Perkin-Elmer).
Determination of Cell Numbers and chl a Content
During the preacclimation period, cells were grown semicontinuously by removing and adding fresh medium every day at the end of the light period. Cell numbers were measured every 24 h before and after the renewal of medium using a particle counter (Z2; Beckman Instruments). The chl a content was determined by filtering 200 mL of the cultures onto Whatman GF/F filters (25 mm), extracting overnight in absolute methanol, centrifuging (10 min at 6,000g), measuring the absorbance of the supernatant over a scan between 200 and 800 nm, and calculating the concentration of the photosynthetic pigment following the equation of Porra (2002).
Determination of the Absorption Spectrum
The cells were filtered on GF/F glass fiber filters (1.3 × 10⁷ cells cm−2) and scanned from 400 to 700 nm with a dual-beam PE Lambda 950 spectrophotometer (Perkin-Elmer) equipped with an integrating sphere (150-mm diameter). The chl a-specific absorption coefficient (a*) was calculated according to Cleveland and Weidemann (1993) and Anning et al. (2000), and the mean chl a-specific absorption coefficient (ā*) was weighted against the irradiances of the solar simulator following the method described by Dubinsky et al. (1984):
 |
where E(λ) is the spectral output of the light source and d(λ) is the first derivative of absorbed irradiance with respect to λ.
Evaluation of Photochemical Performance
The chl a fluorescence parameters effective photochemical quantum yield (ΦPSII) and σPSII′ were determined in the light-exposed cells using a Fluorescence Induction and Relaxation device (Satlantic) to apply a single saturating turnover flash (80 μs, 5 × 10⁴ μmol photons m−2 s−1). ΦPSII and σPSII′ were measured from samples taken at the beginning of the incubations and then every 20 min in each radiation condition in the fixed system, also in the rotating system.
The absETR (expressed in mol e− g−1 chl a h−1) was estimated as:
where ΦPSII represents the effective quantum yield of PSII at the PAR (in μmol photons m−2 s−1) to which the cells were exposed. The mean chl a-specific absorption coefficient (ā*) of phytoplankton was divided by 2, assuming that half of the absorbed light is distributed to PSII (Dimier et al., 2009). In order to compare the absETR with photosynthetic carbon fixation, the absETR estimates derived from the photosynthetic yield and the corresponding radiation levels were integrated over the 2-h exposure for the fluctuating and constant irradiance treatments.
NPQ was calculated as:
where Fm represents the maximum fluorescence yield after the samples were “dark” adapted under dim light (10 μmol photons m−2 s−1) for 10 min and Fm′ is the instant maximal fluorescence under the light.
Data Analysis
Three-way, two-way, and one-way ANOVA were used to establish differences and interactions among the treatments (P = 0.05). When necessary, the post hoc Duncan test was used to determine the differences between individual means. Photosynthesis versus irradiance curves obtained from the fixed system were fitted as y = x/(ax2 + bx + c) (Eilers and Peeters, 1988), where y is the photosynthetic rate, x is the PAR irradiance (μmol photons m−2 s−1), and a, b, and c are the adjustment parameters. Relative inhibition of photosynthetic carbon fixation, or the ΦPSII caused by UVR, was assessed as follows:
where YP, YPA, and YPAB indicate ΦPSII or photosynthetic carbon fixation rates under the P, PA, and PAB treatments, respectively.
Glossary
- UVR
ultraviolet radiation
- UVA
ultraviolet A
- UVB
ultraviolet B
- PAR
photosynthetically active radiation
- UML
upper mixing layer
- HC
high-CO2
- LC
low-CO2
- chl a
chlorophyll a
- absETR
absolute electron transport rate
- σPSII′
PSII effective absorption cross section measured under illumination
- NPQ
nonphotochemical quenching
- ΦPSII
effective photochemical quantum yield
References
- Anning T, Maclntyre HL, Pratt SM, Sammes PJ, Gibbs S, Geider RJ. (2000) Photoacclimation in the marine diatom Skeletonema costatum. Limnol Oceanogr 45: 1807–1817 [Google Scholar]
- Asada K. (1999) The water-water cycle in chloroplasts: scavenging of active oxygens and dissipation of excess photons. Annu Rev Plant Physiol Plant Mol Biol 50: 601–639 [DOI] [PubMed] [Google Scholar]
- Beardall J, Sobrino C, Stojkovic S. (2009) Interactions between the impacts of ultraviolet radiation, elevated CO2, and nutrient limitation on marine primary producers. Photochem Photobiol Sci 8: 1257–1265 [DOI] [PubMed] [Google Scholar]
- Beaufort L, Probert I, de Garidel-Thoron T, Bendif EM, Ruiz-Pino D, Metzl N, Goyet C, Buchet N, Coupel P, Grelaud M, et al. (2011) Sensitivity of coccolithophores to carbonate chemistry and ocean acidification. Nature 476: 80–83 [DOI] [PubMed] [Google Scholar]
- Boyd P, Strzepek R, Fu F, Hutchins DA. (2010) Environmental control of open-ocean phytoplankton groups: now and in the future. Limnol Oceanogr 55: 1353–1376 [Google Scholar]
- Chen CC, Shiah FK, Chung SW, Liu KK. (2006) Winter phytoplankton blooms in the shallow mixed layer of the South China Sea enhanced by upwelling. J Mar Syst 59: 97–110 [Google Scholar]
- Cleveland J, Weidemann AD. (1993) Quantifying absorption by aquatic particles: a multiple scattering correction for glass-fiber filters. Limnol Oceanogr 38: 1321–1327 [Google Scholar]
- Delille B, Harlay J, Zondervan I, Jacquet S, Chou L, Wollast R, Richard GJ, Bellerby RGJ, Frankignoulle M, Borges AV, et al. (2005) Response of primary production and calcification to changes of pCO2 during experimental blooms of the coccolithophorid Emiliania huxleyi. Global Biogeochem Cycles 19: GB2023 [Google Scholar]
- Denman KL, Gargett AE. (1983) Time and space scales of vertical mixing and advection of phytoplankton in the upper ocean. Limnol Oceanogr 28: 801–815 [Google Scholar]
- Dimier C, Brunet C, Geider R, Raven J. (2009) Growth and photoregulation dynamics of the picoeukaryote Pelagomonas calceolata in fluctuating light. Limnol Oceanogr 54: 823–836 [Google Scholar]
- Doney SC, Fabry VJ, Feely RA, Kleypas JA. (2009) Ocean acidification: the other CO2 problem. Annu Rev Mar Sci 1: 169–192 [DOI] [PubMed] [Google Scholar]
- Dubinsky Z, Berman T, Schanz F. (1984) Field experiments for in situ measurements of photosynthetic efficiency at quantum yield. J Plankton Res 6: 339–349 [Google Scholar]
- Edelman M, Mattoo AK. (2008) D1-protein dynamics in photosystem II: the lingering enigma. Photosynth Res 98: 609–620 [DOI] [PubMed] [Google Scholar]
- Eilers P, Peeters J. (1988) A model for the relationship between light intensity and the rate of photosynthesis in phytoplankton. Ecol Modell 42: 199–215 [Google Scholar]
- Gao K, Helbling EW, Häder D-P, Hutchins DA. (2012a) Responses of marine primary producers to interactions between ocean acidification, solar radiation, and warming. Mar Ecol Prog Ser 470: 167–189 [Google Scholar]
- Gao K, Ruan Z, Villafañe VE, Gattuso J-P, Helbling EW. (2009) Ocean acidification exacerbates the effect of UV radiation on the calcifying phytoplankter Emiliania huxleyi. Limnol Oceanogr 54: 1855–1862 [Google Scholar]
- Gao K, Wu Y, Li G, Wu H, Villafañe VE, Helbling EW. (2007) Solar UV radiation drives CO2 fixation in marine phytoplankton: a double-edged sword. Plant Physiol 144: 54–59 [DOI] [PMC free article] [PubMed] [Google Scholar]
- Gao K, Xu J. (2008) Effects of solar UV radiation on diurnal photosynthetic performance and growth of Gracilaria lemaneiformis (Rhodophyta). Eur J Phycol 43: 297–307 [Google Scholar]
- Gao K, Xu J, Gao G, Li Y, Hutchins DA, Huang B, Wang L, Zheng Y, Jin P, Cai X, et al. (2012b) Rising CO2 and increased light exposure synergistically reduce marine primary productivity. Nat Climate Change 2: 519–523 [Google Scholar]
- Gao K, Zheng Y. (2010) Combined effects of ocean acidification and solar UV radiation on photosynthesis, growth, pigmentation and calcification of the coralline alga Corallina sessilis (Rhodophyta). Glob Change Biol 16: 2388–2398 [Google Scholar]
- Gattuso J-P, Gao K, Lee K, Rost B, Schluz K. (2010) Approaches and tools to manipulate the carbonate chemistry. In U Riebesell, V Fabry, L Hansson, J-P Gattuso, eds, Guide to Best Practices for Ocean Acidification Research and Data Reporting. European Commission, Brussels, pp 41–52 [Google Scholar]
- Genty B, Briantais JM, Baker NR. (1989) The relationship between the quantum yield of photosynthetic electron transport and quenching of chlorophyll fluorescence. Biochim Biophys Acta 990: 87–92 [Google Scholar]
- Gorbunov MY, Kolber ZS, Lesser MP, Falkowski PG. (2001) Photosynthesis and photoprotection in symbiotic corals. Limnol Oceanogr 46: 75–85 [Google Scholar]
- Guan W, Gao K. (2008) Light histories influence the impacts of solar ultraviolet radiation on photosynthesis and growth in a marine diatom, Skeletonema costatum. J Photochem Photobiol B 91: 151–156 [DOI] [PubMed] [Google Scholar]
- Guan W, Gao K. (2010) Enhanced calcification ameliorates the negative effects of UV radiation on photosynthesis in the calcifying phytoplankter Emiliania huxleyi. Chin Sci Bull 55: 588–593 [Google Scholar]
- Hargreaves BR (2003) Water column optics and penetration of UVR. In EW Helbling, H Zagarese, eds, UV Effects in Aquatic Organisms and Ecosystems. Royal Society of Chemistry, Cambridge, UK, pp 59–105 [Google Scholar]
- Helbling EW, Gao K, Goncalves RJ, Wu H, Villafañe VE. (2003) Utilization of solar UV radiation by coastal phytoplankton assemblages off SE China when exposed to fast mixing. Mar Ecol Prog Ser 259: 59–66 [Google Scholar]
- Holm-Hansen O, Helbling EW (1995) Técnicas para la medición de la productividad primaria en el fitoplancton. In K Alveal, ME Ferrario, EC Oliveira, E Sar, eds, Manual de Métodos Ficológicos. Universidad de Concepción, Concepción, Chile, pp 329–350 [Google Scholar]
- Houghton JT (2001) Climate Change 2001: The Scientific Basis. Cambridge University Press, Cambridge, UK [Google Scholar]
- Iglesias-Rodriguez MD, Halloran PR, Rickaby REM, Hall IR, Colmenero-Hidalgo E, Gittins JR, Green DRH, Tyrrell T, Gibbs SJ, von Dassow P, et al. (2008) Phytoplankton calcification in a high-CO2 world. Science 320: 336–340 [DOI] [PubMed] [Google Scholar]
- Josefsson W. (2006) UV-radiation 1983–2003 measured at Norrk ping, Sweden. Theor Appl Climatol 83: 59–76 [Google Scholar]
- Kolber Z, Falkowski PG. (1993) Use of active fluorescence to estimate phytoplankton photosynthesis in situ. Limnol Oceanogr 38: 1646–1665 [Google Scholar]
- Langer G, Geisen M, Baumann KH, Kläs J, Riebesell U, Thoms S, Young JR. (2006) Species-specific responses of calcifying algae to changing seawater carbonate chemistry. Geochem Geophys Geosyst 7: Q09006 [Google Scholar]
- Langer G, Nehrke G, Probert I, Ly J, Ziveri P. (2009) Strain-specific responses of Emiliania huxleyi to changing seawater carbonate chemistry. Biogeosciences 6: 2637–2646 [Google Scholar]
- Laurion I, Roy S. (2009) Growth and photoprotection in three dinoflagellates (including two strains of Alexandrium tamarense) and one diatom exposed to four weeks of natural and enhanced ultraviolet-B radiation. J Phycol 45: 16–33 [DOI] [PubMed] [Google Scholar]
- Levy O, Dubinsky Z, Schneider K, Achituv Y, Zakai D, Gorbunov MY. (2004) Diurnal hysteresis in coral photosynthesis. Mar Ecol Prog Ser 268: 105–117 [Google Scholar]
- Lewis E, Wallace DWR (1998) Program Developed for CO2 System Calculations, ORNL/CDIAC-105. Carbon Dioxide Information Analysis Center, Oak Ridge National Laboratory, Oak Ridge, TN, US Department of Energy [Google Scholar]
- Li Y, Gao K, Helbling EW, Villafañe VE. (2012) Ocean acidification mediates photosynthetic responses to UV radiation and temperature increase in the diatom Phaeodactylum tricornutum. Biogeosciences 9: 3931–3942 [Google Scholar]
- MacIntyre S. (1993) Vertical mixing in a shallow, eutrophic lake: possible consequences for the light climate of phytoplankton. Limnol Oceanogr 38: 798–817 [Google Scholar]
- Manney GL, Santee ML, Rex M, Livesey NJ, Pitts MC, Veefkind P, Nash ER, Wohltmann I, Lehmann R, Froidevaux L, et al. (2011) Unprecedented Arctic ozone loss in 2011. Nature 478: 469–475 [DOI] [PubMed] [Google Scholar]
- Morel FMM, Rueter JG, Anderson DM, Guillard RRL. (1979) Aquil: a chemically defined phytoplankton culture medium for trace metal studies. J Phycol 15: 135–141 [Google Scholar]
- Okabe K. (1997) Change in fishing methods and conditions caused by bloom of Gephyrocapsa oceanica. Bull Kanagawa Prefect Fish Res Inst 2: 49–54 [Google Scholar]
- Porra RJ. (2002) The chequered history of the development and use of simultaneous equations for the accurate determination of chlorophylls a and b. Photosynth Res 73: 149–156 [DOI] [PubMed] [Google Scholar]
- Raven JA, Crawfurd K. (2012) Environmental controls on coccolithophore calcification. Mar Ecol Prog Ser 470: 137–166 [Google Scholar]
- Riebesell U, Tortell PD (2011) Effects of ocean acidification on pelagic organisms and ecosystems. In J-P Gattuso, L Hansson, eds, Ocean Acidification. Oxford University Press, Oxford, pp 99–116 [Google Scholar]
- Riebesell U, Zondervan I, Rost B, Tortell PD, Zeebe RE, Morel FMM. (2000) Reduced calcification of marine plankton in response to increased atmospheric CO2. Nature 407: 364–367 [DOI] [PubMed] [Google Scholar]
- Roy RN, Roy LN, Vogel KM, Porter-Moore C, Pearson T, Good CE, Millero FJ, Campbell DM. (1993) The dissociation constants of carbonic acid in seawater at salinities 5 to 45 and temperature 0 to 45°C. Mar Chem 44: 249–267 [Google Scholar]
- Sabine CL, Feely RA, Gruber N, Key RM, Lee K, Bullister JL, Wanninkhof R, Wong CS, Wallace DW, Tilbrook B, et al. (2004) The oceanic sink for anthropogenic CO2. Science 305: 367–371 [DOI] [PubMed] [Google Scholar]
- Sarmiento JL, Slater R, Barber R, Bopp L, Doney SC, Hirst AC, Kleypas J, Matear R, Mikolajewicz U, Monfray P, et al. (2004) Response of ocean ecosystems to climate warming. Global Biogeochem Cycles 18: GB3003 [Google Scholar]
- Shi D, Xu Y, Morel FMM. (2009) Effects of the pH/pCO2 control method on medium chemistry and phytoplankton growth. Biogeosciences 6: 1199–1207 [Google Scholar]
- Sinutok S, Hill R, Doblin MA, Wuhrer R, Ralph PJ. (2011) Warmer more acidic conditions cause decreased productivity and calcification in subtropical coral reef sedimentdwelling calcifiers. Limnol Oceanogr 56: 1200–1212 [Google Scholar]
- Six C, Finkel ZV, Irwin AJ, Campbell DA. (2007) Light variability illuminates niche-partitioning among marine picocyanobacteria. PLoS ONE 2: e1341. [DOI] [PMC free article] [PubMed] [Google Scholar]
- Smith RC, Prézelin BB, Baker KS, Bidigare RR, Boucher NP, Coley T, Karentz D, MacIntyre S, Matlick HA, Menzies D, et al. (1992) Ozone depletion: ultraviolet radiation and phytoplankton biology in Antarctic waters. Science 255: 952–959 [DOI] [PubMed] [Google Scholar]
- Suggett DJ, Kraay G, Holligan P, Davey M, Aike J, Geider RJ. (2001) Assessment of photosynthesis in a spring cyanobacterial bloom by use of a fast repetition rate fluorometer. Limnol Oceanogr 46: 802–810 [Google Scholar]
- Suggett DJ, MacIntyre HL, Kana TM, Geider RJ. (2009) Comparing electron transport with gas exchange: parameterising exchange rates between alternative photosynthetic currencies for eukaryotic phytoplankton. Aquat Microb Ecol 56: 147–162 [Google Scholar]
- Takahashi S, Murata N. (2008) How do environmental stresses accelerate photoinhibition? Trends Plant Sci 13: 178–182 [DOI] [PubMed] [Google Scholar]
- Tedetti M, Sempéré R. (2006) Penetration of ultraviolet radiation in the marine environment: a review. Photochem Photobiol 82: 389–397 [DOI] [PubMed] [Google Scholar]
- Toggweiler JR, Russell J. (2008) Ocean circulation in a warming climate. Nature 451: 286–288 [DOI] [PubMed] [Google Scholar]
- Trimborn S, Longer G, Rost B. (2007) Effect of varying calcium concentrations and light intensities on calcification and photosynthesis in Emiliania huxleyi. Limnol Oceanogr 52: 2285–2293 [Google Scholar]
- Turley C, Eby M, Ridgwell AJ, Schmidt DN, Findlay HS, Brownlee C, Riebesell U, Fabry VJ, Feely RA, Gattuso J-P. (2010) The societal challenge of ocean acidification. Mar Pollut Bull 60: 787–792 [DOI] [PubMed] [Google Scholar]
- Van de Poll WH, Buma AGJ, Visser RJW, Janknegt PJ, Villafañe VE, Helbling EW. (2010) Xanthophyll cycle activity and photosynthesis of Dunaliella tertiolecta (Chlorophyceae) and Thalassiosira weissflogii (Bacillariophyceae) during fluctuating solar radiation. Phycologia 49: 249–259 [Google Scholar]
- Van de Poll WH, Visser RJW, Buma AG. (2007) Acclimation to a dynamic irradiance regime changes excessive irradiance sensitivity of Emiliania huxleyi and Thalassiosira weissflogii. Limnol Oceanogr 52: 1430–1438 [Google Scholar]
- Villafañe VE, Gao K, Li P, Li G, Helbling EW. (2007) Vertical mixing within the epilimnion modulates UVR-induced photoinhibition in tropical freshwater phytoplankton from southern China. Freshw Biol 52: 1260–1270 [Google Scholar]
- Wu H, Cockshutt AM, McCarthy A, Campbell DA. (2011) Distinctive photosystem II photoinactivation and protein dynamics in marine diatoms. Plant Physiol 156: 2184–2195 [DOI] [PMC free article] [PubMed] [Google Scholar]
- Wu H, Gao K. (2009) Ultraviolet radiation stimulated activity of extracellular carbonic anhydrase in the marine diatom Skeletonema costatum. Funct Plant Biol 36: 137–143 [DOI] [PubMed] [Google Scholar]
- Xu K, Gao K. (2012) Reduced calcification decreases photoprotective capability in the coccolithophorid Emiliania huxleyi. Plant Cell Physiol 53: 1267–1274 [DOI] [PubMed] [Google Scholar]
- Yang G, Gao K. (2012) Physiological responses of the marine diatom Thalassiosira pseudonana to increased pCO2 and seawater acidity. Mar Environ Res 79: 142–151 [DOI] [PubMed] [Google Scholar]
- Zondervan I, Rost B, Riebesell U. (2002) Effect of CO2 concentration on the PIC/POC ratio in the coccolithophore Emiliania huxleyi grown under light-limiting conditions and different daylengths. J Exp Mar Biol Ecol 272: 55–70 [Google Scholar]


