

SUMMARY
The striatum integrates information from multiple brain regions to shape motor learning. The two major projection cell types in striatum target different downstream basal ganglia targets and have opposing effects on motivated behavior, yet differential innervation of these neuronal subtypes is not well understood. To examine whether input specificity provides a substrate for information segregation in these circuits, we used a monosynaptic rabies virus system to generate brain-wide maps of neurons that form synapses with direct- or indirect-pathway striatal projection neurons. We discovered that sensory cortical and limbic structures preferentially innervated the direct pathway, whereas motor cortex preferentially targeted the indirect pathway. Thalamostriatal input, dopaminergic input, as well as input from specific cortical layers, was similar onto both pathways. We also confirm synaptic innervation of striatal projection neurons by the raphe and pedunculopontine nuclei. Together, these findings provide a framework for guiding future studies of basal ganglia circuit function.
INTRODUCTION
Output from the dorsal striatum is organized into two primary projection pathways that have opposing effects on movement (Albin et al., 1989; DeLong, 1990; Graybiel, 1995; Hikosaka et al., 2000; Kravitz et al., 2010; Mink, 1996). The coordinated activity of these two output streams is thought to be critical for learning and performing proper action sequences. Although the two projection cell classes in dorsal striatum, known as medium spiny neurons (MSNs), are intermingled, they can be distinguished by their gene expression and by their downstream projection targets (Beckstead, 1987; Chang et al., 1981; Gerfen et al., 1990; Kawaguchi et al., 1990; Le Moine et al., 1990; Penny et al., 1986; Smith et al., 1998). Direct-pathway MSNs express the dopamine D1 receptor, and project primarily to pars reticulata of substantia nigra (SNr), as well as sending strong inputs to the entopeduncular nucleus (EP), the rodent homologue of the internal portion of globus pallidus. Indirect-pathway MSNs express the dopamine D2 receptor and send their primary projections to the globus pallidus (GP, external portion in primates). Activation of direct or indirect pathways yields opposing effects on movement, reinforcement, and reward-related behaviors (Ferguson et al., 2011; Hikida et al., 2010; Kravitz et al., 2010; Kravitz et al., 2012; Lobo et al., 2010). Although the gross anatomy of striatal input has been thoroughly studied through use of traditional tracers (Bolam et al., 2000; Gerfen, 1984; Graybiel and Ragsdale, 1979; McGeorge and Faull, 1987; Pan et al., 2010; Ragsdale and Graybiel, 1981; Schwab et al., 1977), these techniques cannot distinguish inputs to specific cell types, nor can they separate synaptic from extrasynaptic input. Moreover, they can often label fibers of passage. Electron microscopy (EM) studies have found some preliminary evidence that input bias into the dorsal striatum may exist (Lei et al., 2004), but these data can only sample small numbers of synapses in a restricted volume of tissue. We wished to overcome these limitations by utilizing newly-developed genetic tools to dissect the inputs to MSN subtypes in dorsal striatum with single cell resolution, at the whole brain level. We sought to determine whether information segregation in the basal ganglia arises at the level of the MSNs in the striatum, or whether these two pathways receive asymmetric input that could differentially regulate the activity of one pathway versus the other. These data could provide a starting point for assessing how distinct striatal inputs shape the functional roles of the direct and indirect pathways.
We utilized pathway-specific Cre driver lines (Gong et al., 2007), combined with a recently-described technique that allows us to target specific cell types and label their monosynaptically-connected inputs (Wall et al., 2010). We then quantified the relative input strengths from brain regions that project directly onto direct- or indirect-pathway MSNs in a central region of dorsal striatum. Together, these data demonstrate specificity of inputs onto distinct projection cell types in the dorsal striatum, and provide motivation for studying the physiological significance of biased input from cortex and the limbic system.
RESULTS
Two-virus system enables targeting of inputs to striatal projection neuron subtypes
We utilized a two-virus system, in combination with Cre-expressing mouse lines (Gong et al., 2007), to target genetically-specified projection neuron subtypes in the striatum and specifically label their monosynaptic inputs (Haubensak et al., 2010; Wall et al., 2010). The first virus is a Cre-dependent adeno-associated virus (AAV) that expresses TVA and rabies glycoprotein; these proteins are necessary for infection and monosynaptic spread of a modified rabies virus, respectively. The second virus is a monosynaptic rabies virus that has been modified in two ways: first, the native rabies glycoprotein in the viral membrane has been replaced with an avian sarcoma leucosis virus envelope protein (EnvA), preventing infection of mammalian neurons in the absence of its binding partner, TVA. Second, the glycoprotein gene from the rabies virus genome has been deleted, preventing new particles from spreading retrogradely in the absence of another source of glycoprotein. Once TVA from the AAV is expressed in Cre+ neurons, the rabies virus specifically infects these cells. Since the Cre-dependent AAV provides Cre+ cells with a source of rabies glycoprotein, newly formed rabies virus particles can spread retrogradely from these Cre+ cells to their directly-connected inputs. These input cells do not contain Cre (and thus do not express TVA or rabies glycoprotein) preventing the rabies virus from spreading beyond this step. This technique effectively restricts rabies virus infection to only Cre+ cells and their direct, monosynaptic inputs.
We injected either D1R-Cre mice, D2R-Cre mice, or wild-type C57 control mice with 180nl of helper virus (Figure 1A), followed three weeks later with 180nl of modified rabies virus injected at the same location, but along a different injection tract (Figure 1B), to avoid potential double-labeling of dopamine receptor-expressing cells along the injection tract. We then waited one week for the rabies virus to replicate and spread monosynaptically before tissue processing and analysis (Figure 1C). We mounted every second section and stained against dsRed to amplify mCherry expression from the rabies virus, and counterstained with a fluorescent Nissl marker (Neurotrace 500/525). We then scanned each slide on a semi-automatic fluorescence slide scanner and counted labeled somata to determine the numbers of retrogradely labeled cells in each brain region. Mice with fewer than 50 input cells originating outside of striatum were excluded from analysis to prevent small number bias, yielding a final data set comprising inputs from 9 D1R-Cre mice and 10 D2R-Cre mice.
Figure 1. Experimental design.

(A) Adult D1R-Cre or D2R-Cre mice are injected in the dorsal striatum with 180 nl of AAV9 expressing TVA and rabies glycoprotein in a Cre-dependent manner.
(B) 21 days later, the same mice are injected with 180 nl of monosynaptic rabies virus that can only infect cells expressing TVA, and can only spread retrogradely from cells expressing rabies glycoprotein.
(C) Direct inputs onto either direct pathway (D1R-expressing) or indirect pathway (D2R-expressing) MSNs are labeled one week after rabies injection.
We specifically selected the GENSAT EY262 D1R-Cre mouse line and the GENSAT ER44 D2R-Cre mouse line due to their near-complete representation of the striatonigral and striatopallidal projection cell populations in dorsal striatum, respectively (Bateup et al., 2010). Although many other Cre lines targeting dopamine receptor-expressing neurons exist, other lines tend to have sparser label in striatum and may only represent a restricted subset of D1R or D2R-expressing projection neurons.
Projection patterns from directly-infected MSNs validate specificity of rabies virus targeting
Direct-pathway MSNs in the dorsal striatum directly project to SNr, with major projections to the EP and a smaller fraction of projections to the GP. As expected, when monosynaptic rabies virus was injected into AAV-infected D1R-Cre mice, dense projections associated with the direct pathway were labeled, terminating in SNr and EP, with some projections to GP (Figure 2A). Fluorescent label in GP in D1R-Cre mice is a combination of fibers traversing to EP/SNr, direct projections from D1R-expressing MSNs, and projections from monosynaptically connected D2R-expressing MSNs (D2R MSNs are known to frequently form connections onto D1R MSNs (Planert et al., 2010; Taverna et al., 2008)). When the striatum was examined at higher power, a stark border between striatum and globus pallidus is detectable, emphasizing the specificity of infection to striatal neurons (Figure 2B). In contrast, when monosynaptic rabies virus was injected into AAV-infected D2R-Cre animals, projections associated with the indirect pathway were obvious (Figure 2C), heavily innervating GP but sparing EP and SNr. Few, if any, direct-pathway MSN axons are visible because D1R->D2R MSN connectivity is extremely low (Planert et al., 2010; Taverna et al., 2008). At higher power, the sharp border between striatum and globus pallidus was again detectable, but heavy labeling of axon terminals in GP again emphasizes the specificity of virus targeting to indirect-pathway MSNs. The sites of primary injection within the striatum were constrained to the same area of striatum, as diagrammed in (Figure 2E–F) and charted in (Figure 2G).
Figure 2. Monosynaptic rabies virus injections into the striatum target the direct or indirect pathways.

Abbreviations: DS: dorsal striatum, GP: globus pallidus, EP: entopeduncular nucleus, SN: substantia nigra.
(A) Injection site and resulting fiber projections from starter cells in a D1R-Cre mouse. As expected, direct-pathway MSNs are labeled and heavily innervate EP and SNr, with some termini in GP. All scale bars indicate 250 μm.
(B) The border between dorsal striatum and globus pallidus shows that direct infection is tightly constrained to the striatum.
(C) Injection site and resulting fiber projections from starter cells in a D2R-Cre mouse. As expected, indirect-pathway MSNs heavily innervate GP, with little to no label in EP or SNr.
(D) Higher magnification at the border of striatum and globus pallidus shows strong direct infection in the striatum, with axon termini in GPe.
(E–F) Mean center and mean injection span are diagrammed with colored crosses in a sagittal section (E) and a coronal section (F). Red crosses indicate the mean extent of injections into D1R-Cre mice, and blue crosses indicate injections into D2R-Cre mice.
(G) Mean position, extent, and variability of the primary injection site for D1R-Cre and D2R-Cre mice. AP: anterior-posterior (positive values indicate anterior to bregma), LM: lateral-medial (values indicate lateral distance from bregma), DV: dorsal-ventral (negative values indicate ventral from bregma).
See also Figure S1.
As noted above, even though the injection sites were somewhat near the border of GP, genetic restriction of primary infection to either D1R- or D2R-expressing MSNs provided nearly complete restriction of primary infection to dorsal striatum (Figure 2B,D). A few cells in the GP were sometimes labeled (Figure 2A), indicating that these cells likely provide direct input to neurons in the dorsal striatum (Bevan et al., 1998). However, due to their proximity to the injection site, these inputs were not analyzed further. Rabies virus infection was rarely detectable at the injection site in wild-type animals (Supplemental Figure 1); in two animals injected with AAV9-FLEX-hGTB, some rabies label was detectable near the injection site, likely due to tiny amounts of leak TVA expression. Four animals injected with AAV9-pEF1α-FLEX-GTB had no detectable rabies virus label anywhere in the brain. Wild-type mice never had any label outside of striatum, indicating that rabies glycoprotein is not expressed at high enough levels in the absence of Cre to allow for transsynaptic spread of rabies virus. These observations demonstrate that any label found outside the striatum is due to the monosynaptic spread of rabies virus from Cre+ neurons.
The majority of inputs to both the direct and indirect pathways arise from cortex and thalamus
Figure 3 summarizes the major long-range inputs onto the direct and indirect pathways in the region of dorsal striatum diagrammed in Figure 2E–G. Since our helper virus did not allow for direct visualization of the number of starter cells, we only report the percentage of total input provided by any given brain region. Inputs were normalized across each animal to prevent mice with many labeled inputs from overly biasing total input proportion. Only inputs that were detected in at least three mice total (across all mouse types) were included for display. For D1R-Cre mice, 162±24 transsynaptically-labeled cells were detected per animal outside of the striatum (n=9, mean±1 SEM); for D2R-Cre mice, 207±29 cells per animal were detected (n=10, p=0.3 for D1R vs. D2R by two-tailed t-test). For WT mice, no cells were detected (n=6). Corticostriatal neurons comprised the majority of long-range inputs onto both pathways (61.1% of total inputs onto the direct pathway, 69.6% onto the indirect pathway). These inputs arose primarily from the somatosensory and motor cortices, but there was also significant input from prefrontal cortical structures and limbic structures known to project directly into striatum. Dorsolateral striatum is known to receive primarily somatosensory and motor inputs (Kunzle, 1975; Liles and Updyke, 1985; McGeorge and Faull, 1989), while dorsomedial striatum is thought to receive a higher proportion of frontal and limbic inputs (Goldman and Nauta, 1977; McGeorge and Faull, 1989; Ragsdale and Graybiel, 1981). The slight lateral bias of the injection site (Figure 2F) likely explains the relative proportion of inputs from various cortical structures.
Figure 3. Summary of monosynaptic inputs onto direct- and indirect-pathway MSNs.

Direct pathway inputs are labeled in red, indirect pathway inputs labeled in blue. Only inputs that were detected in at least three animals are displayed. The majority of direct synaptic inputs arise from cortex and thalamus, with a smaller proportion of inputs from midbrain and hindbrain structures. Error bars indicate 1 SEM.
Thalamus provided the majority of the remaining inputs into striatum (22.0% of total inputs onto the direct pathway, 25.5% of total inputs onto the indirect pathway). Although the dorsal striatum receives input from a large number of thalamic nuclei, the majority of thalamostriatal input arose from the medial dorsal and parafascicular nuclei. These inputs correspond well with previous experiments using traditional retrograde tracers to label thalamic inputs to the region of dorsal striatum that we targeted (Erro et al., 1999; Pan et al., 2010; Schwab et al., 1977; Smith et al., 2009).
Preferential innervation of direct- or indirect-pathway striatal projection neurons
We first wished to determine whether there were differences in the excitatory drive onto the direct vs. indirect pathway, so we examined the strength of cortical glutamatergic input to D1R vs. D2R-expressing cells. Representative images from three cortical structures (primary sensory (Figure 4A–B) and motor cortices (Figure 4C–D), as well as the orbitofrontal cortex (Figure 4E–F)) demonstrate the quality of label obtained via monosynaptic tracing. Due to the slight lateral injection targeting, the chosen injection site is dominated by sensorimotor input, but also contains considerable prefrontal and a small amount of limbic cortical input (Figure 4G). We separated the corticostriatal input into four major streams: prefrontal (insular and orbitofrontal cortices, as well as the frontal association area), motor (primary and secondary motor cortices), sensory (primary and secondary somatosensory cortices), and limbic (prelimbic, retrosplenial, cingulate, perirhinal, and entorhinal cortices).
Figure 4. Biased cortical synaptic input to the direct and indirect pathways.

(A–B) Cortical inputs from somatosensory cortex onto both direct and indirect pathway MSNs arise almost exclusively from superficial layer 5, though overall input density appeared to be higher onto direct pathway MSNs. Scale bar = 100μm and applies to panels A–F.
(C–D) Motor cortex inputs onto both pathways arise primarily from superficial layer 5, but some superficial layer cells also contribute input. Motor cortex preferentially innervates the indirect pathway.
(E–F) Inputs from the insular and orbital cortices (labeled PFC) arise from both superficial and deep layers, and appear to innervate both the direct and indirect pathway similarly.
(G) Cortical inputs were segregated into four major input streams. Direct pathway inputs are colored red, whereas indirect pathway inputs are shaded in blue. Individual p values indicate two-tailed t-test comparison of direct vs. indirect pathway input for each stream. Error bars indicate 1 SEM.
(H) Center of gravity analysis demonstrates that cortical input to the direct pathway is significantly caudal to that for the indirect pathway. Individual anterior-posterior centers of gravity are indicated by colored circles at the top of the graph. The two-dimensional chart shows center of gravity for cortical inputs to the direct and indirect pathways in both the anterior-posterior and dorsal-ventral dimensions. Bar width indicates ±1 SEM. The plane of slice is 2.04 mm lateral to the midline. The border between primary somatosensory and primary motor cortex at this plane of slice is indicated by the dashed line for reference. One mouse with significantly different center of gravity is excluded in the D1R-Cre cohort, and is indicated by the light circle.
(I) Summary diagram showing the relative contribution of different cortical layers to striatal input for four different cortical areas in the plane of slice containing the cortical center of gravity (ordered from rostral to caudal). Within a given cortical region, each cortical layer provided similar proportions of synaptic input to the direct and indirect pathways, even though total proportion of inputs could be dramatically different (see figure 3). More rostral brain structures provided more superficial input than more caudal cortical areas. ND: not determined, representing the portion of labeled neurons whose layer identity could not be accurately determined, largely due to plane of slice providing ambiguous layer information.
(J) Summary image diagrams both the relative strength of layer input from major cortical input structures (shaded in tan) as well as the relative amount of input streaming from each cortical area onto direct (red) and indirect (blue) motor pathway MSNs, as well as the downstream targets of these MSNs.
See also Figures S2 and S3.
We found that while prefrontal cortical structures provided a similar proportion of input to direct- and indirect-pathway MSNs (21.3%±3.3% of total cortical input vs. 25.1%±2.4% onto D1R cells vs. D2R cells, respectively; all reported values are mean ± 1 SEM, p=0.4 by two-tailed t-test), other cortical structures provided considerably biased synaptic input to one stream or the other (Figure 4G). Motor cortices provided significantly higher proportions of input to the indirect pathway (28.9%±3.3% vs. 43.1%±3.2%, p=.007). In contrast, somatosensory and limbic cortices tended to provide a stronger proportion of input to the direct pathway (somatosensory: 38.4%±3.6% vs. 29.3%±2.6%, p=0.05; limbic: 11.3%±3.4% vs. 2.5%±1.2%, p=0.02). As seen in Figure 3, biased sensory and motor input almost exclusively arose from the primary cortical structures, whereas all limbic structures appeared to provide a larger proportion of inputs to direct pathway MSNs. These data provide evidence for some segregation of cortical input to the two striatal projection pathways.
To further demonstrate the difference in the proportions of cortical input innervating the direct and indirect pathways, we performed a center of gravity analysis to determine the center of corticostriatal input to D1R and D2R MSNs (see Supplemental Methods). Overall, corticostriatal inputs to the direct pathway were significantly posterior to the inputs to indirect pathway neurons (0.63mm±0.11mm rostral to bregma for D1R-Cre mice, 0.93mm±0.06mm for D2R-Cre mice, p=0.03 by two-tailed t-test). One D1R-Cre mouse with considerable prefrontal input had significantly shifted center of gravity compared to all other animals (p<0.05 via Grubbs’ outlier test) and was removed from visual comparison (with outlier removed, center of gravity was 0.54mm±0.07mm for D1R-Cre mice, vs 0.93mm±0.06mm for D2R-Cre mice, p=7×10⁻⁴ by two-tailed t-test, Figure 4H; outlier is indicated by faded circle). The dashed line delineates the border between primary somatosensory and primary motor cortex at the sagittal slice containing both cohorts’ center of gravity (2.04 mm lateral from the midline). Both the lateral-medial and dorsal-ventral center of gravity positions were nearly identical between D1R-Cre and D2R-Cre mice (LM: 2.08mm±0.10mm lateral from the midline vs. 2.05mm±0.07mm for D1R-Cre vs. D2R-Cre mice, DV: 2.07mm±0.05mm deep from bregma vs. 2.07mm±0.06mm). These data indicate that more posterior cortical structures (somatosensory and limbic cortices) provide more input to the direct pathway, whereas more rostral cortices (namely, primary motor cortex) provide stronger input to the indirect pathway.
To verify that the small differences in injection site were not responsible for the observed differences in cortical input, we examined the degree of correlation between the anterior-posterior position of the center of the striatal injection site and the anterior-posterior center of gravity of cortical input across all cell types (n=19). We determined that injection site location predicted less than 5% of the variance in cortical input location (Supplemental Figure 2). As expected, the cortical center of gravity for D1R-Cre mice fell below the best-fit line for 7 of 9 animals, whereas cortical center of gravity for D2R-Cre mice fell above the best-fit line for 7 of 10 animals. These observations indicate that cell type identity is much more likely to be the major contributor to cortical input specificity.
No difference in proportion of cortical layer input to direct- or indirect-pathway projection neurons
It is known that two morphologically distinct types of corticostriatal pyramidal cells exist, which have been proposed to differentially innervate striatal projection neuron subtypes (Lei et al., 2004; Reiner et al., 2003). Intratelencephalic-type (IT-type) pyramidal neurons project to both ipsilateral and contralateral striatum, whereas another type of corticostriatal neuron only projects to ipsilateral striatum but also sends projections along the pyramidal tract (PT-type). There is some evidence to suggest that these two cell types may preferentially reside in different cortical layers in rats (Lei et al., 2004; Reiner et al., 2003), although there are also studies in both mice and rats suggesting that PT and IT neurons largely inhabit the same cortical layers (McGeorge and Faull, 1987; Sohur et al., 2012). To determine whether different cortical layers preferentially targeted the direct or indirect pathway, we documented the levels of layer 2/3, superficial layer 5, and deep layer 5 monosynaptic inputs onto either D1R or D2R-expressing MSNs.
When examined across the four cortical regions that provided the greatest input to dorsal striatum (Figure 4I), direct- and indirect-pathway MSNs received similar proportional levels of input from each cortical layer (S1: primary somatosensory cortex, M1: primary motor cortex, M2: secondary motor cortex, PFC: insular and orbitofrontal cortices, p>0.15 for all individual cortical region/layer D1R vs. D2R comparisons by two-tailed t-test). Furthermore, there was no significant difference in terms of overall cortical input strength from any specific input layer. For layer 2/3, inputs were 19.3%±2.5% vs. 23.3% ±2.1% of overall cortical inputs from D1R vs. D2R, mean±1 SEM, p=0.2 by two-tailed t-test. For superficial layer 5, including all layer 5 input from prefrontal regions, inputs were 56.7%±2.6% vs. 55.7%±2.7%, p=0.8. For deep layer 5, inputs were 10.4%±3.0% vs 8.2%±1.1%, p=0.5. Contralateral corticostriatal input was too sparse for statistical comparison, but for the animals with greatest overall cortical label, contralateral inputs comprised 5.2%±2.7% of cortical input in D1R-Cre mice (n=3, mean±1 SEM), and 8.1%±2.8% of total cortical input in D2R-Cre mice (n=5). The overall distribution of corticostriatal inputs to the targeted striatal region was validated by injecting a G-deleted rabies virus with native glycoprotein on its surface [(B19G)SAD-ΔG-mCherry]. This virus acts as a traditional retrograde tracer, which is taken up nonspecifically at axon terminals when injected into a brain region of interest. Retrograde tracer rabies virus injections demonstrated similar layer input patterns to those discovered using the cell-type specific, monosynaptic rabies virus (Supplemental Figure 3). These results demonstrate that each cortical layer similarly innervates both the direct and indirect pathways, and in conjunction with observations regarding contralateral input, suggest that the two corticostriatal projection cell types do not provide biased synaptic input to either the direct or indirect pathway.
Both the strength of cortical layer input and cortical region input are summarized in Figure 4J. Although cortical structures provided similar layer input to both the direct and indirect pathways, more frontal cortical structures provided a greater proportion of superficial input compared to primary somatosensory and motor cortices. Overall, motor cortex preferentially innervates the indirect pathway, whereas somatosensory and limbic cortices provide biased input to the direct pathway. This information bias could be propagated to downstream basal ganglia structures targeted by direct and indirect pathway MSNs.
Thalamic input into the striatum does not show biased connectivity
The other main source of excitatory input into the striatum arises from glutamatergic thalamostriatal afferents; various thalamic nuclei provided approximately 25% of the total input neurons in our experiments. Of these nuclei, the parafascicular (PF) nucleus and the medial dorsal (MD-MDL) nuclei of the thalamus provided the strongest input, with considerable remaining input from the central (CM-CL), ventromedial (VM), anterior medial (AM), and anterior lateral (AL) nuclei. These results are summarized in Figure 5; thalamic sections were manually registered via scaled rotation at 1/6 sampling density to provide a representative map of thalamic input neurons. All thalamic nuclei provided similar input to both direct and indirect pathway MSNs; of the two largest input structures, the parafascicular nucleus provided 46.9%±3.7% vs. 55.0%±4.7% of total thalamic input to D1R vs. D2R-expressing neurons, mean±1 SEM, p=0.2 by two-tailed t-test, and the medial dorsal nuclei provided 37.3%±3.2% vs. 28.8±3.9% of total thalamic input to D1R-Cre mice vs. D2R-Cre mice, p=0.1.
Figure 5. Thalamus similarly innervates direct- and indirect-pathway MSNs.

(A) Sagittal slice diagram depicts the site of densest thalamic input. The dashed box corresponds to the region of interest displayed in (D) and (E).
(B,D,F) Thalamic inputs onto direct pathway MSNs labeled at 1/6 sampling density. The majority of thalamic inputs arise from thalamic nuclei MD, MDL and PF, with other inputs from AD, AM, and the central nuclei.
(C,E,G) Thalamic inputs onto indirect pathway MSNs labeled at 1/6 sampling density. The majority of thalamic inputs arise from nuclei MD, MDL, and PF, with nuclei VM, AM, and VL providing smaller proportions of input. Abbreviations: AD: anterior dorsal nucleus, AM: anterior medial nucleus, AV: anterior ventral nucleus, CL: central lateral nucleus, CM: central medial nucleus, Gus: gustatory nucleus, IAD: interior anterior dorsal nucleus, LDDM: lateral dorsal nucleus, dorsomedial portion, LPMR: lateral posterior nucleus, mediorostral portion, LHb: lateral habenula, MD: medial dorsal nucleus, MDC: medial dorsal nucleus, central portion, MDL: medial dorsal nucleus, lateral portion, MHb: medial habenula, PC: paracentral nucleus, PT: paratenial nucleus, Re: reuniens nucleus, Rt: reticular thalamic nucleus, Sub: submedius nucleus, VA: ventral anterior nucleus, VL: ventral lateral nucleus, VM: ventral medial nucleus.
The amygdala preferentially innervates direct-pathway MSNs
Both the central and basolateral nuclei of the amygdala are known to innervate the striatum (Kelley et al., 1982; McDonald, 1991; Pan et al., 2010), but the specificity and relevance of this input stream is not well understood. The amygdala provided considerably stronger synaptic input to the direct pathway (mean 4.3% ± 1.4% of total inputs for D1R-Cre, vs. 0.1% ± 0.1% for D2R-Cre mice, p=0.02 by one-tailed Wilcoxon rank-sum test, z=2.16, U=18. Non-parametric statistical test used because D2R input is floored near zero). Amygdala inputs were manually registered via scaled rotation at 1/2 sampling density (Figure 6), demonstrating biased input from both basolateral and central nuclei onto direct pathway MSNs. This observation mirrors the biased limbic cortical synaptic input to the direct pathway described in Figure 4. These results suggest that the limbic system, including both limbic cortex and amygdala, may convey affective value information to the striatum, biasing action selection preferentially through the direct pathway, consistent with a role for the direct pathway in reinforcement (Kravitz et al., 2012; Stuber et al., 2011). Although we targeted the direct vs. indirect pathway independently of striosomal organization, our results regarding preferential innervation of the direct pathway from limbic structures parallels evidence in the striosomal literature; intriguingly, limbic cortices (Gerfen, 1984, 1989; Jimenez-Castellanos and Graybiel, 1987) and the amygdala (Ragsdale and Graybiel, 1988) are thought to preferentially innervate striosomal compartments, which may themselves be preferentially populated with direct-pathway-like MSNs that project to the SNc, as well as to the SNr, GP, and EP (Fujiyama et al., 2011). These results, in conjunction with our own experiments, suggest that both target cell location within the striosome-matrix dichotomy (Kincaid and Wilson, 1996) and neuronal cell type may interact to generate fine-scale organization within the dorsal striatum.
Figure 6. Central and basolateral amygdala preferentially innervate the direct pathway.

(A) Whole slice images were manually registered via scaled rotation at 1/2 sampling density. Region of interest is indicated with a square and is plotted in greater detail in (B–E).
(B–E) Coronal sections through the amygdala are depicted at four different anterior-posterior positions. Direct pathway inputs depicted in red, indirect pathway inputs in blue. Abbreviations: BLA: basolateral nucleus of the amygdala, anterior portion., BMA: basomedial nucleus of the amygdala, anterior portion, BMP: basomedial nucleus of the amygdala, posterior portion, CeC: central nucleus of the amygdala, capsular portion, CeL: central nucleus of the amygdala, lateral portion, CeM: central nucleus of the amygdala, medial portion, DEn: dorsal endopiriform nucleus, La: lateral nucleus of the amygdala, Pir: piriform cortex, VEn: ventral endopiriform nucleus. Although stereotaxic coordinates of all cells are accurate, heterogeneity in distribution of amygdala nuclei in individual mice may not overlap completely with atlas borders.
Monosynaptic rabies virus labels a small proportion of total dopaminergic input to the dorsal striatum
We examined the strength of synaptic dopaminergic input from the substantia nigra onto striatal projection cells. Surprisingly, we observed that a relatively small proportion of total labeled inputs arose from the substantia nigra pars compacta (SNc), but that SNc similarly innervated both direct- and indirect-pathway MSNs. When using the monosynaptic rabies virus system, only 0.8%±0.3% of the brain-wide inputs arose from SNc onto either direct- or indirect-pathway MSNs (Figure 3, Figure 7C). Figure 7A shows a representative image of substantia nigra in a D1R-Cre mouse. As expected, dense striatonigral axon fibers from direct-pathway MSNs are detectable in substantia nigra pars reticulata (SNr), but relatively few retrogradely-labeled neurons are visible in pars compacta. In D2R-Cre mice, few if any fibers were detected in SNr, as expected for targeting indirect-pathway MSNs (Figure 7B). Again, relatively few retrogradely labeled neurons were detected in SNc.
Figure 7. Monosynaptic rabies virus only labels a small proportion of total dopaminergic input to the dorsal striatum.
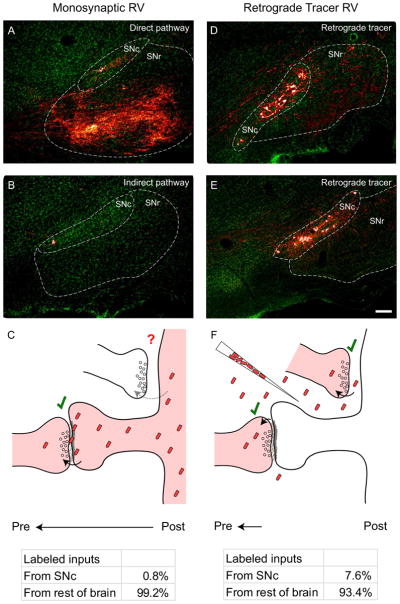
(A) Substantia nigra in a D1R-Cre mouse. A large number of axon fibers from direct pathway starter cells are visible in SNr, but few retrogradely labeled cells are detectable in SNc.
(B) Substantia nigra in a D2R-Cre mouse. Since indirect pathway MSNs do not project to the substantia nigra, few if any fibers are detectable in SNr. Again, few retrogradely labeled neurons are detectable in SNc.
(C) Diagram of rabies virus spread from targeted striatal MSNs to their presynaptic partners. Genetically-targeted, monosynaptic RV efficiently spreads at many types of synapses (see Figure 3), but less than 1% of labeled inputs arise from SNc.
(D–E) Substantia nigra in C57 control mice injected in the striatum with a retrograde tracer rabies virus expressing mCherry. When rabies virus is taken up nonspecifically at axon terminals in striatum, many dopaminergic cells are labeled in SNc.
(F) Diagram of rabies virus as a traditional retrograde tracer, which is taken up at axon terminals near the viral injection site. When injected into dorsal striatum, nearly 8% of retrogradely labeled cells are found in SNc, indicating that rabies virus is efficiently taken up at dopaminergic axon terminals. When compared to (C), these observations suggest that either the extracellular space or the dendritic composition in starter cells prevents monosynaptic rabies virus from spreading to the majority of apposed dopaminergic terminals. Scale bar = 100 μm for all panels.
To determine whether these values differed from the overall levels of dopaminergic innervation to striatum, we sampled the proportion of brain-wide inputs arising from the SNc using a similar rabies virus that functions as a traditional retrograde tracer. When utilizing the rabies virus as a traditional retrograde tracer, virus particles are injected at high titer into the brain region of interest, spread through the extracellular space, and are then taken up at axon terminals (Figure 7F, top). We noted not only a large absolute number of labeled neurons in the SNc using this method (Figure 7D–E), but also that the proportion of labeled SNc cells compared to the total number of labeled neurons in the brain was much higher than observed using the monosynaptic rabies virus. Our data indicated that 7.6%±0.3% (mean±SEM, n=5) of the total input neurons labeled in the brain using this assay arose from SNc (Figure 7F, bottom). These values very closely mirror the estimated proportion of labeled neurons in SNc using other retrograde tracers (Pan et al., 2010), as well as the overall proportion of dopaminergic axon terminals in striatum previously determined through EM (Groves et al., 1994). This indicates that rabies virus is very efficiently taken up at dopaminergic axon terminals, suggesting that monosynaptic spread of rabies virus from direct- or indirect-pathway MSNs is limited by some other factor (see Discussion). Furthermore, the similar amount of synaptic input to direct vs. indirect-pathway MSNs indicates that differential dopamine signaling in MSN subtypes does not arise from differences in anatomical connectivity.
Other striatal inputs
The dorsal raphe nuclei provided some synaptic input to both pathways (1.1% ± 0.8% in D1R-Cre mice, 0.1%±0.1% in D2R-Cre mice) but the total number of synaptic inputs was relatively small. The small amount of serotonergic input again suggests that neuromodulatory streams may provide relatively little direct synaptic input to striatal MSNs. However, the small total number of counted inputs, combined with high variability in labeling, prevented a direct statistical comparison between synaptic and total serotonergic input. Direct serotonergic input to the dorsal striatum has been previously described (Pan et al., 2010; Vertes, 1991), but its potential functional roles are only beginning to be explored (Di Matteo et al., 2008).
Minor inputs (<1% of total inputs, but documented in at least three animals), were also documented from the pedunculopontine tegmental nucleus (PPTg), subthalamic nucleus, hypothalamus, and basal nucleus of Meynert. The projection from PPTg to the dorsal striatum has been described in other animal models (Nakano et al., 1990; Saper and Loewy, 1982), suggesting that PPTg to dorsal striatum connectivity is highly conserved across species. The subthalamic nucleus has also been shown to provide some direct input to dorsal striatum in mice (Pan et al., 2010), indicating high levels of interconnectivity between mouse basal ganglia nuclei. Inputs from the hypothalamus and basal nucleus of Meynert represented the sparsest data from our dataset (when sampled at half density, one cell each was detected in three animals total). These non-canonical input structures would need more evidence to conclusively demonstrate the existence of these connections.
DISCUSSION
We built brain-wide maps of inputs to the two main projection cell types in striatum, discovering both striking similarities and notable differences in the patterns of synaptic input to the direct or indirect pathway that were not observable using standard anatomical approaches. Cortical and limbic structures provided biased proportions of synaptic input to the two basal ganglia pathways, whereas individual cortical layers, thalamic nuclei, and dopaminergic input were largely equivalent across the two classes of striatal MSN. By using genetic tools to segregate the inputs to D1R and D2R-expressing MSNs, we demonstrated that information segregation into the basal ganglia occurs before the level of the striatal medium spiny neuron, and that different brain structures vary in degree to which they preferentially innervate specific target cell classes in the striatum.
Potential roles for asymmetric input into dorsal striatum
The specific roles of the direct and indirect pathways in behavior have been debated for decades, and identification of the sources of synaptic inputs to these circuits may provide fresh insight into their function. Classical models of the basal ganglia have suggested that the direct pathway facilitates, whereas the indirect pathway suppresses, movements and actions (Albin et al., 1989; DeLong, 1990), yet their roles are surely more complex than this. Modeling and evidence from reinforcement paradigms suggest that, within specific contexts, the direct pathway may facilitate previously-rewarded actions, whereas the indirect pathway may suppress previously-unrewarded actions (Bromberg-Martin et al., 2010; Frank et al., 2004; Hikida et al., 2010; Kravitz et al., 2012). Such a scheme relies on an integration of motor, sensory, and reward information, yet little is known about how this information is relayed to the basal ganglia or how it might affect specific cell types (Fee, 2012). Dopamine is hypothesized to oppositely act on direct- and indirect-pathway MSNs via distinct signaling through Gs-coupled D1 and Gi-coupled D2 receptors (Gerfen et al., 1990), but differential actions of motor and sensory afferents on MSN subtypes has not, to our knowledge, been proposed.
Here, we find differential innervation of indirect-pathway MSNs by motor cortex afferents, whereas inputs transmitting contextual information (sensory/limbic) preferentially innervate direct-pathway MSNs. This architecture suggests a model of basal ganglia function in which action information (e.g. efference copy) is differentially transmitted to the indirect pathway, potentially to suppress competing actions, or to prime the animal to switch to the next step in an action sequence. In contrast, contextual information, encompassing sensory information (from somatosensory cortex) and valence (from amygdala) may be preferentially routed to the direct pathway to select or initiate actions, based on past experiences in similar contexts. However, as with any anatomical labeling technique, we must be careful extrapolating physiological significance for an entire brain structure from anatomical data alone, particularly given that we only sampled from a restricted, slightly laterally-biased region in dorsal striatum.
We did not detect differential input to direct- or indirect-pathway MSNs from specific cortical layers, which have been proposed to contain different types of corticostriatal projection cells, nor did we see an obvious bias from our limited sample of contralateral cortical input. These results run counter to a previous study that identified preferential input from intratelencephalic-projecting corticostriatal cells onto the direct pathway and PT-type input to the indirect pathway, based on the diameter of corticostriatal axon terminals (Lei et al., 2004). In contrast, our data are consistent with electrophysiological studies demonstrating similar effects on direct- and indirect-pathway MSNs after stimulation of the IT-type cortical neurons in the contralateral hemisphere (Ballion et al., 2008).
Literature regarding the layer segregation of PT and IT cells is mixed; although studies have documented a preponderance of IT cells in layer 2/3 and superficial 5 of rat cortex (Lei et al., 2004; Reiner et al., 2003), previous documentation in rats (McGeorge and Faull, 1987), as well a recent study in mice suggests that IT cells are distributed throughout layer 5, with relatively few cells in layer 2/3 (Anderson et al., 2010; Kiritani et al., 2012; Sohur et al., 2012). This distribution may also vary by cortical area, suggesting that layer identity may not be a particularly effective means for identifying corticostriatal neuronal subtype across many cortical regions in the mouse.
Synaptic dopamine
Although we observed monosynaptic input from SNc onto both direct- and indirect-pathway MSNs, further examination using a rabies virus in a traditional retrograde tracer mode indicated that monosynaptic rabies virus only labeled a small proportion of the nigrostriatal input to our injection site. Rabies virus as a retrograde tracer is injected and taken up nonspecifically at any axon terminals near the injection site (Figure 7F, top). In contrast, the monosynaptic rabies virus used in the rest of this paper must be synthesized in the postsynaptic cell, trafficked to the postsynaptic membrane, fuse with the postsynaptic membrane, spread across the extracellular space, and then be taken up by the presynaptic axon terminal (Figure 7C, top). Although the absolute efficiency of these two systems is quite different, the overall proportions of input from a given brain region should be similar unless some element is specifically facilitating or preventing the monosynaptic rabies virus from spreading at a particular connection. Given rabies virus’ known broad tropism (Callaway, 2008; Ugolini, 2010), our demonstrated ability for rabies virus to be taken up at dopaminergic axon terminals (Figure 7F, bottom), and the broad labeling of many other types of traditional synapses using the monosynaptic rabies virus (Figure 3), the observed difference in ability of the monosynaptic rabies virus to spread from striatal neurons to SNc inputs is likely due to either a difference in the ability of the rabies virus to be recruited to most dendritic sites apposed to dopaminergic terminals, or that the extracellular space between the dopaminergic axon terminal and the striatal MSN does not allow for monosynaptic rabies virus particles to effectively traverse.
Previous EM evidence suggests that both of these considerations may come into play; although some dopaminergic terminals have been documented to form connections onto the spines of MSNs, many dopaminergic terminals have been found apposed to dendritic shafts with no detectable electron-dense postsynaptic structure (Descarries et al., 1996; Groves et al., 1994; Hanley and Bolam, 1997). Furthermore, the extracellular space between the dopaminergic axon terminal and the putative postsynaptic site is frequently found to lack the tight junctional coupling that is one of the hallmarks of traditional chemical synapses at the EM level (Descarries et al., 1996). These observations, in addition to data suggesting a high degree of spread of dopamine from dopamine axon terminals (Cragg and Rice, 2004; Rice and Cragg, 2008), as well as observations showing the very high affinity of dopamine receptors for low concentrations of extracellular dopamine (Richfield et al., 1989), have previously been used to argue for a “volume transmission” mode of signaling for the nigrostriatal dopamine projection (Arbuthnott and Wickens, 2007; Rice et al., 2011). This model proposes that in addition to traditional chemical synaptic signaling, dopaminergic neurons also release dopamine extrasynaptically to modulate multiple neurons over a large physical space. Our findings are consistent with this dual-transmission model; however, we cannot rule out the possibility that the postsynaptic membrane apposed to dopaminergic terminals is simply extremely specialized and selectively blocks effective recruitment of nascent rabies virus particles to this synapse.
Technical considerations
We must emphasize that although we discovered differences in the relative proportion of labeled input cells from certain brain structures onto either the direct or indirect pathway, this technique alone does not provide conclusive information regarding the physiological importance of this biased connectivity. Indeed, since the virology of rabies virus spread is incompletely understood, we cannot even be completely certain of the anatomical substrate for these documented differences in input strength from various brain structures. These values could potentially be associated with a number of factors, including total synapse number, total surface area of synaptic contacts, or other incompletely understood parameters associated with the retrograde spread of rabies virus (Callaway, 2008; Ugolini, 2010). Furthermore, since there is broad topographic organization of projections into dorsal striatum, it is possible that other regions of striatum that were not targeted in our experiments could show differing patterns of input organization. Instead, we should treat these data as a resource for generating predictive hypotheses for the organization of inputs into the dorsal striatum, which can then be probed using functional techniques.
EXPERIMENTAL PROCEDURES
All methods using live animals described below were in accordance with protocols approved by the Salk Institute and University of California, San Francisco Institutional Animal Care and Use Committees.
Virus production
Cre-dependent helper viruses expressing TVA and rabies glycoprotein [pAAV-FLEX-hGTB (Addgene #26196) and pAAV-EF1α-FLEX-GTB (Addgene #26197)] were produced either by the Salk Viral Vector Core (hGTB), or through transfection and crude lysis isolation of HEK293T cells (GTB) as in (Wall et al., 2010). EnvA-pseudotyped, G-deleted rabies viruses were produced in a manner similar to that described in (Wall et al., 2010; Wickersham et al., 2010). Additional information can be found in Supplemental Experimental Procedures.
Animal surgery and viral injection parameters
D1R-Cre (GENSAT BAC transgenic EY262) and D2R-Cre (GENSAT BAC transgenic ER44) mice (Gong et al., 2007) were maintained in a C57Bl/6 background and selected for experiments when animals were 2–6 months of age. For all experiments, age- and sex-matched C57Bl/6 mice were used as controls. Injections were performed as in (Wall et al., 2010). All mice received 180 nL monohemispheric injections of AAV expressing TVA and RG at the following coordinates (all values given relative to bregma): 0.5 mm rostral, 2.0 mm lateral, 3.25 mm ventral, and allowed to recover for three weeks prior to rabies virus injection. (EnvA)SAD-ΔG-mCherry rabies virus was injected under the same conditions and injection volume as the initial AAV injection. Rabies virus was allowed to replicate and spread for 7 days prior to perfusion and tissue processing. For retrograde tracer experiments, 180 nL of (B19G)SAD-ΔG-mCherry was injected into dorsal striatum using the same parameters as above, and allowed to incubate for 7 days prior to perfusion and tissue processing.
Tissue processing
To preserve brain tissue for imaging and subsequent analysis, animals were intracardially perfused with 30 mL solution containing 4% paraformaldehyde in 0.1M phosphate buffer, pH 7.2. After perfusion, the brain was isolated and transferred to a post-fixative solution containing 4% paraformaldehyde and 30% sucrose in phosphate-buffered saline (PBS), and then incubated overnight at 4 degrees Celsius on a rotating shaker.
40 μm brain sections were prepared using a microtome with freezing stage, and tissue was separated into 4–6 groups to allow for multiple tissue manipulations. Most brains were cut sagitally in order to better visualize striatonigral projection axons, as well as frontal cortex layer boundaries. However, some brains were instead cut coronally to better delineate cortical layer borders near the midline and in very lateral cortical regions. Tissue groups that were not used immediately were placed in a cryopreservative solution (30% glycerol, 30% ethylene glycol in PBS) and stored at −20 degrees Celsius.
Fixed tissue was immunostained using a standard protocol. To preserve mCherry signal, we used a rabbit polyclonal antibody against DsRed (1:250, Clontech, Mountain View, CA) and amplified with a Cy3-conjugated anti-rabbit secondary antibody (Jackson ImmunoResearch, West Grove, PA). To visualize cell bodies and perikarya, tissue was also labeled with a fluorescent Nissl stain (Neurotrace 500/525, Invitrogen, Carlsbad, CA) at 1:500 dilution in PBS for 15 minutes after immunostaining.
Immunostained tissue was mounted on chrome-gelatin subbed slides and allowed to dry overnight. Tissue was then dehydrated and defatted using a series of ethanol and xylenes immersion steps. Slides were then coverslipped using Krystalon (Harleco, Gibbstown, NJ) mounting medium and glass coverslips.
Supplementary Material
Acknowledgments
We would like to thank Liza Schoenfeld and Karine Von Bochmann for technical assistance, as well as Harvey Karten and David Kleinfeld for anatomical discussion and providing access to the Nanozoomer slide scanner. This work was supported by National Institutes of Health grants MH063912, NS064984, and DA010154, with additional support from the Gatsby Charitable Foundation.
Footnotes
Publisher's Disclaimer: This is a PDF file of an unedited manuscript that has been accepted for publication. As a service to our customers we are providing this early version of the manuscript. The manuscript will undergo copyediting, typesetting, and review of the resulting proof before it is published in its final citable form. Please note that during the production process errors may be discovered which could affect the content, and all legal disclaimers that apply to the journal pertain.
References
- Albin RL, Young AB, Penney JB. The functional anatomy of basal ganglia disorders. Trends Neurosci. 1989;12:366–375. doi: 10.1016/0166-2236(89)90074-x. [DOI] [PubMed] [Google Scholar]
- Anderson CT, Sheets PL, Kiritani T, Shepherd GM. Sublayer-specific microcircuits of corticospinal and corticostriatal neurons in motor cortex. Nat Neurosci. 2010;13:739–744. doi: 10.1038/nn.2538. [DOI] [PMC free article] [PubMed] [Google Scholar]
- Arbuthnott GW, Wickens J. Space, time and dopamine. Trends Neurosci. 2007;30:62–69. doi: 10.1016/j.tins.2006.12.003. [DOI] [PubMed] [Google Scholar]
- Ballion B, Mallet N, Bezard E, Lanciego JL, Gonon F. Intratelencephalic corticostriatal neurons equally excite striatonigral and striatopallidal neurons and their discharge activity is selectively reduced in experimental parkinsonism. Eur J Neurosci. 2008;27:2313–2321. doi: 10.1111/j.1460-9568.2008.06192.x. [DOI] [PubMed] [Google Scholar]
- Bateup HS, Santini E, Shen W, Birnbaum S, Valjent E, Surmeier DJ, Fisone G, Nestler EJ, Greengard P. Distinct subclasses of medium spiny neurons differentially regulate striatal motor behaviors. Proc Natl Acad Sci U S A. 2010;107:14845–14850. doi: 10.1073/pnas.1009874107. [DOI] [PMC free article] [PubMed] [Google Scholar]
- Beckstead RM. Striatal substance P cell clusters coincide with the high density terminal zones of the discontinuous nigrostriatal dopaminergic projection system in the cat: a study by combined immunohistochemistry and autoradiographic axon-tracing. Neuroscience. 1987;20:557–576. doi: 10.1016/0306-4522(87)90110-2. [DOI] [PubMed] [Google Scholar]
- Bevan MD, Booth PA, Eaton SA, Bolam JP. Selective innervation of neostriatal interneurons by a subclass of neuron in the globus pallidus of the rat. J Neurosci. 1998;18:9438–9452. doi: 10.1523/JNEUROSCI.18-22-09438.1998. [DOI] [PMC free article] [PubMed] [Google Scholar]
- Bolam JP, Hanley JJ, Booth PA, Bevan MD. Synaptic organisation of the basal ganglia. J Anat. 2000;196(Pt 4):527–542. doi: 10.1046/j.1469-7580.2000.19640527.x. [DOI] [PMC free article] [PubMed] [Google Scholar]
- Bromberg-Martin ES, Matsumoto M, Hikosaka O. Dopamine in motivational control: rewarding, aversive, and alerting. Neuron. 2010;68:815–834. doi: 10.1016/j.neuron.2010.11.022. [DOI] [PMC free article] [PubMed] [Google Scholar]
- Callaway EM. Transneuronal circuit tracing with neurotropic viruses. Curr Opin Neurobiol. 2008;18:617–623. doi: 10.1016/j.conb.2009.03.007. [DOI] [PMC free article] [PubMed] [Google Scholar]
- Chang HT, Wilson CJ, Kitai ST. Single neostriatal efferent axons in the globus pallidus: a light and electron microscopic study. Science. 1981;213:915–918. doi: 10.1126/science.7256286. [DOI] [PubMed] [Google Scholar]
- Cragg SJ, Rice ME. DAncing past the DAT at a DA synapse. Trends Neurosci. 2004;27:270–277. doi: 10.1016/j.tins.2004.03.011. [DOI] [PubMed] [Google Scholar]
- DeLong MR. Primate models of movement disorders of basal ganglia origin. Trends Neurosci. 1990;13:281–285. doi: 10.1016/0166-2236(90)90110-v. [DOI] [PubMed] [Google Scholar]
- Descarries L, Watkins KC, Garcia S, Bosler O, Doucet G. Dual character, asynaptic and synaptic, of the dopamine innervation in adult rat neostriatum: a quantitative autoradiographic and immunocytochemical analysis. J Comp Neurol. 1996;375:167–186. doi: 10.1002/(SICI)1096-9861(19961111)375:2<167::AID-CNE1>3.0.CO;2-0. [DOI] [PubMed] [Google Scholar]
- Di Matteo V, Pierucci M, Esposito E, Crescimanno G, Benigno A, Di Giovanni G. Serotonin modulation of the basal ganglia circuitry: therapeutic implication for Parkinson’s disease and other motor disorders. Prog Brain Res. 2008;172:423–463. doi: 10.1016/S0079-6123(08)00921-7. [DOI] [PubMed] [Google Scholar]
- Erro E, Lanciego JL, Gimenez-Amaya JM. Relationships between thalamostriatal neurons and pedunculopontine projections to the thalamus: a neuroanatomical tract-tracing study in the rat. Exp Brain Res. 1999;127:162–170. doi: 10.1007/s002210050786. [DOI] [PubMed] [Google Scholar]
- Fee MS. Oculomotor learning revisited: a model of reinforcement learning in the basal ganglia incorporating an efference copy of motor actions. Front Neural Circuits. 2012;6:38. doi: 10.3389/fncir.2012.00038. [DOI] [PMC free article] [PubMed] [Google Scholar]
- Ferguson SM, Eskenazi D, Ishikawa M, Wanat MJ, Phillips PE, Dong Y, Roth BL, Neumaier JF. Transient neuronal inhibition reveals opposing roles of indirect and direct pathways in sensitization. Nat Neurosci. 2011;14:22–24. doi: 10.1038/nn.2703. [DOI] [PMC free article] [PubMed] [Google Scholar]
- Frank MJ, Seeberger LC, O’Reilly RC. By carrot or by stick: cognitive reinforcement learning in parkinsonism. Science. 2004;306:1940–1943. doi: 10.1126/science.1102941. [DOI] [PubMed] [Google Scholar]
- Fujiyama F, Sohn J, Nakano T, Furuta T, Nakamura KC, Matsuda W, Kaneko T. Exclusive and common targets of neostriatofugal projections of rat striosome neurons: a single neuron-tracing study using a viral vector. Eur J Neurosci. 2011;33:668–677. doi: 10.1111/j.1460-9568.2010.07564.x. [DOI] [PubMed] [Google Scholar]
- Gerfen CR. The neostriatal mosaic: compartmentalization of corticostriatal input and striatonigral output systems. Nature. 1984;311:461–464. doi: 10.1038/311461a0. [DOI] [PubMed] [Google Scholar]
- Gerfen CR. The neostriatal mosaic: striatal patch-matrix organization is related to cortical lamination. Science. 1989;246:385–388. doi: 10.1126/science.2799392. [DOI] [PubMed] [Google Scholar]
- Gerfen CR, Engber TM, Mahan LC, Susel Z, Chase TN, Monsma FJ, Jr, Sibley DR. D1 and D2 dopamine receptor-regulated gene expression of striatonigral and striatopallidal neurons. Science. 1990;250:1429–1432. doi: 10.1126/science.2147780. [DOI] [PubMed] [Google Scholar]
- Goldman PS, Nauta WJ. An intricately patterned prefronto-caudate projection in the rhesus monkey. J Comp Neurol. 1977;72:369–386. doi: 10.1002/cne.901710305. [DOI] [PubMed] [Google Scholar]
- Gong S, Doughty M, Harbaugh CR, Cummins A, Hatten ME, Heintz N, Gerfen CR. Targeting Cre recombinase to specific neuron populations with bacterial artificial chromosome constructs. J Neurosci. 2007;27:9817–9823. doi: 10.1523/JNEUROSCI.2707-07.2007. [DOI] [PMC free article] [PubMed] [Google Scholar]
- Graybiel AM. Building action repertoires: memory and learning functions of the basal ganglia. Curr Opin Neurobiol. 1995;5:733–741. doi: 10.1016/0959-4388(95)80100-6. [DOI] [PubMed] [Google Scholar]
- Graybiel AM, Ragsdale CW., Jr Fiber connections of the basal ganglia. Prog Brain Res. 1979;51:237–283. [PubMed] [Google Scholar]
- Groves PM, Linder JC, Young SJ. 5-hydroxydopamine-labeled dopaminergic axons: three-dimensional reconstructions of axons, synapses and postsynaptic targets in rat neostriatum. Neuroscience. 1994;58:593–604. doi: 10.1016/0306-4522(94)90084-1. [DOI] [PubMed] [Google Scholar]
- Hanley JJ, Bolam JP. Synaptology of the nigrostriatal projection in relation to the compartmental organization of the neostriatum in the rat. Neuroscience. 1997;81:353–370. doi: 10.1016/s0306-4522(97)00212-1. [DOI] [PubMed] [Google Scholar]
- Haubensak W, Kunwar PS, Cai H, Ciocchi S, Wall NR, Ponnusamy R, Biag J, Dong HW, Deisseroth K, Callaway EM, et al. Genetic dissection of an amygdala microcircuit that gates conditioned fear. Nature. 2010;468:270–276. doi: 10.1038/nature09553. [DOI] [PMC free article] [PubMed] [Google Scholar]
- Hikida T, Kimura K, Wada N, Funabiki K, Nakanishi S. Distinct roles of synaptic transmission in direct and indirect striatal pathways to reward and aversive behavior. Neuron. 2010;66:896–907. doi: 10.1016/j.neuron.2010.05.011. [DOI] [PubMed] [Google Scholar]
- Hikosaka O, Takikawa Y, Kawagoe R. Role of the basal ganglia in the control of purposive saccadic eye movements. Physiol Rev. 2000;80:953–978. doi: 10.1152/physrev.2000.80.3.953. [DOI] [PubMed] [Google Scholar]
- Jimenez-Castellanos J, Graybiel AM. Subdivisions of the dopamine-containing A8-A9-A10 complex identified by their differential mesostriatal innervation of striosomes and extrastriosomal matrix. Neuroscience. 1987;23:223–242. doi: 10.1016/0306-4522(87)90285-5. [DOI] [PubMed] [Google Scholar]
- Kawaguchi Y, Wilson CJ, Emson PC. Projection subtypes of rat neostriatal matrix cells revealed by intracellular injection of biocytin. J Neurosci. 1990;10:3421–3438. doi: 10.1523/JNEUROSCI.10-10-03421.1990. [DOI] [PMC free article] [PubMed] [Google Scholar]
- Kelley AE, Domesick VB, Nauta WJ. The amygdalostriatal projection in the rat--an anatomical study by anterograde and retrograde tracing methods. Neuroscience. 1982;7:615–630. doi: 10.1016/0306-4522(82)90067-7. [DOI] [PubMed] [Google Scholar]
- Kincaid AE, Wilson CJ. Corticostriatal innervation of the patch and matrix in the rat neostriatum. J Comp Neurol. 1996;374:578–592. doi: 10.1002/(SICI)1096-9861(19961028)374:4<578::AID-CNE7>3.0.CO;2-Z. [DOI] [PubMed] [Google Scholar]
- Kiritani T, Wickersham IR, Seung HS, Shepherd GM. Hierarchical connectivity and connection-specific dynamics in the corticospinal-corticostriatal microcircuit in mouse motor cortex. J Neurosci. 2012;32:4992–5001. doi: 10.1523/JNEUROSCI.4759-11.2012. [DOI] [PMC free article] [PubMed] [Google Scholar]
- Kravitz AV, Freeze BS, Parker PR, Kay K, Thwin MT, Deisseroth K, Kreitzer AC. Regulation of parkinsonian motor behaviours by optogenetic control of basal ganglia circuitry. Nature. 2010;466:622–626. doi: 10.1038/nature09159. [DOI] [PMC free article] [PubMed] [Google Scholar]
- Kravitz AV, Tye LD, Kreitzer AC. Distinct roles for direct and indirect pathway striatal neurons in reinforcement. Nat Neurosci. 2012;15:816–818. doi: 10.1038/nn.3100. [DOI] [PMC free article] [PubMed] [Google Scholar]
- Kunzle H. Bilateral projections from precentral motor cortex to the putamen and other parts of the basal ganglia. An autoradiographic study in Macaca fascicularis. Brain Res. 1975;88:195–209. doi: 10.1016/0006-8993(75)90384-4. [DOI] [PubMed] [Google Scholar]
- Le Moine C, Normand E, Guitteny AF, Fouque B, Teoule R, Bloch B. Dopamine receptor gene expression by enkephalin neurons in rat forebrain. Proc Natl Acad Sci U S A. 1990;87:230–234. doi: 10.1073/pnas.87.1.230. [DOI] [PMC free article] [PubMed] [Google Scholar]
- Lei W, Jiao Y, Del Mar N, Reiner A. Evidence for differential cortical input to direct pathway versus indirect pathway striatal projection neurons in rats. J Neurosci. 2004;24:8289–8299. doi: 10.1523/JNEUROSCI.1990-04.2004. [DOI] [PMC free article] [PubMed] [Google Scholar]
- Liles SL, Updyke BV. Projection of the digit and wrist area of precentral gyrus to the putamen: relation between topography and physiological properties of neurons in the putamen. Brain Res. 1985;339:245–255. doi: 10.1016/0006-8993(85)90089-7. [DOI] [PubMed] [Google Scholar]
- Lobo MK, Covington HE, 3rd, Chaudhury D, Friedman AK, Sun H, Damez-Werno D, Dietz DM, Zaman S, Koo JW, Kennedy PJ, et al. Cell type-specific loss of BDNF signaling mimics optogenetic control of cocaine reward. Science. 2010;330:385–390. doi: 10.1126/science.1188472. [DOI] [PMC free article] [PubMed] [Google Scholar]
- McDonald AJ. Organization of amygdaloid projections to the prefrontal cortex and associated striatum in the rat. Neuroscience. 1991;44:1–14. doi: 10.1016/0306-4522(91)90247-l. [DOI] [PubMed] [Google Scholar]
- McGeorge AJ, Faull RL. The organization and collateralization of corticostriate neurones in the motor and sensory cortex of the rat brain. Brain Res. 1987;423:318–324. doi: 10.1016/0006-8993(87)90855-9. [DOI] [PubMed] [Google Scholar]
- McGeorge AJ, Faull RL. The organization of the projection from the cerebral cortex to the striatum in the rat. Neuroscience. 1989;29:503–537. doi: 10.1016/0306-4522(89)90128-0. [DOI] [PubMed] [Google Scholar]
- Mink JW. The basal ganglia: focused selection and inhibition of competing motor programs. Prog Neurobiol. 1996;50:381–425. doi: 10.1016/s0301-0082(96)00042-1. [DOI] [PubMed] [Google Scholar]
- Nakano K, Hasegawa Y, Tokushige A, Nakagawa S, Kayahara T, Mizuno N. Topographical projections from the thalamus, subthalamic nucleus and pedunculopontine tegmental nucleus to the striatum in the Japanese monkey, Macaca fuscata. Brain Res. 1990;537:54–68. doi: 10.1016/0006-8993(90)90339-d. [DOI] [PubMed] [Google Scholar]
- Pan WX, Mao T, Dudman JT. Inputs to the dorsal striatum of the mouse reflect the parallel circuit architecture of the forebrain. Front Neuroanat. 2010;4:147. doi: 10.3389/fnana.2010.00147. [DOI] [PMC free article] [PubMed] [Google Scholar]
- Penny GR, Afsharpour S, Kitai ST. The glutamate decarboxylase-, leucine enkephalin-, methionine enkephalin- and substance P-immunoreactive neurons in the neostriatum of the rat and cat: evidence for partial population overlap. Neuroscience. 1986;17:1011–1045. doi: 10.1016/0306-4522(86)90076-x. [DOI] [PubMed] [Google Scholar]
- Planert H, Szydlowski SN, Hjorth JJ, Grillner S, Silberberg G. Dynamics of synaptic transmission between fast-spiking interneurons and striatal projection neurons of the direct and indirect pathways. J Neurosci. 2010;30:3499–3507. doi: 10.1523/JNEUROSCI.5139-09.2010. [DOI] [PMC free article] [PubMed] [Google Scholar]
- Ragsdale CW, Jr, Graybiel AM. The fronto-striatal projection in the cat and monkey and its relationship to inhomogeneities established by acetylcholinesterase histochemistry. Brain Res. 1981;208:259–266. doi: 10.1016/0006-8993(81)90556-4. [DOI] [PubMed] [Google Scholar]
- Ragsdale CW, Jr, Graybiel AM. Fibers from the basolateral nucleus of the amygdala selectively innervate striosomes in the caudate nucleus of the cat. J Comp Neurol. 1988;269:506–522. doi: 10.1002/cne.902690404. [DOI] [PubMed] [Google Scholar]
- Reiner A, Jiao Y, Del Mar N, Laverghetta AV, Lei WL. Differential morphology of pyramidal tract-type and intratelencephalically projecting-type corticostriatal neurons and their intrastriatal terminals in rats. J Comp Neurol. 2003;457:420–440. doi: 10.1002/cne.10541. [DOI] [PubMed] [Google Scholar]
- Rice ME, Cragg SJ. Dopamine spillover after quantal release: rethinking dopamine transmission in the nigrostriatal pathway. Brain Res Rev. 2008;58:303–313. doi: 10.1016/j.brainresrev.2008.02.004. [DOI] [PMC free article] [PubMed] [Google Scholar]
- Rice ME, Patel JC, Cragg SJ. Dopamine release in the basal ganglia. Neuroscience. 2011;198:112–137. doi: 10.1016/j.neuroscience.2011.08.066. [DOI] [PMC free article] [PubMed] [Google Scholar]
- Richfield EK, Penney JB, Young AB. Anatomical and affinity state comparisons between dopamine D1 and D2 receptors in the rat central nervous system. Neuroscience. 1989;30:767–777. doi: 10.1016/0306-4522(89)90168-1. [DOI] [PubMed] [Google Scholar]
- Saper CB, Loewy AD. Projections of the pedunculopontine tegmental nucleus in the rat: evidence for additional extrapyramidal circuitry. Brain Res. 1982;252:367–372. doi: 10.1016/0006-8993(82)90404-8. [DOI] [PubMed] [Google Scholar]
- Schwab M, Agid Y, Glowinski J, Thoenen H. Retrograde axonal transport of 125I-tetanus toxin as a tool for tracing fiber connections in the central nervous system; connections of the rostral part of the rat neostriatum. Brain Res. 1977;126:211–224. doi: 10.1016/0006-8993(77)90722-3. [DOI] [PubMed] [Google Scholar]
- Smith Y, Bevan MD, Shink E, Bolam JP. Microcircuitry of the direct and indirect pathways of the basal ganglia. Neuroscience. 1998;86:353–387. doi: 10.1016/s0306-4522(98)00004-9. [DOI] [PubMed] [Google Scholar]
- Smith Y, Raju D, Nanda B, Pare JF, Galvan A, Wichmann T. The thalamostriatal systems: anatomical and functional organization in normal and parkinsonian states. Brain Res Bull. 2009;78:60–68. doi: 10.1016/j.brainresbull.2008.08.015. [DOI] [PMC free article] [PubMed] [Google Scholar]
- Sohur US, Padmanabhan HK, Kotchetkov IS, Menezes JR, Macklis JD. Anatomic and Molecular Development of Corticostriatal Projection Neurons in Mice. Cereb Cortex. 2012 doi: 10.1093/cercor/bhs342. [DOI] [PMC free article] [PubMed] [Google Scholar]
- Stuber GD, Sparta DR, Stamatakis AM, van Leeuwen WA, Hardjoprajitno JE, Cho S, Tye KM, Kempadoo KA, Zhang F, Deisseroth K, et al. Excitatory transmission from the amygdala to nucleus accumbens facilitates reward seeking. Nature. 2011;475:377–380. doi: 10.1038/nature10194. [DOI] [PMC free article] [PubMed] [Google Scholar]
- Taverna S, Ilijic E, Surmeier DJ. Recurrent collateral connections of striatal medium spiny neurons are disrupted in models of Parkinson’s disease. J Neurosci. 2008;28:5504–5512. doi: 10.1523/JNEUROSCI.5493-07.2008. [DOI] [PMC free article] [PubMed] [Google Scholar]
- Ugolini G. Advances in viral transneuronal tracing. J Neurosci Methods. 2010;194:2–20. doi: 10.1016/j.jneumeth.2009.12.001. [DOI] [PubMed] [Google Scholar]
- Vertes RP. A PHA-L analysis of ascending projections of the dorsal raphe nucleus in the rat. J Comp Neurol. 1991;313:643–668. doi: 10.1002/cne.903130409. [DOI] [PubMed] [Google Scholar]
- Wall NR, Wickersham IR, Cetin A, De La Parra M, Callaway EM. Monosynaptic circuit tracing in vivo through Cre-dependent targeting and complementation of modified rabies virus. Proc Natl Acad Sci U S A. 2010;107:21848–21853. doi: 10.1073/pnas.1011756107. [DOI] [PMC free article] [PubMed] [Google Scholar]
- Wickersham IR, Sullivan HA, Seung HS. Production of glycoprotein-deleted rabies viruses for monosynaptic tracing and high-level gene expression in neurons. Nat Protoc. 2010;5:595–606. doi: 10.1038/nprot.2009.248. [DOI] [PubMed] [Google Scholar]
Associated Data
This section collects any data citations, data availability statements, or supplementary materials included in this article.