

Abstract
We implemented pseudo-continuous ASL (pCASL) with 2D and 3D balanced steady state free precession (bSSFP) readout for mapping blood flow in the human brain, retina, and kidney, free of distortion and signal dropout, which are typically observed in the most commonly used echo-planar imaging acquisition. High resolution functional brain imaging in the human visual cortex was feasible with 3D bSSFP pCASL. Blood flow of the human retina could be imaged with pCASL and bSSFP in conjunction with a phase cycling approach to suppress the banding artifacts associated with bSSFP. Furthermore, bSSFP based pCASL enabled us to map renal blood flow within a single breath hold. Control and test-retest experiments suggested that the measured blood flow values in retina and kidney were reliable. Because there is no specific imaging tool for mapping human retina blood flow and the standard contrast agent technique for mapping renal blood flow can cause problems for patients with kidney dysfunction, bSSFP based pCASL may provide a useful tool for the diagnosis of retinal and renal diseases and can complement existing imaging techniques.
Keywords: blood flow, arterial spin labeling, pseudo-continuous arterial spin labeling, balanced steady state free precession, fMRI, retina, kidney
Introduction
Arterial spin labeling (ASL) is a well-established magnetic resonance imaging (MRI) technique for blood flow mapping. Typically ASL is performed by subtraction of two sets of images acquired with and without inversion of arterial blood water and thus requires no exogenous radioactive tracer or contrast agent. Depending on the labeling scheme, ASL can be classified into two main categories of pulsed ASL (PASL) (1–5) and continuous ASL (CASL) (6–9). It is known that CASL provides higher signal to noise ratio (SNR) than PASL, but often CASL is not available on commercial MRI scanners because of the requirement of long and continuous RF transmission. More recently, a new ASL technique termed pseudo-continuous ASL (pCASL) was introduced by dividing the long continuous RF pulse in CASL into multiple discrete short RF pulses, which can achieve similar labeling effects as CASL (10–12). This pCASL technique has been proved to offer improved SNR compared to that of CASL and matches the hardware setup of clinical scanners.
While the labeling scheme has been improved in ASL, various data readout schemes also have been attempted. The most commonly used readout scheme in ASL is echo planar imaging (EPI) because of its high imaging speed. However, EPI suffers from signal drop-out and distortions due to susceptibility effects, and thus is not appropriate for blood flow mapping in regions with high susceptibility artifacts such as retina and body organs. Non-EPI based ASL readout approaches including RARE (13) and GRASE (14) acquisitions have been used to minimize susceptibility artifacts (15), at the cost of lower temporal resolution, blurring or lower SNR per unit time. Balanced steady state free precession (bSSFP) readout overcomes these limitations while maintaining relatively high temporal resolution and SNR per unit time (16,17). The pulse sequence diagram for 2D bSSFP is shown in Fig. 1A. As shown here, the summation of the gradient area along each of the three axes is zero within one repetition interval. Under the assumption of uniform magnetic field, therefore, high MR signals can be generated by applying RF excitations at alternating phase angles of 0° and 180° to flip the magnetization back and forth with minimum possible repetition time (TR), which does not require recovery of the longitudinal magnetization and thus allow for fast data acquisitions and high imaging efficiency. To date, ASL measurements using bSSFP remains underexplored. In some studies, bSSFP readout scheme was attempted for PASL in the body (16) and brain (17), but the feasibility and performance of bSSFP for ASL has not been systematically evaluated.
FIG. 1.

A. the pulse sequence diagram of balanced steady state free precession (bSSFP). B. Results for computer simulations of perfusion signal changes as a function of phase-encoding step.
In this study, we implemented pCASL with both 2D and 3D bSSFP readout for distortion-free cerebral blood flow (CBF) imaging with high spatial resolution and tested pCASL-bSSFP in two challenging organs of retina and kidney, in addition to brain. A disadvantage of the 2D bSSFP is that it is limited to a single slice. Multiple slice acquisition with bSSFP will increase the total acquisition time proportionally, which is impractical, and thus we implemented 3D bSSFP acquisition instead. First, we applied pCASL with 2D and 3D bSSFP readout to brain imaging and the results were compared with conventional EPI based pCASL in the same subjects. PCASL with 3D bSSFP readout was tested for functional MRI in human visual cortex.
Second, pCASL with 2D bSSFP readout was applied for mapping blood flow in the human retina. The retina is only 276 micron thick including the choroid (18), but has one of the highest blood flow per unit weight based on destructive microsphere studies (19). Abnormal blood flow in the retina has been implicated in many retinal diseases, including diabetic retinopathy, glaucoma, and retinal ischemia. With the exception of anatomical optical coherence tomography, optical imaging techniques are limited to probing the retinal surface. Imaging blood flow of the retina is however challenging because the retina is very thin, is located in a region of high magnetic susceptibility, and is susceptible to eye motion. Blood flow imaging of the human retinas using MRI has been reported by using single shot fast spin echo (20–23). In this study, we used bSSFP readout to map human retina blood flow. Since banding artifacts are one of the major limitations of bSSFP, we also demonstrated the feasibility of a multiple phase cycling approach for the suppression of banding artifacts in bSSFP based pCASL imaging. Experiments were designed to confirm that the measured blood flow signals in the retina are reliable and not the results of motion or bSSFP banding artifacts.
Third, pCASL with 2D bSSFP readout was applied for mapping renal blood flow. Assessment of renal perfusion is important for the diagnosis of kidney diseases. Renal perfusion has been mostly assessed with contrast agent based MRI methods. Recent studies showed that the contrast agent used for perfusion measurements may cause nephrogenic systemic fibrosis in patients with kidney dysfunction hence cannot be used for patients suspicious of severe kidney dysfunctions (24). Therefore, ASL is potentially a valuable tool for the evaluation of renal blood flow (16,25–28). Previous studies have mainly focused on the reduction of motion artifacts for blood flow mapping in kidney by combinations of background suppression and breathing strategies, by retrospective sorting of images during free breathing, or by multiple breath-hold scans (29). In this study, it is demonstrated that blood flow in kidney can be mapped within a single breath hold with the combination of pCASL and bSSFP readout and that the results are reproducible.
Materials and Methods
All experiments were performed on a 3T whole body scanner (Siemens Medical Solutions, Erlangen, Germany). The study protocol was approved by local ethics committee. In brain and low-resolution retina imaging, a body coil and a 12-element head matrix coil were used for transmission and reception, respectively. In high-resolution retina imaging, the receiver coil (12-element head matrix coil) was replaced with a circular surface coil (11 cm inner diameter) in combination with a special plastic frame to fix the coil near one of the subject eyes. PCASL (10,11) was implemented with 2D and 3D bSSFP acquisition. PCASL parameters were: RF pulse shape = hanning window, RF duration = 0.5 ms, flip angle = 25°, and spacing between two RF pulses = 0.92 ms, slice-selective gradient = 6 mT/m, tagging duration = 1500 ms, post-labeling delay = 1000 ms, distance between the labeling plane and the center of the imaging group = 8 cm (unless specified otherwise), and balanced tagging scheme (10).
For brain imaging (N = 2), the 2D bSSFP parameters were: TR/TE = 4.0/2.0 ms, flip angle = 40°, bandwidth = 600 Hz/pixel, one 5-mm slice, matrix = 128×64, FOV = 240 × 180 mm2, phase cycling angle = 180°, and centric or linear phase-encoding order. For each image, dummy phase-encoding lines for the centric and linear acquisitions were 20 and 10, respectively. The 3D bSSFP parameters were: matrix = 128×96×8, FOV = 240×180×40 mm2, slice oversampling = 25%, acceleration factor for parallel imaging = 2; centric phase-encoding order, dummy phase-encoding lines = 40, partial Fourier acquisitions along 1st and 2nd PE dimensions = 5/8 and 6/8, respectively. Other parameters were similar to the 2D imaging. For EPI, single- and multi-slice perfusion maps were acquired in the similar scan parameters to 2D and 3D bSSFP, except flip angle = 90° and TR/TE = 4000 / 30 ms. The perfusion image was derived from pair-wise subtraction of non-tag and tag images. The temporal resolution was 8 s per pair. The total acquisition time was about 2 min (14 pairs) for single-slice EPI and 2D bSSFP. The total acquisition time was 4 min (28 pairs) for multi-slice EPI and 3D bSSFP. For functional MRI in the visual cortex, the same 3D bSSFP parameters were used, except matrix = 128×96×4, FOV = 240×180×20 mm2, and slice oversampling = 50%. To reduce temporal fluctuations for the fMRI study, the aforementioned pCASL scheme was combined with background suppression inversion recovery (IR) RF pulses: one slab selective and one non-selective IR pulses were respectively placed before and after the pCASL labeling, and a third IR pulse was applied 0.8 sec after the non-selective IR (0.2 sec before the bSSFP readout). The fMRI study was composed of 5 epochs (off–on–off–on–off) and each epoch took 1 min. Flashing checkerboard was applied as the visual stimulation.
For retina imaging (N = 2), bSSFP parameters were: TR/TE = 4.6/2.3 ms, bandwidth = 500 Hz/pixel, matrix size = 128×86, and FOV = 150×150 mm2. The perfusion image was derived from 32 averages (2.3 min) of label and control acquisitions. Other imaging parameters were identical to those of 2D bSSFP for brain imaging as mentioned above. The same parameters were used for high spatial-resolution retinal blood flow mapping with the circular surface coil, except FOV = 100×100 mm2.
To examine whether the retina blood flow signal from the aforementioned labeling condition (Label On 1) was real rather than from motion artifact, we obtained blood flow image without tagging power (Label Off 1). These acquisition procedures were repeated once (Label On 2 and Label Off 2), for confirmation of the signal source. To examine the effects of banding artifacts, another perfusion map was acquired with the combination of four different phase cycling angles (0°, 90°, 180°, and 270°) each with 8 repetitions (Label On (mPC)). For suppression of the banding artifacts, the datasets from the 4 phase cycling angles were combined with the nonlinear averaging reconstruction method (30), in which the three highest signals among the four phase cycling datasets were averaged for each imaging pixel (the lowest signal was assumed to be from banding regions).
For kidney imaging (N = 1), bSSFP parameters were: TR/TE = 3.6/1.8 ms, matrix size = 128×96, and corresponding FOV = 350×262 mm2. The temporal resolution was 6 s per pair. Blood flow image was derived with 4 averages (scan time = ~25 sec). The scan was performed within a single breath hold. The blood flow imaging with a single breath hold was repeated four times, to examine the reproducibility of the method. These scans were performed along axial and sagittal directions and the direction of the labeling plane was copied from the scan direction. For the sagittal imaging, the distance between the labeling and imaging planes was adjusted to 6 cm, to place the labeling plane on the incoming artery. Other imaging parameters were similar to the 2D bSSFP in brain imaging. For the quantitative mapping of renal blood flow, the standard CASL model was adopted as described in Eq. 1 of Robson et al (29). The parameters used for the quantification were: λ=90 ml/100g, T1′ ≈ T1=1.19 s (31), T1,blood=1.55 s, α =0.8, Δt=0.75 s, t=2.5 s, and τ =1.5 s. To gain insight into the evolution of labeled blood spins (reduction in perfusion contrast) with phase-encoding steps in bSSFP imaging, numerical simulations were performed based on Bloch equations (32), using scan parameters of TR/TE = 4.0/2.0 ms, phase cycling angle = 180°, and T1 and T2 of blood = 1.55 s and 0.250 s (11), and frequency offset = 0 Hz.
Results
The labeled perfusion signal decreased as a function of phase-encoding step, based on the simulation results. When the number of phase-encoding steps was 50, 100, 150, 200, the perfusion signal were, respectively, 83%, 70%, 59%, and 50% of the initial signal strength, under the scan conditions described for the simulations. Considering the number of dummy phase-encoding steps and the number of phase-encoding steps from start to the K-space center (< 50), the signal reduction would be less than 20% of the initial signal under our experimental conditions.
CBF image obtained by EPI (Fig. 2A) showed distortion and signal degradation as indicated by arrows, whereas CBF images obtained by bSSFP (Fig. 2B and C) were free of distortion. When centric phase encoding order was used, bSSFP CBF image showed signal asymmetry in some datasets (arrowhead in Fig. 2B). When linear-phase encoding order was used, bSSFP CBF image was uniform consistently (Fig. 2C). Percent signal changes (PSC, ΔS/S) in gray matter regions of bSSFP were less than that of EPI, due to the multiple RF excitations in bSSFP. However, baseline SNR of bSSFP was about 30% higher than that of EPI, partly compensating for the lower PSC.
FIG. 2.
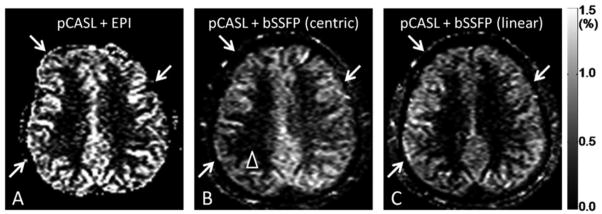
CBF images acquired with pseudo-continuous arterial spin labeling (pCASL) combined with echo planar imaging (EPI) readout (A) and balanced steady state free precession (bSSFP) readout with centric (B) and linear (C) phase-encoding orders.
Figure 3 shows the comparison of CBF images by 3D bSSFP and multislice EPI. CBF by 3D bSSFP yielded no image distortion or signal dropout compared to EPI. Importantly, all CBF images in 3D bSSFP acquisition had a single post-labeling delay, which allowed true whole-brain CBF imaging. However, 3D bSSFP showed blurring compared to 2D bSSFP.
FIG. 3.
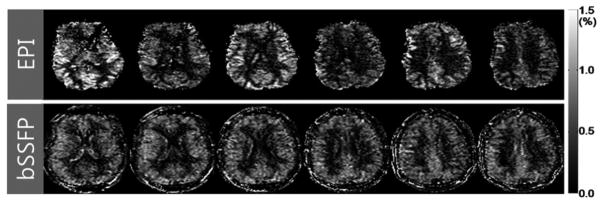
Cerebral blood flow (CBF) images acquired with combination of pseudo-continuous arterial spin labeling (pCASL) and multi-slice echo planar imaging (EPI) (top row) and with combination of pCASL and 3D balanced steady state free precession (bSSFP) (bottom row).
The CBF imaging with 3D bSSFP was tested for functional brain imaging. Figure 4 shows the fMRI activation (t-map) overlaid on the baseline perfusion-weighted subtraction images across four slices. The results showed that visual-evoked functional CBF changes could be mapped in high spatial resolution with pCASL-bSSFP.
FIG. 4.
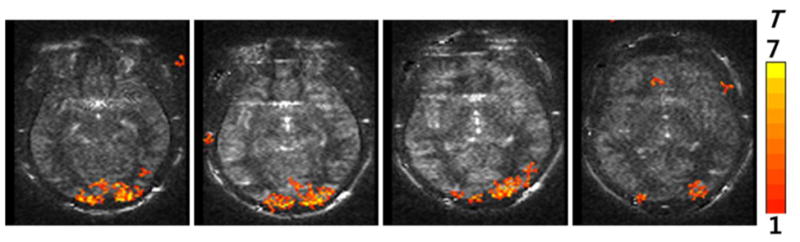
Functional MRI maps in the human visual cortex acquired with combination of pCASL and 3D bSSFP with background suppression. All the four slices along the slab-selection direction are displayed. The thickness for each image was 5 mm.
Figure 5 shows bSSFP image without (A) and with (B) multiple phase cycling angles. Without phase cycling, banding artifacts were observed. These banding artifacts were diminished by combining data from multiple phase cycling angles.
FIG. 5.
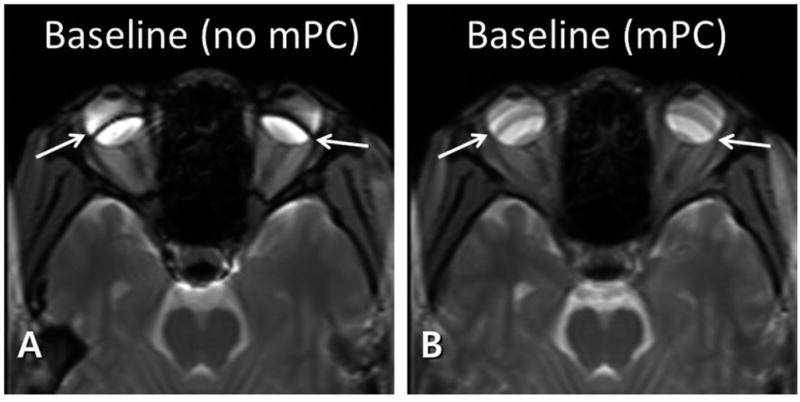
Baseline balanced steady state free precession (bSSFP) images without (A) and with (B) multiple phase cycling angles. The banding artifacts (arrows in A) are significantly reduced with multiple phase cycling angles (arrows in B).
Figure 6 shows the subtraction images with (A,C) and without (B,D) labeling power. When pCASL labeling power was on, there was clear perfusion contrast along the retina (arrowheads in A and C), whereas no discernible perfusion signal in the retina was detected when the labeling power was off (arrowheads in B and D). These results were reproducible for the repeated trials (Fig. 6A–D). The banding artifacts in the perfusion images (arrows in Fig. 6A and C) were also diminished by using multiple phase cycling angles (arrows in Fig. 6E). Note that Figs. 5 and 6 were from the conventional head coil. The circular surface coil enabled acquisition of perfusion signals in higher spatial resolution (Fig. 7). PSC of perfusion signal from the entire retina was 2.1±0.4%, about twice higher than brain perfusion signals.
FIG. 6.
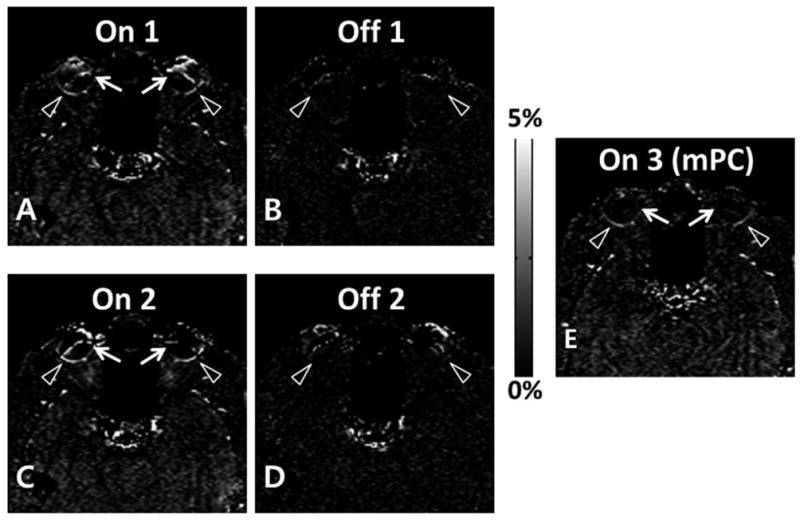
Percent signal change maps with (A, C, E) and without (B, D) labeling RF power for combination of pseudo-continuous arterial spin labeling (pCASL) and 2D balanced steady state free precession (bSSFP). Retinal perfusion signals (arrowheads in A and C) disappeared when labeling RF power was off (arrowheads in B and D). E. Percent signal change map acquired with combination of datasets from multiple phase cycling angles. The artifactual perfusion signal around the banding artifacts (arrows in A and C) disappeared by using the multiple phase cycling approach (arrows in E).
FIG. 7.
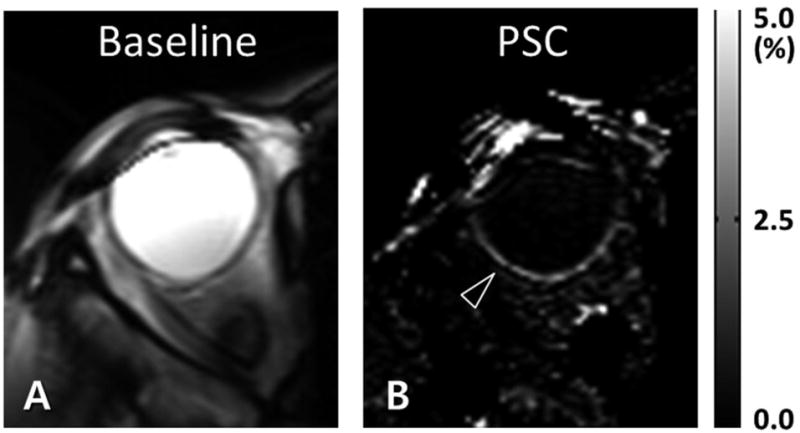
High spatial resolution retinal blood flow imaging with circular surface coil reception. Data were acquired with combination of pseudo-continuous arterial spin labeling (pCASL) and 2D balanced steady state free precession (bSSFP). The baseline (A) and percent signal change (B) images are displayed. The inplane spatial resolution was 0.76 × 1.16 mm2. The arrowhead in B indicates the blood flow signal in the retina.
When pCASL with 2D bSSFP was applied to kidney, strong renal blood flow signals were observed for both axial (Fig. 8) and sagittal (Fig. 9) scans. The PSC values were about 4%, stronger than brain (~1%) or retina (~2%). Note the differences in scale in the PSC images of Figs. 8 and 9. These single breath hold scans along axial and sagittal directions were reproducible for the repeated trials (Figs. 8A–D and 9A–D). The enlarged images (Figs. 8E and 9G) clearly showed the differences in blood flow between cortex and medulla of the kidney. When the labeling plane was placed in a distal region with no major artery, the blood flow signals in kidney were significantly reduced, confirming the sources of the blood flow signals (Fig. 9F). The quantitative blood flow values in the renal cortex were about 320 ml/100g/min, in agreement with other renal perfusion studies with ASL (25,26,29).
FIG. 8.
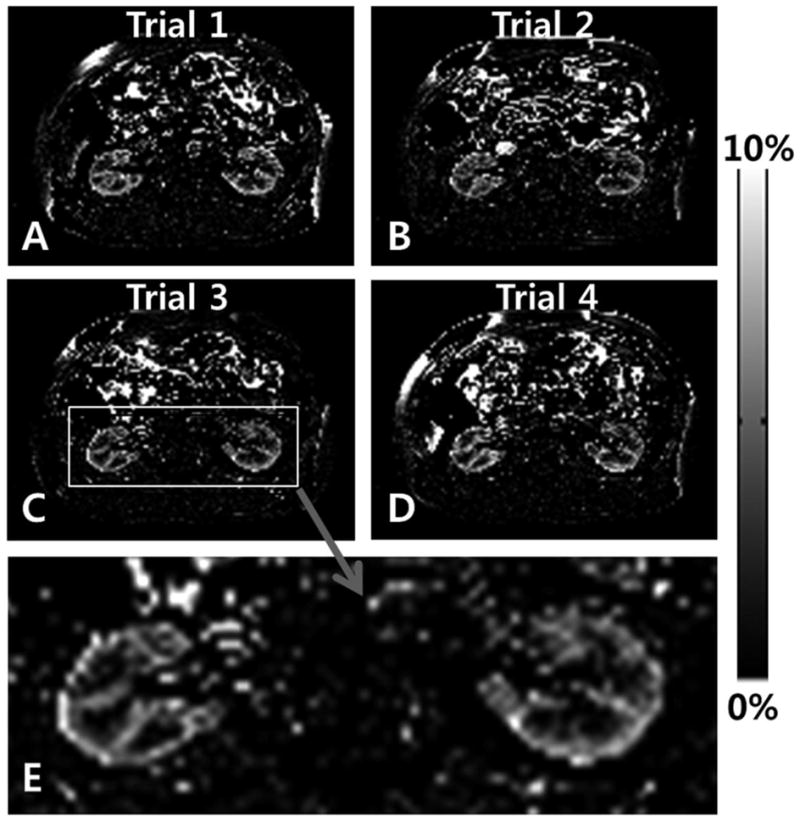
Axial renal blood flow images acquired with combination of pseudo-continuous arterial spin labeling (pCASL) and 2D balanced steady state free precession (bSSFP). The labeling plane was along the axial direction and 8 cm off of the imaging plane. Each dataset was acquired within a single breath hold. The same scan was repeated 4 times (trials 1, 2, 3, and 4) and the bottom image is an enlarged image of the image from the third trial.
FIG. 9.

Sagittal renal blood flow images acquired with combination of pseudo-continuous arterial spin labeling (pCASL) and 2D balanced steady state free precession (bSSFP). The labeling plane was also along the sagittal direction and 6 cm off of the imaging plane. Each dataset was acquired within a single breath hold. The same scan was repeated 4 times (trials 1, 2, 3, and 4, A–D). The baseline image from the trial 1 (E) and the blood flow image with the distal labeling (F) and the enlarged image from the fourth trial (G) are displayed in the bottom row.
Discussion
This study demonstrated combined pCASL and bSSFP readout to obtain reliable blood flow images in human brain, retina, and kidney without distortion and signal drop off that are commonly observed with conventional EPI acquisitions. The blood flow signals in retina and kidney were confirmed to be real and reliable, based on the repeated trials and the control experiments. Because of the application of separate excitation RF pulse for each phase-encoding line, 2D bSSFP showed no discernible T2 or T2* related blurring in the baseline images, which is typically observable in EPI or single-shot FSE. However, 3D bSSFP imaging showed blurring in the perfusion map (Fig. 3), presumably due to T2 relaxation with increased number of RF excitations as shown in Fig. 1 and partial Fourier acquisitions along the first and second PE directions (5/8 and 6/8, respectively). This indicates that number of phase encoding steps in ASL with bSSFP should be balanced between spatial coverage and image blurring.
Potential limitations of pCASL-bSSFP are (i) banding artifacts, (ii) saturation of labeled blood signal with multiple RF excitations, (iii) spatial coverage, and (iv) sensitivity to B0 drift. As demonstrated in this study, the banding artifacts in pCASL-bSSFP can be suppressed by using the multiple phase cycling approach. The perfusion signal reduction with multiple RF excitations may be minimized by using centric phase-encoding order and reduced dummy scans. However, centric phase-encoding order is subject to eddy current contributions as demonstrated by Bieri et al (33) and also demonstrated in this study (Fig. 2B). Special algorithms like pairing (33) and grouping of PE steps (34) can potentially resolve the problems of instability of centric phase-encoding order for bSSFP and they are applicable to pCASL-bSSFP.
Although temporal resolution of bSSFP is much higher than that of the conventional gradient echo imaging sequences, it is lower than EPI, limiting the spatial coverage in pCASL-bSSFP. The spatial coverage of pCASL-bSSFP could be improved by using parallel imaging as shown in this study (Fig. 3), and may be further improved by using compressed sensing algorithms (35,36).
The scan time in this study was relatively short (≤ 4 min), and thus contributions of B0 drifting effects to the perfusion signals are expected to be small. To minimize B0 drifting effects in pCASL-bSSFP with a relatively long scan time, we will need algorithms to compensate for the B 0 drifting effects (37,38).
High-resolution mapping of functional changes in blood perfusion during neuronal activation could be demonstrated in this study (Fig. 4). Systematic comparison of fMRI maps from pCASL-bSSFP, pCASL-EPI, and EPI will be helpful to evaluate the usefulness of fMRI with pCASL-bSSFP. Furthermore, a new blood flow imaging method termed alternate ascending/descending directional navigation (ALADDIN), was recently proposed for mapping blood flow with interslice blood flow effects with no separate preparation pulse (39). Both pCASL-bSSFP and ALADDIN are ASL techniques based on bSSFP imaging and comparison of the two ASL methods would be helpful to understand the signal sources of ALADDIN.
The retina is located in a region of large spatial inhomogeneity and the multiple phase cycling approach successfully reduced banding artifacts in perfusion images. Although multiple phase cycling yields poorer time resolution, it can be used to derive a single optimal phase cycling angle that “move” the banding artifact location away from the region of interest (i.e., retina). Figure 6 shows that the conventional head coil available in most clinical sets can be used to map human retinal blood flow without additional hardware, whereas Fig. 7 shows that the surface coil and the special plastic frame to fix the coil near the human eye of interest should be used together to map human retinal blood flow in higher spatial resolution.
To the best of our knowledge, it is the first study to demonstrate that blood flow in the kidney can be mapped within a single breath hold with the combination of pCASL and bSSFP readout and that the results are reproducible. These factors emphasize the potential usefulness of pCASL-bSSFP and warrant further investigation of pCASL-bSSFP for mapping blood perfusion in various organs.
Conclusion
We successfully implemented pCASL with 2D and 3D bSSFP acquisitions. Balanced SSFP overcomes many of the limitations of EPI. While linear phase-encoding order bSSFP yielded more homogeneous CBF images, centric phase-encoding order bSSFP provided higher perfusion signals but required special algorithms to minimize artifacts from hardware imperfection. Functional brain imaging was also feasible with pCASL-bSSFP. PCASL-bSSFP could be applied for mapping blood flow in retina and kidney and the results were reproducible. A multiple phase cycling approach suppressed the banding artifacts for pCASL-bSSFP in the retina. Renal perfusion could be mapped with pCASL-bSSFP within a single breath hold. Balanced SSFP based pCASL is a promising approach for perfusion imaging of the brain, retina, and kidney that require high spatial resolution with resistance to susceptibility artifacts and should complement existing imaging techniques.
Acknowledgments
This work is supported in part by R01 EY014211, R01 EY018855, and VA MERIT to TQD, by R01 MH080892, R01-EB014922 and R01 NS081077 to DJW, and by KUSTAR-KAIST institute to SHP.
Footnotes
Publisher's Disclaimer: This is a PDF file of an unedited manuscript that has been accepted for publication. As a service to our customers we are providing this early version of the manuscript. The manuscript will undergo copyediting, typesetting, and review of the resulting proof before it is published in its final citable form. Please note that during the production process errors may be discovered which could affect the content, and all legal disclaimers that apply to the journal pertain.
References
- 1.Edelman RR, Siewert B, Darby DG, Thangaraj V, Nobre AC, Mesulam MM, Warach S. Qualitative mapping of cerebral blood flow and functional localization with echo-planar MR imaging and signal targeting with alternating radio frequency. Radiology. 1994;192(2):513–520. doi: 10.1148/radiology.192.2.8029425. [DOI] [PubMed] [Google Scholar]
- 2.Kim SG. Quantification of relative cerebral blood flow change by flow-sensitive alternating inversion recovery (FAIR) technique: application to functional mapping. Magn Reson Med. 1995;34(3):293–301. doi: 10.1002/mrm.1910340303. [DOI] [PubMed] [Google Scholar]
- 3.Kwong KK, Chesler DA, Weisskoff RM, Donahue KM, Davis TL, Ostergaard L, Campbell TA, Rosen BR. MR perfusion studies with T1-weighted echo planar imaging. Magn Reson Med. 1995;34(6):878–887. doi: 10.1002/mrm.1910340613. [DOI] [PubMed] [Google Scholar]
- 4.Wong EC, Buxton RB, Frank LR. Implementation of quantitative perfusion imaging techniques for functional brain mapping using pulsed arterial spin labeling. NMR Biomed. 1997;10(4–5):237–249. doi: 10.1002/(sici)1099-1492(199706/08)10:4/5<237::aid-nbm475>3.0.co;2-x. [DOI] [PubMed] [Google Scholar]
- 5.Golay X, Stuber M, Pruessmann KP, Meier D, Boesiger P. Transfer insensitive labeling technique (TILT): application to multislice functional perfusion imaging. J Magn Reson Imaging. 1999;9(3):454–461. doi: 10.1002/(sici)1522-2586(199903)9:3<454::aid-jmri14>3.0.co;2-b. [DOI] [PubMed] [Google Scholar]
- 6.Williams DS, Detre JA, Leigh JS, Koretsky AP. Magnetic resonance imaging of perfusion using spin inversion of arterial water. Proc Natl Acad Sci U S A. 1992;89(1):212–216. doi: 10.1073/pnas.89.1.212. [DOI] [PMC free article] [PubMed] [Google Scholar]
- 7.Ye FQ, Smith AM, Yang Y, Duyn J, Mattay VS, Ruttimann UE, Frank JA, Weinberger DR, McLaughlin AC. Quantitation of regional cerebral blood flow increases during motor activation: a steady-state arterial spin tagging study. Neuroimage. 1997;6(2):104–112. doi: 10.1006/nimg.1997.0282. [DOI] [PubMed] [Google Scholar]
- 8.Alsop DC, Detre JA. Multisection cerebral blood flow MR imaging with continuous arterial spin labeling. Radiology. 1998;208(2):410–416. doi: 10.1148/radiology.208.2.9680569. [DOI] [PubMed] [Google Scholar]
- 9.Wang J, Zhang Y, Wolf RL, Roc AC, Alsop DC, Detre JA. Amplitude-modulated continuous arterial spin-labeling 3. 0-T perfusion MR imaging with a single coil: feasibility study. Radiology. 2005;235(1):218–228. doi: 10.1148/radiol.2351031663. [DOI] [PubMed] [Google Scholar]
- 10.Wu WC, Fernandez-Seara M, Detre JA, Wehrli FW, Wang J. A theoretical and experimental investigation of the tagging efficiency of pseudocontinuous arterial spin labeling. Magn Reson Med. 2007;58(5):1020–1027. doi: 10.1002/mrm.21403. [DOI] [PubMed] [Google Scholar]
- 11.Dai W, Garcia D, de Bazelaire C, Alsop DC. Continuous flow-driven inversion for arterial spin labeling using pulsed radio frequency and gradient fields. Magn Reson Med. 2008;60(6):1488–1497. doi: 10.1002/mrm.21790. [DOI] [PMC free article] [PubMed] [Google Scholar]
- 12.Wong EC. Vessel-encoded arterial spin-labeling using pseudocontinuous tagging. Magn Reson Med. 2007;58(6):1086–1091. doi: 10.1002/mrm.21293. [DOI] [PubMed] [Google Scholar]
- 13.Alsop DC. Phase insensitive preparation of single-shot RARE: application to diffusion imaging in humans. Magn Reson Med. 1997;38(4):527–533. doi: 10.1002/mrm.1910380404. [DOI] [PubMed] [Google Scholar]
- 14.Feinberg DA, Kiefer B, Johnson G. GRASE improves spatial resolution in single shot imaging. Magn Reson Med. 1995;33(4):529–533. doi: 10.1002/mrm.1910330411. [DOI] [PubMed] [Google Scholar]
- 15.Crelier GR, Hoge RD, Munger P, Pike GB. Perfusion-based functional magnetic resonance imaging with single-shot RARE and GRASE acquisitions. Magn Reson Med. 1999;41(1):132–136. doi: 10.1002/(sici)1522-2594(199901)41:1<132::aid-mrm18>3.0.co;2-5. [DOI] [PubMed] [Google Scholar]
- 16.Martirosian P, Klose U, Mader I, Schick F. FAIR true-FISP perfusion imaging of the kidneys. Magn Reson Med. 2004;51(2):353–361. doi: 10.1002/mrm.10709. [DOI] [PubMed] [Google Scholar]
- 17.Boss A, Martirosian P, Klose U, Nagele T, Claussen CD, Schick F. FAIR-TrueFISP imaging of cerebral perfusion in areas of high magnetic susceptibility differences at 1. 5 and 3 Tesla. J Magn Reson Imaging. 2007;25(5):924–931. doi: 10.1002/jmri.20893. [DOI] [PubMed] [Google Scholar]
- 18.Cheng H, Nair G, Walker TA, Kim MK, Pardue MT, Thule PM, Olson DE, Duong TQ. Structural and functional MRI reveals multiple retinal layers. Proc Natl Acad Sci U S A. 2006;103(46):17525–17530. doi: 10.1073/pnas.0605790103. [DOI] [PMC free article] [PubMed] [Google Scholar]
- 19.Bill A. In: Handbook of physiology Part 2 in Microcirculation. Renkin EM, Michel CC, editors. Vol. 1984. American Physiological Society; Bethesda, MD: 1984. pp. 1001–1035. [Google Scholar]
- 20.Peng Q, Zhang Y, Nateras OS, van Osch MJ, Duong TQ. MRI of blood flow of the human retina. Magn Reson Med. 2011;65(6):1768–1775. doi: 10.1002/mrm.22763. [DOI] [PMC free article] [PubMed] [Google Scholar]
- 21.Maleki N, Dai W, Alsop DC. Blood flow quantification of the human retina with MRI. NMR Biomed. 2011;24(1):104–111. doi: 10.1002/nbm.1564. [DOI] [PubMed] [Google Scholar]
- 22.Zhang Y, San Emeterio Nateras O, Peng Q, Rosende CA, Duong TQ. Blood flow MRI of the human retina/choroid during rest and isometric exercise. Investigative ophthalmology & visual science. 2012;53(7):4299–4305. doi: 10.1167/iovs.11-9384. [DOI] [PMC free article] [PubMed] [Google Scholar]
- 23.Zhang Y, Harrison JM, Nateras OS, Chalfin S, Duong TQ. Decreased retinal-choroidal blood flow in retinitis pigmentosa as measured by MRI. Documenta ophthalmologica Advances in ophthalmology. 2013 doi: 10.1007/s10633-013-9374-1. in press. [DOI] [PMC free article] [PubMed] [Google Scholar]
- 24.Kuo PH, Kanal E, Abu-Alfa AK, Cowper SE. Gadolinium-based MR contrast agents and nephrogenic systemic fibrosis. Radiology. 2007;242(3):647–649. doi: 10.1148/radiol.2423061640. [DOI] [PubMed] [Google Scholar]
- 25.Roberts DA, Detre JA, Bolinger L, Insko EK, Lenkinski RE, Pentecost MJ, Leigh JS., Jr Renal perfusion in humans: MR imaging with spin tagging of arterial water. Radiology. 1995;196(1):281–286. doi: 10.1148/radiology.196.1.7784582. [DOI] [PubMed] [Google Scholar]
- 26.Karger N, Biederer J, Lusse S, Grimm J, Steffens J, Heller M, Gluer C. Quantitation of renal perfusion using arterial spin labeling with FAIR-UFLARE. Magn Reson Imaging. 2000;18(6):641–647. doi: 10.1016/s0730-725x(00)00155-7. [DOI] [PubMed] [Google Scholar]
- 27.De Bazelaire C, Rofsky NM, Duhamel G, Michaelson MD, George D, Alsop DC. Arterial spin labeling blood flow magnetic resonance imaging for the characterization of metastatic renal cell carcinoma(1) Academic radiology. 2005;12(3):347–357. doi: 10.1016/j.acra.2004.12.012. [DOI] [PubMed] [Google Scholar]
- 28.Fenchel M, Martirosian P, Langanke J, Giersch J, Miller S, Stauder NI, Kramer U, Claussen CD, Schick F. Perfusion MR imaging with FAIR true FISP spin labeling in patients with and without renal artery stenosis: initial experience. Radiology. 2006;238(3):1013–1021. doi: 10.1148/radiol.2382041623. [DOI] [PubMed] [Google Scholar]
- 29.Robson PM, Madhuranthakam AJ, Dai W, Pedrosa I, Rofsky NM, Alsop DC. Strategies for reducing respiratory motion artifacts in renal perfusion imaging with arterial spin labeling. Magn Reson Med. 2009;61(6):1374–1387. doi: 10.1002/mrm.21960. [DOI] [PMC free article] [PubMed] [Google Scholar]
- 30.Elliott AM, Bernstein MA, Ward HA, Lane J, Witte RJ. Nonlinear averaging reconstruction method for phase-cycle SSFP. Magn Reson Imaging. 2007;25(3):359–364. doi: 10.1016/j.mri.2006.09.013. [DOI] [PubMed] [Google Scholar]
- 31.Stanisz GJ, Odrobina EE, Pun J, Escaravage M, Graham SJ, Bronskill MJ, Henkelman RM. T1, T2 relaxation and magnetization transfer in tissue at 3T. Magn Reson Med. 2005;54(3):507–512. doi: 10.1002/mrm.20605. [DOI] [PubMed] [Google Scholar]
- 32.Markl M, Alley MT, Elkins CJ, Pelc NJ. Flow effects in balanced steady state free precession imaging. Magn Reson Med. 2003;50(5):892–903. doi: 10.1002/mrm.10631. [DOI] [PubMed] [Google Scholar]
- 33.Bieri O, Markl M, Scheffler K. Analysis and compensation of eddy currents in balanced SSFP. Magn Reson Med. 2005;54(1):129–137. doi: 10.1002/mrm.20527. [DOI] [PubMed] [Google Scholar]
- 34.Nielsen JF, Nayak KS. Interleaved balanced SSFP imaging: artifact reduction using gradient waveform grouping. J Magn Reson Imaging. 2009;29(3):745–750. doi: 10.1002/jmri.21628. [DOI] [PMC free article] [PubMed] [Google Scholar]
- 35.Tsao J, Boesiger P, Pruessmann KP. k-t BLAST and k-t SENSE: dynamic MRI with high frame rate exploiting spatiotemporal correlations. Magn Reson Med. 2003;50(5):1031–1042. doi: 10.1002/mrm.10611. [DOI] [PubMed] [Google Scholar]
- 36.Jung H, Sung K, Nayak KS, Kim EY, Ye JC. k-t FOCUSS: a general compressed sensing framework for high resolution dynamic MRI. Magn Reson Med. 2009;61(1):103–116. doi: 10.1002/mrm.21757. [DOI] [PubMed] [Google Scholar]
- 37.Lee J, Santos JM, Conolly SM, Miller KL, Hargreaves BA, Pauly JM. Respiration-induced B0 field fluctuation compensation in balanced SSFP: real-time approach for transition-band SSFP fMRI. Magn Reson Med. 2006;55(5):1197–1201. doi: 10.1002/mrm.20879. [DOI] [PubMed] [Google Scholar]
- 38.Wu ML, Wu PH, Huang TY, Shih YY, Chou MC, Liu HS, Chung HW, Chen CY. Frequency stabilization using infinite impulse response filtering for SSFP fMRI at 3T. Magn Reson Med. 2007;57(2):369–379. doi: 10.1002/mrm.21138. [DOI] [PubMed] [Google Scholar]
- 39.Park SH, Duong TQ. Brain MR perfusion-weighted imaging with alternate ascending/descending directional navigation. Magn Reson Med. 2011;65(6):1578–1591. doi: 10.1002/mrm.22580. [DOI] [PMC free article] [PubMed] [Google Scholar]