

Abstract
Expansion of regulatory T cells occurs in high-risk myelodysplastic syndrome and correlates with a poor prognosis. DNA methyltransferase inhibitors, particularly 5-azacytidine, have been shown to increase the survival of patients with high-risk myelodysplastic syndrome. It is not entirely clear whether this improvement in patients’ survival is related to the effects of DNA methyltransferase inhibitors on the immune system and/or the direct effect of these drugs on the dysplastic clone. In this study we investigated the effect of 5-azacytidine on the function and proliferation capability of regulatory T cells and T-helper cells. The number and function of CD4+ T-cell subsets in 68 patients with intermediate-2/high-risk myelodysplastic syndrome were serially assessed at diagnosis and following treatment. The in-vitro effects of 5-azacytidine on CD4+ T-cell subsets isolated from both healthy donors and patients with myelodysplastic syndrome were also investigated. The number of peripheral blood regulatory T cells was significantly higher in myelodysplastic syndrome patients than in healthy donors and responders to treatment (P=0.01). The absolute numbers of T-helper 1 and T-helper 2, but not T-helper 17, cells were significantly reduced following 12 months of treatment (P=0.03, P=0.03). The in vitro addition of 5-azacytidine to CD4+ T cells reduced the proliferative capacity of regulatory T cells (P=0.03). In addition, the 5-azacytidine-treated regulatory T cells had reduced suppressive function and produced larger amounts of interleukin-17. The FOXP3 expression in 5-azacyti-dine-treated T-effectors was also increased. Interestingly, these FOXP3+/interleukin-17+ cells originated mainly from effector T cells rather than regulatory T cells. Our data suggest that 5-azacytidine has profound effects on CD4+ T cells, which correlate with disease status after treatment. Furthermore, despite the demethylation of the FOXP3 promoter and increased FOXP3 expression following 5-azacytidine treatment, these phenotypic regulatory T cell-like cells lack the regulatory function and cytokine profile of regulatory T cells. These findings are important in correlating the clinically relevant immunomodulatory effects of 5-azacytidine.
Introduction
5-azacytidine (5-azaC) not only prolongs the survival of patients with intermediate 2 and high-risk myelodysplastic syndrome (MDS),1,2 but also leads to improvements in cytopenias, reduces leukemic progression and improves quality of life.2,3 At lower doses, 5-azaC sequesters and promotes degradation of DNA methyltransferase, inducing DNA hypomethylation, thereby causing re-expression of genes, leading to differentiation and/or apoptosis of the myeloid leukemic cells.4–8 The alternate mechanism of action includes induction of DNA damage,9,10 inhibition of NFκB synthesis11 and enhancement of anti-tumor immune responses.12 There is no definite evidence to suggest a direct link between the induction and magnitude of DNA hypomethylation and the clinical response.13
Although the beneficial role of 5-azaC in MDS treatment is established, the potential effects of 5-azaC on the immune system are unclear. We have previously shown that the number of regulatory T cells (Treg) is significantly increased in high-risk and intermediate-2 MDS, whereas in ‘low-risk’ MDS interleukin (IL)-17-producing CD4+ T cells (Th17 cells) are increased, suggesting a correlation between the number of Treg, Th17 and disease severity.14,15 The expression of forkhead box p3 (FOXP3), the master switch for Treg, has been demonstrated to be epigenetically regulated with complete demethylation of its CpG rich promoter in Treg, whereas in naïve and effector T cells the FOXP3 promoter is methylated.16,17 The effect of 5-azaC on activated CD4+ T cells and induction of ”lupus like” autoimmunity has been shown previously.18 A number of studies have shown that 5-azaC inhibits T-cell proliferation and activation, blocking cell cycle progression in the G0 to G1 phase and decreasing the production of pro-inflammatory cytokines.19–22 Epigenetic modulation strategies such as 5-azaC therapy have also been shown to augment cytotoxic T-cell responses to cancer testes antigens such as melanoma antigen (MAGE), suggesting that immunomodulatory effects contribute to the anti-leukemic activity of 5-azaC.23 The other aspect of immunomodulation in MDS is the immunosuppressive effect of Treg. It has been shown that 5-azaC treatment after bone marrow transplants leads to expansion of Treg, which may alleviate graft-versus-host disease (GVHD).19 The suggestion is that this expansion of Treg is associated with increased FOXP3 expression due to FOXP3 promoter demethylation. Nonetheless, the origin and function of these expanded FOXP3+ T cells is unclear. In order to understand the in-vivo and in-vitro effects of 5-azaC on CD4+ T cells we analyzed serial peripheral blood samples from patients with intermediate-2/high-risk MDS or MDS transformed to acute myeloid leukemia (AML) (20–30% blasts). This included analysis of the number and cytokine profile of T cells prior to and following 5-azaC treatment. We also examined the functional characteristics of peripheral blood Treg and T effector cells from healthy donors and MDS patients, following in-vitro addition of 5-azaC.
Designs and Methods
Patients
Sixty-eight MDS patients (including 12 patients with 20–30% bone marrow blasts in whom AML evolved from MDS) with a median age of 67 years (range, 35–86 years) were treated with 5-azaC subcutaneously at a dose of 75 mg/m2/day for 7 days every 28 days. Patients were risk-classified according to the International Prognostic Scoring System (IPSS) and followed until June 2011 for survival and disease progression. Written informed consent was obtained from all patients and healthy donors in accordance with the Declaration of Helsinki and the study was approved by King’s College Hospital Research Ethics Committee. The median follow up from the start of 5-azaC treatment was 14 months (range, 1–60 months) and patients were treated between 2005–2011. WHO subtypes, and IPSS risk groups of patients are summarized in Online Supplementary Tables S1 and S2.
The median time from diagnosis of MDS to treatment with 5-azaC was 10.1 months (range, 1.4–117 months) and 49 (70%) patients had not received any prior treatment for MDS other than transfusion support. Ten (15%) and nine (13%) patients received induction chemotherapy and growth factor treatment, respectively, prior to 5-azaC.
All 68 patients had peripheral blood samples available for analysis prior to commencement of 5-azaC. Additional peripheral blood samples were analyzed at 1, 3, 6, 9, 12, 18 and 24 month time-points while on 5-azaC treatment (on average two samples per patient; range, 1 to 8 samples).
The median number of cycles administered was seven (range, 1–42 cycles). The overall response rate (according to the modified International Working Group response criteria)24 was 52% (n=36), with complete response in 11 patients (15%), partial response in 14 (21%), marrow complete response in 7 (10%) and stable disease with hematologic improvement in 4 (6%) patients. Progression to AML occurred in 26 out of 57 (46%) patients (excluding 12 patients with >20% blasts before starting 5-azaC treatment).
Mononuclear cell separation
Mononuclear cells were separated from peripheral blood by density gradient sedimentation (LSM 1077 Lymphocyte; PAA Laboratories GmbH, Austria). Peripheral blood mononuclear cells (PBMC) were frozen in serum-free cryopreservation medium (CryoMaxx I, PAA Laboratories GmbH, Austria) and stored in liquid nitrogen.
Antibodies, reagents, and flow cytometry
At least 1×10⁶ PBMC were initially labeled for dead cells with the Live/Dead Fixable Near IR kit (Invitrogen, Paisley, UK) and antibodies against surface antigens, anti-CD3 V500, anti-CD4 V450 or PerCPCy5.5, anti-CD25 APC, anti-CD27 FITC, anti-CD127 FITC, anti-CD45RO APC, anti-CD45RA PE, anti-CD62L PE, anti-CD31 FITC, anti-CD56 APC, anti-CD16 PE, anti-CD19 V450 (all from Becton-Dickinson, San Jose, CA, USA), were used.
For Treg staining we used the anti-human FOXP3 PerCPCy5.5 conjugate after fixation and permeabilization according to manufacturer’s instructions (eBioscience, San Diego, CA, USA). A T-helper kit supplemented with anti-human tumor necrosis factor-α (Becton-Dickinson) was used for intracellular cytokine staining. Cells were stimulated for 4 h with phorbol myristate acetate and ionomycin in the presence of brefeldin A.25 The stimulated cells were fixed and permeabilized prior to intracellular staining according to the manufacturer’s instruction. Phosphorylated retinoblastoma protein (RB; phospho-S807/811) and p16INK4A levels in Treg and T-effectors were assesed using an anti-human RB or anti-p16INK4A antibody following fixation and permeabilization with Fix I & II phosphofix buffer (BD-biosciences). Flow cytometry was performed on a FACSCantoII using FACSDiva software (Becton Dickinson). Data were analyzed on FlowJo software (Tree Star, Ashland, OR, USA).
Isolation of regulatory T cells
To obtain CD4+CD25highCD27+ Treg, PBMC were first enriched for CD4+ T cells using a negative isolation kit (Miltenyi-Biotec Ltd., Surrey, UK) and stained with anti-human CD4, CD25 and CD27. Purified Treg, defined as CD3+CD4+CD25highCD27+, were sorted on a FACSAria (Becton-Dickinson) as previously described.26
RNA isolation and quantitative real-time polymerase chain reaction
Total RNA was isolated from Treg and total CD4+ T-cells obtained from healthy donors, using a combination of TriZOL (Invitrogen) to lyse the cells and RNAeasy Mini prep(Qiagen) to purify the RNA.27 The quantity and integrity of RNA were evaluated by measuring the absorbance at 260 nm with a Nanodrop ND8000 (Labtech) and bioanalyzer (Agilent). cDNA was synthesized from 1 μg of RNA using the Vilo cDNA kit (Invitrogen) according to the manufacturer’s protocol. Quantitative polymerase chain reaction (qPCR) primers were designed for specific genes according to the protocol for the Universal Probe Library (Roche). Further details are provided in the Online Supplementary Design and Methods.
Methylation assay
Genomic DNA was prepared from frozen cell pellets using a blood and cell culture DNA mini kit (Qiagen, UK). The genomic DNA (250 ng) was divided into four equal aliquots and digested using an EpiTect Methyl DNA restriction kit (SABiosciences -Qiagen, UK). The digested product was used as a template to quantify the remaining DNA by qPCR, using primers that flank the promoters for the genes of interest. Primer sets used for amplification of human FOXP3, TBX21, GATA3, and STAT3 promoter CpG islands were purchased from SABiosciences (FOXP3, MePH27609-3A; TBX21, MePG22189; GATA3, MePH28286; STAT3, MePH22023). The real-time PCR was performed using the Power Sybr Green Q-PCR Master Mix and the StepOnePlus system (Applied Biosystem, UK).
The data were analyzed as described by Ordway et al.28 and explained in more detail in the Online Supplementary Design and Methods.
Functional assay
To further assess the effects of 5-azaC on peripheral blood lymphocytes we stimulated PBMC from four healthy donors and three patients with high-risk MDS with CD3/CD28 beads (Dynabeads Human T-Activator, Invitrogen, Paisley, UK) at a 1:1 ratio for 48 h to allow the cells to enter the cell cycle and incorporate 5-azaC. After the pre-stimulation, 5-azaC was added every 24 h for up to 96 h at two different concentrations (1 μM and 2 μM as previously described29). At each time point (t0, t+96), cells were stained with CD3, CD4, CD25, CD127 and FOXP3 for Treg and CD3, CD4, IFN-γ, TNF-α, IL-4, IL-17 for T helpers (after an additional 4 h incubation with phorbol myristate acetate/ionomycin).
Functional analysis of regulatory T cells
The suppressive function of Treg on CD4+ effector T cells was determined with a proliferation assay. Further details are provided in the Online Supplementary Design and Methods.
Cytokine measurement
Serum cytokine assays were carried out using a Cytokine 30-plex antibody bead kit (Invitrogen) and data were acquired on a Luminex 200™ (Luminex Corporation, Austin, TX, USA). The level of each cytokine was calculated from a standard curve derived from known controls.
Statistical analysis
Statistical analyses were performed using SPSS version 19.0 (IBM Corporation, USA). The non-paired t-test and Mann-Whitney U test were used to compare parametric and non-parametric data, respectively. For serial samples, a linear mixed model was used. A paired samples t-test was used to compare paired samples treated in-vitro with 5-azaC. P values <0.05 were considered statistically significant.
Results
The in vivo effect of 5-azacytidine on CD4+ T cells
The percentages and absolute numbers of peripheral blood Treg were significantly higher prior to treatment in MDS patients than in healthy, age-matched donors (n=10) (0.7% versus 0.08%, P<0.001 and 1.1×10⁷/L versus 4.6×10⁶/L, P=0.01) (Figure 1A). However, after 9 months of treatment with 5-azaC, the numbers of Treg decreased to normal levels. The percentages and absolute numbers of Treg at diagnosis were also higher in non-responders than in responders (0.6% versus 0.2% of lymphocytes, P=0.01 and 9.6×10⁶/L versus 4.9×10⁶/L, P=0.02) (Figure 1A). Absolute lymphocyte counts at various time points after 5-azaC treatment were not significantly different from the pre-treatment counts.
Figure 1.

The effect of 5-azaC on the number of Treg and T helpers. (A) The absolute numbers of Treg were significantly higher in patients with high-risk MDS compared to healthy-age-matched donors (1.1×10⁷/L versus 4.6×10⁶/L, P=0.01). Although this difference became minimal after 9 months of therapy, the overall linear difference remains statistically significant. There was also a significant difference between 5-azaC responders and non-responders in terms of absolute number of Treg (4.9×10⁶/L versus 9.6×10⁶/L, P=0.02). Interestingly, after 9 months of treatment the numbers of Treg were increased in responders. Triangles represent the total number of Treg in both responders and non-responders. (B-D) Following treatment with 5-azaC the absolute numbers of both Th1 and Th2 cells but not Th17 cells were reduced significantly in both responders and non-responders (9.3×10⁷ to 3.7×10⁷, P=0.03 for Th1 and 2×10⁷ to 9×10⁶, P=0.03 for Th2 cells).
The absolute numbers of Th1 and Th2 cells were significantly reduced following 12 months of treatment with 5-azaC (9.3×10⁷ to 3.7×10⁷, P=0.03 for Th1 and 2×10⁷ to 9×10⁶, P=0.03 for Th2 cells). There was no change in the number of Th17 cells following treatment (Figure 1B-D). The differences in the number of Th1, Th2 and Th17 were not statistically different between responders and non-responders.
To investigate the in-vivo effect of 5-azaC on the frequency of FOXP3+ IL-17+ cells, peripheral blood was collected from four patients at the time of best response (complete response/partial response) and seven non-responders (6 to 12 months after the first cycle of treatment). PBMC were stimulated for 72 h with CD3/CD28 beads without 5-azaC. Stimulated cells were stained for CD3, CD4, CD25, FOXP3 and IL-17. The absolute numbers of the FOXP3+IL17+ population were higher in the responders than in the non-responders (4.1×10⁶versus 3.0×10⁶), although this difference was not statistically significant (P=0.059) (Figure 2).
Figure 2.
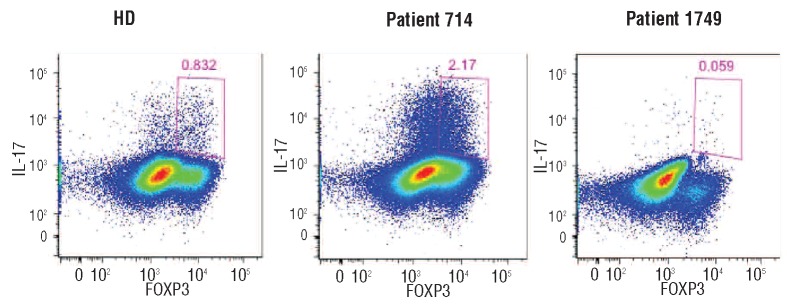
FOXP3+ IL-17+ cells following treatment with 5-azaC. A representive example of stimulated PBMC from a healthy age-matched control (HD), an MDS patient who responded to 5-azaC (714) and a non-responding MDS patient (1974).
In vitro effect of 5-azaC on T-helpers and regulatory T cells
Addition of 5-azaC (2 μM) to Treg from three patients (every 24 h for 96 h) caused a significant reduction in the absolute numbers of Treg (P=0.03). By contrast 5-azaC had little or no effect on the absolute numbers of similarly treated Treg from healthy donors (Figure 3).
Figure 3.

In-vitro effects of 5-azaC on Treg and T helpers. The proliferative capacity of both Treg and T-effectors was assessed following 72 h of stimulation with CD3/CD28 beads in the presence and absence of 5-azaC (2 μM). (A) The Treg from three patients were significantly (P=0.03) reduced in the presence of 5-azaC, compared to the numbers in four healthy donors. (B-C) The proliferation of Th1 cells was significantly reduced following 5-azaC addition to the culture in both patients and healthy donors (P=0.03 and P=0.008, respectively). For Th17, however, this difference was only statistically significant in healthy donors (P=0.002) and not in patients.
Interestingly, the numbers of both Th1 and Th17 cells from healthy donors were significantly reduced following the addition of 5-azaC (P=0.008 and P=0.002, respectively). Similarly, Th1 cells were also reduced in patients following the addition of 5-azaC (P=0.03) (Figure 3). The ratios of Th1/Treg and Th17/Treg were also higher in patients’ PBMC after in vitro addition of 5-azaC.
Effect on cell cycle and apoptosis
A reduction in absolute cell number could be due to an increase in apoptosis and/or a reduction in proliferation. Addition of 5-azaC reduced the percentage of cells in S+G2/M phases of the cell cycle, consistent with an inhibition of proliferation, and increased the percentage of cells with sub-G1 DNA content, consistent with an induction of apoptosis (Figure 4A). Preferential apoptosis did not occur in any of the T-cell subsets, as demonstrated by the percentage of cells with sub-G1 DNA content as well as annexin V staining (data not shown).
Figure 4.

Cell cycle arrest following in-vitro treatment with 5-azaC. (A) The effect of 5-azaC on Treg and T-effector cell cycling was studied by propidium iodide staining following 72 h of stimulation with CD3/CD28 beads. Addition of 5-azaC increased the percentage of apoptotic cells (sub-G DNA staining) and reduced the number of cells in S and G2/M phases of the cell cycle. (B) Following treatment with 5-azaC (2 μM) both Treg and T effectors expressed higher levels of the CDK4/6-cyclin D inhibitor p16INK4A. (D) The methylation status of CpG islands in the promoter of the FOXP3 gene in activated regulatory T cells derived from the cells (CD4+, CD25+, CD127+) was determined by the combination of restriction enzyme digestion of hypermethylated or unmethylated DNA sequences, together with Q-PCR. Cultures from three separate donors were set up with and without 5-azaC treatment for 96 h of stimulation. Error bars represent standard deviations. *P<0.05, **P< 0.01.
The expression of a cell cycle inhibitory protein, p16INK4A, was increased in both T-effectors and Treg following addition of 5-azaC. However, this increase was more marked in Treg (Figure 4A,B). p16INK4A inhibits cyclin-dependent kinases CDK4 and CDK6.30 Consistent with this, the addition of 5-azaC also caused a reduction in phosphorylated RB at the CDK4/6-cyclin D specific sites, S807/811 in both Treg and T-effectors, with more dephosphorylation observed in Treg (Online Supplementary Figure S1).
Effect of 5-azacytidine on promoter methylation status
Sorted Treg from three healthy donors were stimulated for 96 h in the presence or absence of 5-azaC and the methylation status of the promoters of genes encoding the lineage-specific transcription factors GATA3, STAT3, TBET and FOXP3 was assessed. The percentage of intermediate-methylated FOXP3 promoter decreased from 60% to 40% in 5-azaC-treated Treg (P=0.04), whereas the percentage of unmethylated promoter increased from 20% to 40% (P=0.008) (Figure 4C). The reduction in methylation was specific to FOXP3 and did not occur in the promoters of GATA3, STAT3 and TBET.
As expected, the reduction in FOXP3 promoter methylation correlated with increased FOXP3 expression confirmed by flow cytometry (Online Supplementary Figure S2).
We also investigated the expression of STAT1-6, SOCS3, CDKN2A and CDH1 mRNA by qRT-PCR. There was a relative increase in the expression of STAT1, STAT3, SOCS3, CDKN2A and CDH1 mRNA in Treg following stimulation and treatment with 5-azaC, in comparison to the untreated cells (Online Supplementary Figure S3).
Function and cytokine secretion of regulatory T cells following 5-azacytidine treatment
The effects of 5-azaC on Treg function and cytokine secretion were investigated by analyzing FACS-sorted Treg (CD3+CD4+CD25highCD127low) from healthy donors. Following stimulation and addition of 2 μM of 5-azaC every 24 h (for 96 h in total), we briefly re-stimulated Treg with phorbol myristate acetate and ionomycin in the presence of brefeldin A prior to staining, in order to increase the sensitivity of detection of IL-17-secreting cells. The percentage of FOXP3+ cells increased in treated compared with untreated Treg (45.9% versus 21.8%, P=0.002) (repeated on 4 separate occasions). However, 5-azaC-treated FOXP3+ cells secreted a significantly higher level of IL-17 compared to the stimulated, but untreated cells (4.5% versus 0.5%, P=0.02) (Online Supplementary Figure S4).
Although FOXP3 expression and IL-17 secretion were increased in 5-azaC treated cells, it was not clear whether FOXP3+IL-17+ cells originated from Treg or T-effector cells. To address this question, PBMC were collected from HLA-A2+ and HLA-A2− healthy donors (n=2) and the Treg and T-effector cells were sorted as described above. Treg from HLA-A2+ donors were mixed with HLA-A2− T-effectors and vice versa. Following CD3, CD28 stimulation of Treg and T-effector cells in the presence of 5-azaC, both FOXP3 expression and IL-17 secretion were found to increase in the Treg (Figure 5). Interestingly the majority of FOXP3+IL-17+ cells originated from T-effector cells, which were originally FOXP3− at the start of the experiment. The majority of “IL-17+ Treg” had in fact originated from T-effector cells. The T-effector cells expressed lower levels of Tim3 and were, therefore, less exhausted than 5-azaC-untreated T-effector cells (Figure 6A). To investigate the potential similarity between these cells and “Th17-like Treg” (Tr17 cells),31,32 CCR6 expression was measured by flow cytometry. Compared to FOXP3-IL-17− cells, the FOXP3+IL-17+ cells expressed higher levels of CCR6 (Figure 6B).
Figure 5.

Effect of 5-azaC on IL-17 and FOXP3 expression: to investigate the origin of CD3+CD4+CD25highFOXP3+IL-17+cells, Treg from HLA-A2-negative and T-effectors from HLA-A2-positive donors were sorted and mixed in a 1:1 ratio (and vice versa in the right panel). The cells were stimulated with CD3/CD28 beads in the presence or absence of 5-azaC (2 μM). Although 5-azaC-treated Treg secreted higher amounts of IL-17 compared to untreated Treg, the CD3+CD4+CD25highFOXP3+IL-17+cells mainly originated from T-effectors rather than Treg.
Figure 6.

(A) 5-azaC-treated T-effectors expressed lower levels of TIM 3 following stimulation and were less exhausted compared to untreated cells. (B) Following 72 h of stimulation with CD3/CD28 beads in the presence of 5-azaC, CD3+CD4+CD25highFOXP3+IL-17+cells expressed higher levels of CCR6 compared to CD3+CD4+CD25highFOXP3lowIL-17− cells.
Although 5-azaC-treated Treg were able to proliferate, their inhibitory effect on the proliferation of T-effector cells was markedly reduced (Figure 7). The ability of Treg to inhibit cytokine secretion by T-effectors decreased following the addition of 5-azaC. The 5-azaC-treated Treg were unable to suppress the secretion of pro-inflammatory cytokines (IFN-γ, IFN-α, TNF-γα, RANTES, IL-6, IL-7 and IL-17) by T-effectors (Figure 7). Interestingly, co-culture of 5-azaC-treated Treg and T-effectors led to higher levels of IL-17 secretion in comparison with the T effectors alone (Figure 7).
Figure 7.

Functional assay of 5-azaC-treated Treg. (A) Treg and T-effectors were sorted by FACS first and stained with two different proliferation dyes (CFSE for T-effectors and VPD for Treg). 5-azaC-treated Treg were unable to inhibit the proliferation of T effectors compared with untreated Treg. 5-azaC-treated Treg were still proliferating after treatment with 5-azaC despite a reduced inhibitory function. (B) 5-azaC-treated Treg were unable to suppress cytokine secretion by T-effectors compared to untreated Treg. Interestingly co-culture of T-effectors with 5-azaC-treated Treg led to higher IL-17 secretion compared to culture with T-effector alone.
We investigated the effects of 5-azaC on the function of T-effectors, in particular whether the induction of FOXP3 in these cells led to a change in their function. To address this question, T-effectors (CD25low, CD127high) were sorted by FACS and cultured in serum-free medium. After 48 h of stimulation with CD3/CD28 beads, 2 μM 5-azaC were added every 24 h for 96 h. As a control T-effectors were also stimulated in the absence of 5-azaC. After 96 h, another batch of T-effectors from the same donor was sorted, stained with CFSE and co-cultured with either 5-azaC-treated T effectors or untreated T-effectors in a 1:1 ratio and stimulated for another 72 h. 5-azaC-treated T-effectors had no suppressive effect on syngeneic T-effectors (Online Supplementary Figure S5).
Discussion
Treg play a pivotal role in the failure of immune surveillance in cancer, facilitating immune subversion and subsequent disease progression.33,34 The expansion of Treg in high-risk MDS and correlation with the higher risk of progression to AML have been shown in different studies, including our own.15 Patients with high-risk MDS are less likely to respond to immunosuppressive therapy than are patients with low-risk MDS.35 5-azaC induces hematologic responses in up to 56% of MDS patients and a prolongation in survival of nearly 10 months in comparison to the conventional care regimens.2 More recently a number of studies have pointed to important immunoregulatory effects of 5-azaC but the mechanisms that underlie these changes are not fully understood. It has been suggested that 5-azaC may expand Treg and thereby contribute to the management of GVHD after allogeneic bone marrow transplantation.19 However, Goodyear et al. showed that, in post-transplant AML patients, 5-azaC treatment induces CD8+ T-cell responses despite an increase in the number of Treg.36 Choi et al. have also shown an intact graft-versus-leukemia (GVL) effect in transplanted mice following treatment with 5-azaC or decitabine, despite an increase in the number of FOXP3+ T cells.37 Both studies showed an intact GVL effect and cytotoxic T lymphocyte response in spite of a lower risk of GVHD. If the expansion of Treg after 5-azaC treatment were to take place in MDS, then it could facilitate the progression of MDS to AML. In clinical practice, however, high-risk MDS patients benefit from 5-azaC treatment with significant prolongation of survival. For these reasons our study focused on the effects of 5-azaC on CD4+ T-cells, particularly Treg. We examined the immunological mechanisms involved in the therapeutic effects of 5-azaC in MDS.
We recruited 68 patients with intermediate/high-risk MDS to this study and serial peripheral blood samples were tested for CD4+ T-cell subsets. As expected, the numbers of Treg were significantly higher in high-risk patients than in healthy, age-matched donors, whereas the numbers of Th17 cells were significantly reduced. These findings are in agreement with previously published data.14,15 However, our data suggest that the expansion of Treg is associated more often with a lack of response to 5-azaC. This implies that the number of Treg at diagnosis could be used as one of the factors predicting response to 5-azaC treatment. Intriguingly, Treg numbers decreased following continued treatment with 5-azaC despite a brief increase during the first month. Bontkes et al. reported a modest temporary increase in Treg numbers following 5-azaC treatment.38 In our cohort of patients, Treg numbers correlated with response to treatment and, compared to responders, non-responders had a significantly higher number of Treg. Interestingly, after 9 months of treatment, Treg numbers increased in responders, but this finding is difficult to interpret because of the small number of non-responding patients who survived beyond 9 months. These findings raise the question as to whether post-treatment Treg do actually still function as “suppressors”. It was also important to determine whether the standard markers for the definition of Treg are still valid following 5-azaC treatment. We optimized the in-vitro culture conditions and identified the timing and concentration of 5-azaC needed for our in-vitro study. Initially, we compared the effect of 5-azaC on Treg and T-helpers from MDS patients and healthy donors. While 5-azaC appears to inhibit the proliferation of Treg, Th1 and Th17 in both patients and healthy donors, the effects were more pronounced in samples from patients. Treg from healthy donors were less sensitive to 5-azaC than were Treg from MDS patients. Lower activation levels of Tregs from healthy donors, which lead to a longer time to cell cycle entry, may account for this difference. However, this needs further investigation. Although the reduction in Treg numbers may have some beneficial hematologic effects, the concomitant reduction of pro-inflammatory T-helper cells, Th1 and Th17, may be undesirable.
The expression of the cell cycle regulator, p16INK4A was increased in both Treg and T-helpers following addition of 5-azaC. These increases coincided with cell cycle arrest in G1 and reduced phosphorylation of RB on CDK4/CDK6-cyclin D specific sites. Hypo-phosphorylated RB is the active form which suppresses E2F-dependent gene activity and leads to cell cycle arrest.30
These data suggest that 5-azaC reduced the numbers of Treg and T-helper cells by causing cell cycle arrest, mediated in part by inhibition of CDK4/6-cyclin D activity and dephosphorylation of RB. There was also an increase in the percentage of Treg and T-helper cells with sub-G1 DNA content, consistent with an induction of apoptosis.
Next we investigated the function and cytokine secretion of the remaining Treg after 5-azaC treatment. In the presence of 5-azaC, FOXP3 expression increased due to its promoter demethylation. Surprisingly we also noted an increase in IL-17 secretion by the FOXP3+ “Treg”. Co-culture of 5-azaC-treated Treg with autologous T-effectors did not suppress T-effector proliferation (CFSE assay) or cytokine secretion. In fact, co-culture of Treg and T-effectors in the presence of 5-azaC led to secretion of even higher levels of IL-17 compared with the T-effectors cultured in the absence of 5-azaC. Thus, these “Treg” lose their regulatory function following culture in the presence of 5-azaC, even though they retain the surface and intracellular markers of Treg. PBMC from patients who did or did not respond to 5-azaC were then collected and stimulated with CD3/CD28 beads without the addition of 5-azaC and stained for FOXP3 and IL-17. Interestingly, the numbers of FOXP3+ IL-17+ cells were increased in the 5-azaC responders in comparison to the numbers in non-responders and healthy donors. Although these differences were not statistically significant, there was a clear trend towards higher numbers of FOXP3+ IL-17+ cells in the responders.
Since the rediscovery of Treg by Sakaguchi et al.,39 several subsets of Treg have been identified which are immunophenotypically and functionally different. Although not widely accepted yet, the potential plasticity of Treg and their ability to transform into pro-inflammatory Th17 cells is of great interest.40–42 “Th17-like Treg”(Tr17), a recently identified subset of Treg, express low levels of FOXP3 and secrete IL-17 in a ROR-ϒt dependent and non-dependent manner.31 These cells also express higher levels of CCR6. Nonetheless, the Tr17 cells still have a suppressive function.31,32 Although the 5-azaC-treated “Treg” have some similarities with Tr17 cells with regard to phenotype (increased CCR6 expression) and cytokine profile, they lack the suppressive function and their FOXP3 expression remains intact.
Our data confirm that these FOXP3+ IL-17+ cells originate from both Treg as well as T-effectors. 5-azaC appears to convert FOXP3low/− T-effectors to the cells that acquire the phenotypic markers of Treg but lack their inhibitory function and secrete significant levels of IL-17. The recent findings of T-helper-specific Treg and Th17-inducing Treg have significantly changed our understanding of Treg and their function.43,44 Pandiyan et al. recently showed that in an inflammatory environment, Treg could promote Th17 cells rather than converting to Th17 cells. This effect is mediated via IL-2 starvation by Treg, leading to an immune response switch from Th1 to Th17.44 This is in agreement with the findings of another study by Miyao et al. in which there was expansion of T helpers with transient FOXP3 expression in an inflammatory environment; these are not genuine FOXP3+ Treg.45
Our data suggest that despite the lack of an inflammatory environment, 5-azaC can have a similar effect on T-effectors. 5-azaC treatment in MDS not only inhibits the suppressor effect of Treg but also induces (either directly or through modified Treg) a population of T-effectors that express FOXP3 as well as the secretion of IL-17.
These findings are not only important for the understanding of immunomodulatory mechanisms of 5-azaC, but also the clinically observed expansion of Treg following 5-azaC treatment. Sanchez-Abarca et al. reported the expansion of FOXP3+ Treg following 5-azaC treatment in bone marrow transplant recipients.19 Our data suggest that although 5-azaC increases FOXP3 expression, the expanded FOXP3+ cells do not have a regulatory function. Nevertheless, given the important role of IL-17 in the immunesurveillance of cancer, FOXP3+ IL-17+ cells could potentially increase the GVL effect.
These findings are also clinically relevant in adoptive immunotherapy. Immunotherapy by antigen-specific T cells has been tried in MDS and AML.46 However, expansion of Treg and their suppressive effect on immune-mediated responses against malignant cells is a concern in adoptive immunotherapy.46,47 The immune-modulatory effects of 5-azaC identified in the present study could be employed to enhance the therapeutic effects of adoptive immunotherapy. This strategy could potentially convert a cancer-mediated “immunosuppressive” environment into an “immunoactive” environment, boosting antigen-specific cytotoxic T-lymphocyte responses in these patients.
To summarize, we have shown that despite a reduction in the number of Treg following 5-azaC treatment, the remaining cells express increased levels of FOXP3 compared with untreated cells. This leads to conversion of both FOXP3low T-effectors and conventional Treg to “Treg-like” subsets of cells, which are not immunosuppressive and secrete higher levels of IL-17 despite their Treg-like phenotype. The 5-azaC-induced reduction in the number of circulatory Treg may be a result of cell cycle arrest, or increased tissue homing due to increased CCR6 expression. These cells lack a regulatory function and are unable to implement the immunosuppressive role conventionally associated with Treg.
The findings reported here help to improve our understanding of the immunomodulatory effects of 5-azaC in MDS with implications for other diseases in which DNA methyltransferase inhibitor therapies are currently under evaluation.
Acknowledgments
The authors thank all the nurses and clinical fellows of the Hematology Department at King's College Hospital for providing clinical samples and the tissue bank personnel for processing the samples. They also thank Dr Timothy Tree and Dr Linda Barber for their useful comments and suggestions.
Footnotes
The online version of this article has a Supplementary Appendix.
Funding
This work was supported by a program grant from Leukaemia & Lymphoma Research, London, United Kingdom.
Authorship and Disclosures
Information on authorship, contributions, and financial & other disclosures was provided by the authors and is available with the online version of this article at www.haematologica.org.
References
- 1.Fenaux P, Mufti GJ, Hellstrom-Lindberg E, Santini V, Finelli C, Giagounidis A, et al. Efficacy of azacitidine compared with that of conventional care regimens in the treatment of higher-risk myelodysplastic syndromes: a randomised, open-label, phase III study. Lancet Oncol. 2009;10(3):223–32 [DOI] [PMC free article] [PubMed] [Google Scholar]
- 2.Fenaux P, Mufti GJ, Hellstrom-Lindberg E, Santini V, Gattermann N, Germing U, et al. Azacitidine prolongs overall survival compared with conventional care regimens in elderly patients with low bone marrow blast count acute myeloid leukemia. J Clin Oncol. 2010;28(4):562–9 [DOI] [PubMed] [Google Scholar]
- 3.Kornblith AB, Herndon JE, 2nd, Silverman LR, Demakos EP, Odchimar-Reissig R, Holland JF, et al. Impact of azacytidine on the quality of life of patients with myelodysplastic syndrome treated in a randomized phase III trial: a Cancer and Leukemia Group B study. J Clin Oncol. 2002;20(10):2441–52 [DOI] [PubMed] [Google Scholar]
- 4.Leone G, Teofili L, Voso MT, Lubbert M. DNA methylation and demethylating drugs in myelodysplastic syndromes and secondary leukemias. Haematologica. 2002;87(12):1324–41 [PubMed] [Google Scholar]
- 5.Mund C, Brueckner B, Lyko F. Reactivation of epigenetically silenced genes by DNA methyltransferase inhibitors: basic concepts and clinical applications. Epigenetics. 2006;1(1):7–13 [DOI] [PubMed] [Google Scholar]
- 6.Raj K, John A, Ho A, Chronis C, Khan S, Samuel J, et al. CDKN2B methylation status and isolated chromosome 7 abnormalities predict responses to treatment with 5-azacytidine. Leukemia. 2007;21(9):1937–44 [DOI] [PubMed] [Google Scholar]
- 7.Pinto A, Attadia V, Fusco A, Ferrara F, Spada OA, Di Fiore PP. 5-Aza-2′-deoxycytidine induces terminal differentiation of leukemic blasts from patients with acute myeloid leukemias. Blood. 1984;64(4):922–9 [PubMed] [Google Scholar]
- 8.Yang AS, Doshi KD, Choi SW, Mason JB, Mannari RK, Gharybian V, et al. DNA methylation changes after 5-aza-2′-deoxy-cytidine therapy in patients with leukemia. Cancer Res. 2006;66(10):5495–503 [DOI] [PubMed] [Google Scholar]
- 9.Juttermann R, Li E, Jaenisch R. Toxicity of 5-aza-2′-deoxycytidine to mammalian cells is mediated primarily by covalent trapping of DNA methyltransferase rather than DNA demethylation. Proc Natl Acad Sci USA. 1994;91(25):11797–801 [DOI] [PMC free article] [PubMed] [Google Scholar]
- 10.Palii SS, Van Emburgh BO, Sankpal UT, Brown KD, Robertson KD. DNA methylation inhibitor 5-aza-2′-deoxycytidine induces reversible genome-wide DNA damage that is distinctly influenced by DNA methyltransferases 1 and 3B. Mol Cell Biol. 2008;28(2):752–71 [DOI] [PMC free article] [PubMed] [Google Scholar]
- 11.Fabre C, Grosjean J, Tailler M, Boehrer S, Ades L, Perfettini JL, et al. A novel effect of DNA methyltransferase and histone deacetylase inhibitors: NFkappaB inhibition in malignant myeloblasts. Cell Cycle. 2008;7(14):2139–45 [DOI] [PubMed] [Google Scholar]
- 12.Karpf AR. A potential role for epigenetic modulatory drugs in the enhancement of cancer/germ-line antigen vaccine efficacy. Epigenetics. 2006;1(3):116–20 [DOI] [PMC free article] [PubMed] [Google Scholar]
- 13.Fandy TE, Herman JG, Kerns P, Jiemjit A, Sugar EA, Choi SH, et al. Early epigenetic changes and DNA damage do not predict clinical response in an overlapping schedule of 5-azacytidine and entinostat in patients with myeloid malignancies. Blood. 2009;114(13):2764–73 [DOI] [PMC free article] [PubMed] [Google Scholar]
- 14.Kordasti SY, Afzali B, Lim Z, Ingram W, Hayden J, Barber L, et al. IL-17-producing CD4(+) T cells, pro-inflammatory cytokines and apoptosis are increased in low risk myelodysplastic syndrome. Br J Haematol. 2009;145(1):64–72 [DOI] [PubMed] [Google Scholar]
- 15.Kordasti SY, Ingram W, Hayden J, Darling D, Barber L, Afzali B, et al. CD4+CD25high Foxp3+ regulatory T cells in myelodysplastic syndrome (MDS). Blood. 2007;110 (3):847–50 [DOI] [PubMed] [Google Scholar]
- 16.Kim HP, Leonard WJ. CREB/ATF-dependent T cell receptor-induced FoxP3 gene expression: a role for DNA methylation. J Exp Med. 2007;204(7):1543–51 [DOI] [PMC free article] [PubMed] [Google Scholar]
- 17.Wilson CB, Rowell E, Sekimata M. Epigenetic control of T-helper-cell differentiation. Nat Rev Immunol. 2009;9(2):91–105 [DOI] [PubMed] [Google Scholar]
- 18.Quddus J, Johnson KJ, Gavalchin J, Amento EP, Chrisp CE, Yung RL, et al. Treating activated CD4+ T cells with either of two distinct DNA methyltransferase inhibitors, 5-azacytidine or procainamide, is sufficient to cause a lupus-like disease in syngeneic mice. J Clin Invest. 1993;92(1):38–53 [DOI] [PMC free article] [PubMed] [Google Scholar]
- 19.Sanchez-Abarca LI, Gutierrez-Cosio S, Santamaria C, Caballero-Velazquez T, Blanco B, Herrero-Sanchez C, et al. Immunomodulatory effect of 5-azacytidine (5-azaC): potential role in the transplantation setting. Blood. 2010;115(1):107–21 [DOI] [PubMed] [Google Scholar]
- 20.Penix LA, Sweetser MT, Weaver WM, Hoeffler JP, Kerppola TK, Wilson CB. The proximal regulatory element of the interfer-on-gamma promoter mediates selective expression in T cells. J Biol Chem. 1996; 271(50):31964–72 [DOI] [PubMed] [Google Scholar]
- 21.Bird JJ, Brown DR, Mullen AC, Moskowitz NH, Mahowald MA, Sider JR, et al. Helper T cell differentiation is controlled by the cell cycle. Immunity. 1998;9(2):229–37 [DOI] [PubMed] [Google Scholar]
- 22.Lee DU, Agarwal S, Rao A. Th2 lineage commitment and efficient IL-4 production involves extended demethylation of the IL-4 gene. Immunity. 2002;16(5):649–60 [DOI] [PubMed] [Google Scholar]
- 23.Goodyear O, Agathanggelou A, Novitzky-Basso I, Siddique S, McSkeane T, Ryan G, et al. Induction of a CD8+ T-cell response to the MAGE cancer testis antigen by combined treatment with azacitidine and sodium valproate in patients with acute myeloid leukemia and myelodysplasia. Blood. 2010;116(11):1908–18 [DOI] [PubMed] [Google Scholar]
- 24.Cheson BD, Greenberg PL, Bennett JM, Lowenberg B, Wijermans PW, Nimer SD, et al. Clinical application and proposal for modification of the International Working Group (IWG) response criteria in myelodysplasia. Blood. 2006;108(2):419–25 [DOI] [PubMed] [Google Scholar]
- 25.Prussin C, Metcalfe DD. Detection of intra-cytoplasmic cytokine using flow cytometry and directly conjugated anti-cytokine antibodies. J Immunol Methods. 1995;188(1): 117–28 [DOI] [PubMed] [Google Scholar]
- 26.Ahmadzadeh M, Rosenberg SA. IL-2 administration increases CD4+ CD25(hi) Foxp3+ regulatory T cells in cancer patients. Blood. 2006;107(6):2409–14 [DOI] [PMC free article] [PubMed] [Google Scholar]
- 27.Kordasti S, Marsh J, Al-Khan S, Jiang J, Smith A, Mohamedali A, et al. Functional characterization of CD4+ T cells in aplastic anemia. Blood. 2012;119(9):2033–43 [DOI] [PubMed] [Google Scholar]
- 28.Ordway JM, Bedell JA, Citek RW, Nunberg A, Garrido A, Kendall R, et al. Comprehensive DNA methylation profiling in a human cancer genome identifies novel epigenetic targets. Carcinogenesis. 2006;27(12):2409–23 [DOI] [PubMed] [Google Scholar]
- 29.Khan R, Schmidt-Mende J, Karimi M, Gogvadze V, Hassan M, Ekstrom TJ, et al. Hypomethylation and apoptosis in 5-aza-cytidine-treated myeloid cells. Exp Hematol. 2008;36(2):149–57 [DOI] [PubMed] [Google Scholar]
- 30.Thomas NSB. Cell cycle regulation. In: Degos L, Griffin JD, Linch DC, Lowenberg B, ed. Textbook of Malignant Haematology. 2nd ed. London: Martin Dunitz, 2004:33–63 [Google Scholar]
- 31.Li L, Boussiotis VA. Tr17: a unique subset of T regulatory cells with distinct molecular and functional properties. ASH Annual Meeting Abstracts. 2011;118:1116 [Google Scholar]
- 32.Duhen T, Duhen R, Lanzavecchia A, Sallusto F, Campbell DJ. Functionally distinct subsets of human FOXP3+ Treg cells that phenotypically mirror effector Th cells. Blood. 2012;119(19):4430–40 [DOI] [PMC free article] [PubMed] [Google Scholar]
- 33.Zou W. Immunosuppressive networks in the tumour environment and their therapeutic relevance. Nat Rev Cancer. 2005;5 (4):263–74 [DOI] [PubMed] [Google Scholar]
- 34.Vignali DA, Collison LW, Workman CJ. How regulatory T cells work. Nat Rev Immunol. 2008;8(7):523–32 [DOI] [PMC free article] [PubMed] [Google Scholar]
- 35.Lim ZY, Killick S, Germing U, Cavenagh J, Culligan D, Bacigalupo A, et al. Low IPSS score and bone marrow hypocellularity in MDS patients predict hematological responses to antithymocyte globulin. Leukemia. 2007;21(7):1436–41 [DOI] [PubMed] [Google Scholar]
- 36.Goodyear OC, Dennis M, Jilani NY, Loke J, Siddique S, Ryan G, et al. Azacitidine augments expansion of regulatory T cells after allogeneic stem cell transplantation in patients with acute myeloid leukemia (AML). Blood. 2012;119(14):3361–9 [DOI] [PubMed] [Google Scholar]
- 37.Choi J, Ritchey J, Prior JL, Holt M, Shannon WD, Deych E, et al. In vivo administration of hypomethylating agents mitigate graft-versus-host disease without sacrificing graft-versus-leukemia. Blood. 2010;116(1): 129–39 [DOI] [PMC free article] [PubMed] [Google Scholar]
- 38.Bontkes HJ, Ruben JM, Alhan C, Westers TM, Ossenkoppele GJ, van de Loosdrecht AA. Azacitidine differentially affects CD4(pos) T-cell polarization in vitro and in vivo in high risk myelodysplastic syndromes. Leukemia Res. 2012;36(7):921–30 [DOI] [PubMed] [Google Scholar]
- 39.Sakaguchi S, Sakaguchi N, Asano M, Itoh M, Toda M. Immunologic self-tolerance maintained by activated T cells expressing IL-2 receptor alpha-chains (CD25). Breakdown of a single mechanism of self-tolerance causes various autoimmune diseases. J Immunol. 1995;155(3):1151–64 [PubMed] [Google Scholar]
- 40.Hoechst B, Gamrekelashvili J, Manns MP, Greten TF, Korangy F. Plasticity of human Th17 cells and iTregs is orchestrated by different subsets of myeloid cells. Blood. 2011;117(24):6532–41 [DOI] [PubMed] [Google Scholar]
- 41.McClymont SA, Putnam AL, Lee MR, Esensten JH, Liu W, Hulme MA, et al. Plasticity of human regulatory T cells in healthy subjects and patients with type 1 diabetes. J Immunol. 2011;186(7):3918–26 [DOI] [PMC free article] [PubMed] [Google Scholar]
- 42.Esposito M, Ruffini F, Bergami A, Garzetti L, Borsellino G, Battistini L, et al. IL-17- and IFN-gamma-secreting Foxp3+ T cells infiltrate the target tissue in experimental autoimmunity. J Immunol. 2010;185(12): 7467–73 [DOI] [PubMed] [Google Scholar]
- 43.Duhen T, Duhen R, Lanzavecchia A, Sallusto F, Campbell DJ. Functionally distinct subsets of human FOXP3+ Treg cells that phenotypically mirror effector TH cells. Blood. 2012;119(19):4430–40 [DOI] [PMC free article] [PubMed] [Google Scholar]
- 44.Pandiyan P, Conti HR, Zheng L, Peterson AC, Mathern DR, Hernandez-Santos N, et al. CD4(+)CD25(+)Foxp3(+) regulatory T cells promote Th17 cells in vitro and enhance host resistance in mouse Candida albicans Th17 cell infection model. Immunity. 2011;34(3):422–34 [DOI] [PMC free article] [PubMed] [Google Scholar]
- 45.Miyao T, Floess S, Setoguchi R, Luche H, Fehling HJ, Waldmann H, et al. Plasticity of Foxp3(+) T cells reflects promiscuous Foxp3 expression in conventional T cells but not reprogramming of regulatory T cells. Immunity. 2012;36(2):262–75 [DOI] [PubMed] [Google Scholar]
- 46.Keilholz U, Letsch A, Busse A, Asemissen AM, Bauer S, Blau IW, et al. A clinical and immunologic phase 2 trial of Wilms tumor gene product 1 (WT1) peptide vaccination in patients with AML and MDS. Blood. 2009;113(26):6541–8 [DOI] [PubMed] [Google Scholar]
- 47.Yao X, Ahmadzadeh M, Lu YC, Liewehr DJ, Dudley ME, Liu F, et al. Levels of peripheral CD4+FoxP3+ regulatory T cells are negatively associated with clinical response to adoptive immunotherapy of human cancer. Blood. 2012;119(24):5688–96 [DOI] [PMC free article] [PubMed] [Google Scholar]