Despite limited discovery stages (<1,125 cases), genome-wide association studies (GWAS) have successfully identified 13 loci associated with risk of chronic lymphocytic leukemia/small lymphocytic lymphoma (CLL). To identify additional CLL susceptibility loci, we conducted the largest meta-analysis, to date, including four GWAS totaling 3,100 CLL cases and 7,667 controls with genotype data. In the meta-analysis, we discovered ten independent SNPs in nine novel loci at 10q23.31 (ACTA2/FAS; P=1.22×10⁻¹⁴), 18q21.33 (BCL2; P=7.76×10⁻¹¹), 11p15.5 (C11orf21; P=2.15×10⁻¹⁰), 4q25 (LEF1; P=4.24×10⁻¹⁰), 2q33.1 (CASP10/CASP8; P=2.50×10⁻⁹), 9p21.3 (CDKN2B-AS1; P=1.27×10⁻⁸), 18q21.32 (PMAIP1; P=2.51×10⁻⁸), 15q15.1 (BMF; P=2.71×10⁻¹⁰), and 2p22.2 (QPCT; P=1.68×10⁻⁸) as well as an independent signal at an established locus (2q13, ACOXL, P=2.08×10⁻¹⁸). We also found evidence for two additional promising loci that reached marginal genome-wide significance (P<2.0×10⁻⁷) at 8q22.3 (ODF1; P=5.40×10⁻⁸) and 5p15.33 (TERT; P=1.92×10⁻⁷). Although further studies are required, proximity of several of these loci to genes involved in apoptosis suggests a plausible underlying biological mechanism.
CLL is a B-cell malignancy with a strong familial component1 and an ~8.5-fold increased relative risk in first-degree relatives.2 Previous CLL GWAS have identified 13 loci that explain a portion of the familial risk,3–6 suggesting that additional loci of modest effects can be found using a larger discovery sample size.7
As part of a larger initiative in non-Hodgkin lymphoma (NHL) (called the NHL-GWAS), we genotyped 2,343 CLL cases and 2,854 controls of European descent from 22 studies using the Illumina OmniExpress Beadchip (see Online Methods and Supplementary Table 1). Of those 5,197 subjects, 94% passed rigorous quality control criteria (see Online Methods and Supplementary Table 2) and 549,934 SNPs successfully passed quality control criteria with a median call rate >98%. We also utilized genotype data previously generated on the Illumina Omni2.5 from an additional 3,536 controls and one case from three studies8 giving a total of 2,179 cases and 6,221 controls for the analysis of the NHL-GWAS (Supplementary Table 3).
In the NHL-GWAS (Stage 1) analysis, we observed an enrichment of SNPs with small P-values compared to the null distribution with a lambda of 1.026 in the Q-Q plot (Supplementary Figure 1). After exclusion of previously established loci, an excess of small P-values still remained suggesting additional novel loci were yet to be discovered. In our Stage 1 analyses, we observed SNPs from 10 unique loci (defined as separated by at least 500kb and linkage disequilibrium (LD) r2<0.05), which reached genome-wide significance (P<5×10⁻⁸), including eight established loci and two novel loci (Supplementary Figure 2).
We then performed a meta-analysis of the NHL-GWAS with three other independent CLL GWAS5,9 that had a combined total of 921 CLL cases and 1,446 controls (Stage 2, Supplementary Tables 1 and 3). Because these other CLL GWAS studies were conducted on different commercial SNP microarrays, we imputed common SNPs from the 1000 Genomes Project10 using IMPUTE211 (Online Methods, Supplementary Table 4). In the meta-analysis of stages 1 and 2 data, associations for all 13 established loci showed a consistent direction of effect with previously reported studies, and 10 loci achieved P<5×10⁻⁸ (Supplementary Table 5). However, two previously established loci, 15q25.2 and 19q13.3, were only nominally significant in the meta-analysis (P=0.03, and P=0.008, respectively), and no significant association was observed in stage 1 for the 15q25.2 locus (P=0.10). A suggestive locus on 18q21.1 that had not met genome-wide significance in prior studies12 was also nominally significant (P=5.06×10⁻⁴) herein. From the meta-analysis of stages 1–2, we identified 10 promising SNPs in the eight novel loci and one promising SNP in an established locus that we carried forward for a de novo replication in stage 3: this included an additional 392 cases and 4561 controls and in silico replication in an independent CLL GWAS with 396 cases and 311 controls (see Online Methods and Supplementary Tables 1, 3, and 4).
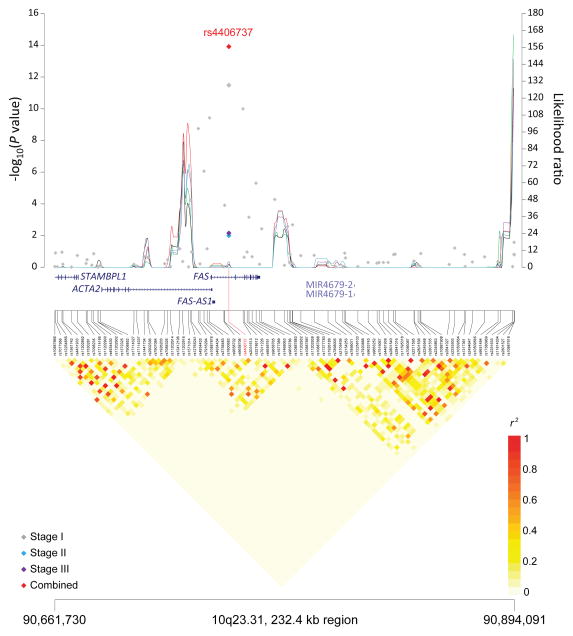
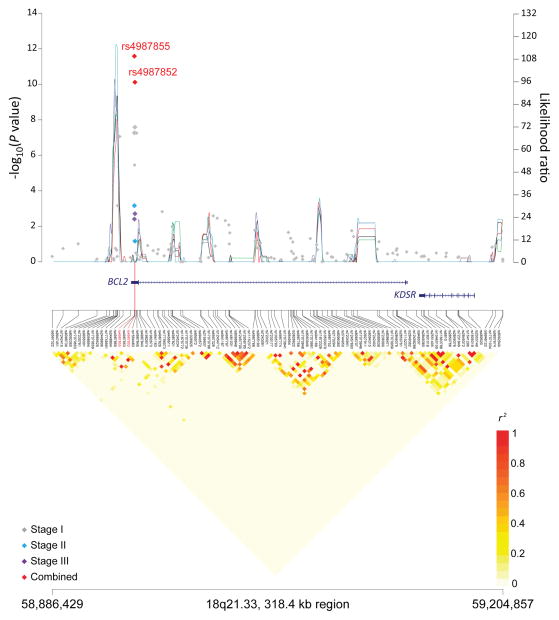
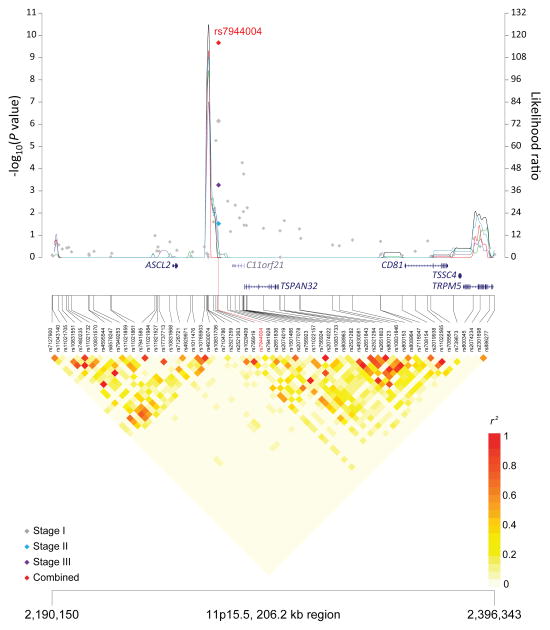
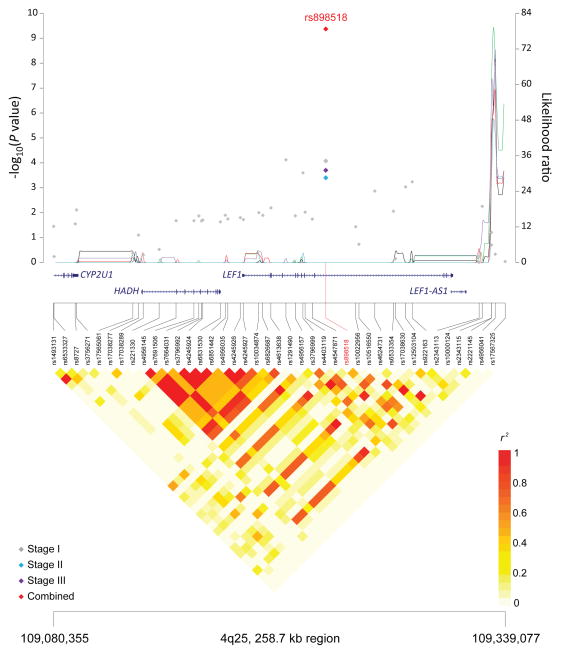
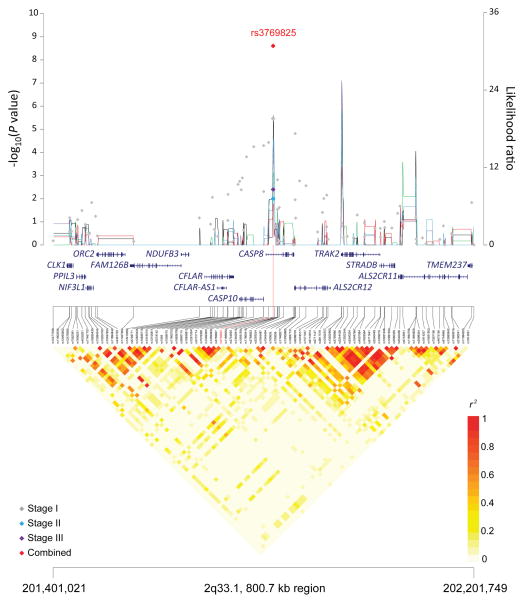
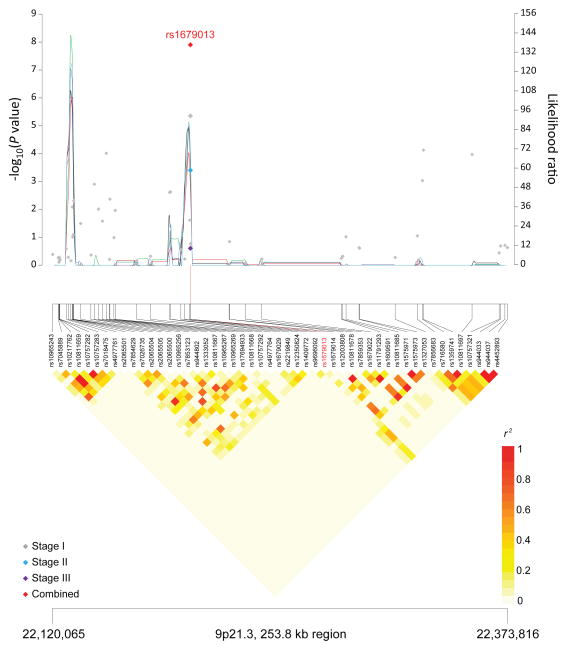
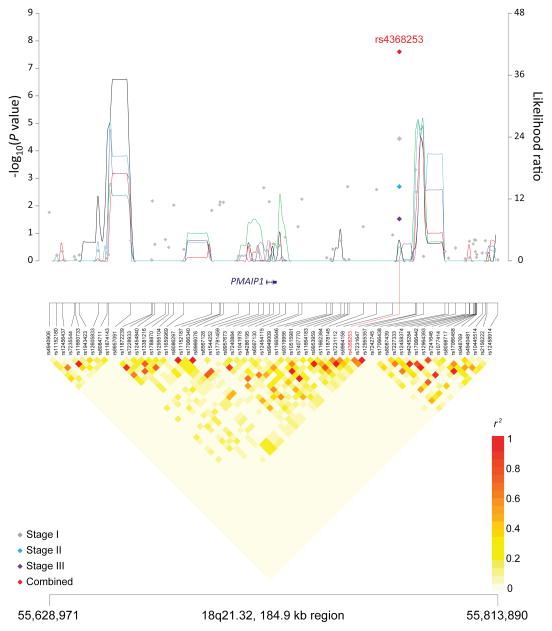
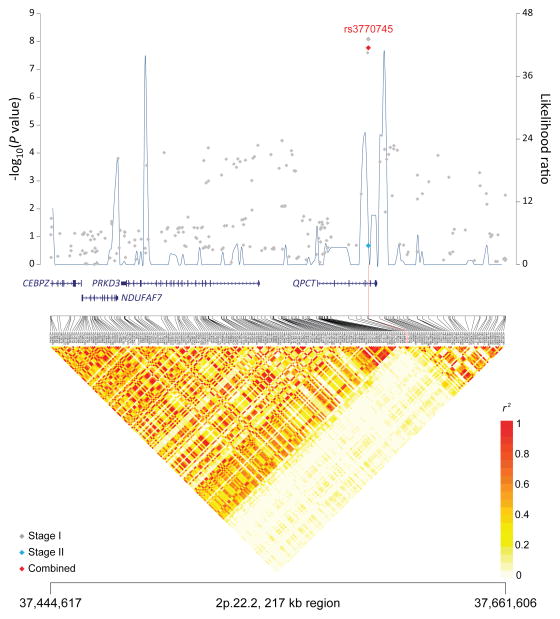
Seven of the 10 SNPs in novel loci reached genome-wide significance in the meta-analysis of all three stages: 10q23.31 (ACTA2/FAS; P=1.22×10⁻¹⁴), 18q21.33 (BCL2; P=2.66×10⁻¹²), 11p15.5 (C11orf21; P=2.15×10⁻¹⁰), 4q25 (LEF1; P=4.24×10⁻¹⁰), 2q33.1 (CASP10/CASP8; P=2.50×10⁻⁹), 9p21.3 (CDKN2B-AS1; P=1.27×10⁻⁸), and 18q21.32 (PMAIP1; P=2.51×10⁻⁸) (Table 1, Figure 1). Further, within the 18q21.33 locus, a second SNP (rs4987852) in low LD (r2=0.01) with rs4987855 and located only 372 bp away, also reached genome-wide significance (Table 1, P =7.76×10⁻¹¹); this SNP was determined to be independent in conditional analyses (Pconditional =3.87×10⁻⁷, Table 2).
Table 1.
Association results for novel loci and new independent SNPs
| Chr | Nearest gene(s) | SNP | Risk | Other | p | ||||
|---|---|---|---|---|---|---|---|---|---|
| Position | allelea | allele | RAF | Stage | OR (95% CI) | ||||
| Novel loci | |||||||||
| 10q23.31 | ACTA2, FAS | rs 4406737 | 90,749,704 | G | A | 0.57 | Stage 1 | 1.30 (1.21–1.40) | 3.30 × 10⁻¹² |
| Stage 2 | 1.17 (1.03–1.32) | 0.01 | |||||||
| Stage 3 | 1.27 (1.06–1.52) | 0.007 | |||||||
| Combinedb | 1.27 (1.19–1.33) | 1.22 × 10⁻¹⁴ | |||||||
| 18q21.33 | BCL2 | rs4987855* | 58,944,529 | G | A | 0.91 | Stage 1 | 1.47 (1.28–1.69) | 5.51 × 10⁻⁸ |
| Stage 2 | 1.47 (1.18–1.85) | 0.0007 | |||||||
| Stage 3 | 1.43 (1.12–1.82) | 0.004 | |||||||
| Combinedb | 1.47 (1.32–1.61) | 2.66 × 10⁻¹² | |||||||
| rs 4987852 | 58,944,901 | G | A | 0.06 | Stage 1 | 1.43 (1.26–1.63) | 2.67×10⁻⁸ | ||
| Stage 2 | 1.24 (0.98–1.56) | 0.07 | |||||||
| Stage 3 | 1.52 (1.17–1.97) | 0.002 | |||||||
| Combinedb | 1.41 (1.27–1.56) | 7.76 × 10⁻¹¹ | |||||||
| 11p15.5 | C11orf21, TSPAN32 | rs 7944004 | 2,267,728 | T | G | 0.49 | Stage 1 | 1.19 (1.11–1.28) | 7.20×10⁻⁷ |
| Stage 2 | 1.15 (1.02–1.32) | 0.03 | |||||||
| Stage 3 | 1.27 (1.11–1.45) | 0.0006 | |||||||
| Combinedb | 1.20 (1.13–1.27) | 2.15 × 10⁻¹⁰ | |||||||
| 4q25 | LEF1 | rs898518* | 109,236,273 | A | C | 0.59 | Stage 1 | 1.16 (1.08–1.24) | 8.47×10⁻⁵ |
| Stage 2 | 1.26 (1.11–1.43) | 0.0004 | |||||||
| Stage 3 | 1.30 (1.14–1.49) | 0.0002 | |||||||
| Combinedb | 1.20 (1.14–1.27) | 4.24 × 10⁻¹⁰ | |||||||
| 2q33.1 | CASP10, CASP8 | rs 3769825 | 201,819,625 | T | C | 0.45 | Stage 1 | 1.18 (1.10–1.27) | 3.43×10⁻⁶ |
| Stage 2 | 1.16 (1.03–1.32) | 0.01 | |||||||
| Stage 3 | 1.22 (1.07–1.40) | 0.004 | |||||||
| Combinedb | 1.19 (1.12–1.25) | 2.50 × 10⁻⁹ | |||||||
| 9p21.3 | CDKN2B-AS1 | rs 1679013 | 22,196,987 | C | T | 0.52 | Stage 1 | 1.18 (1.10–1.27) | 4.47×10⁻⁶ |
| Stage 2 | 1.32 (1.12–1.52) | 0.0004 | |||||||
| Stage 3 | 1.11 (0.93–1.32) | 0.25 | |||||||
| Combinedb | 1.19 (1.12–1.27) | 1.27 × 10⁻⁸ | |||||||
| 18q21.32 | PMAIP1 | rs 4368253 | 55,773,267 | C | T | 0.69 | Stage 1 | 1.18 (1.09–1.27) | 3.65×10⁻⁵ |
| Stage 2 | 1.24 (1.08–1.41) | 0.002 | |||||||
| Stage 3 | 1.18 (1.02–1.37) | 0.03 | |||||||
| Combinedb | 1.19 (1.12–1.27) | 2.51 × 10⁻⁸ | |||||||
| 15q15.1 | BMF | rs8024033† | 38,190,949 | C | G | 0.51 | Stage 1 | 1.22 (1.14–1.32) | 2.72×10⁻⁸ |
| Stage 2 | 1.22 (1.08–1.39) | 0.003 | |||||||
| Stage 3 | - | - | |||||||
| Combinedb | 1.22 (1.15–1.30) | 2.71 × 10⁻¹⁰ | |||||||
| 2p22.2 | QPCT, PRKD3 | rs3770745† | 37,449,593 | T | C | 0.22 | Stage 1 | 1.29 (1.18–1.40) | 8.23×10⁻⁹ |
| Stage 2 | 1.10 (0.95–1.28) | 0.21 | |||||||
| Stage 3 | - | - | |||||||
| Combinedb | 1.24 (1.15–1.33) | 1.68 × 10⁻⁸ | |||||||
| New independent SNP in established locus | |||||||||
| 2q13 | ACOXL, BCL2L11 | rs13401811* | 111,332,575 | G | A | 0.81 | Stage 1 | 1.43 (1.28–1.56) | 9.76×10⁻¹³ |
| Stage 2 | 1.45 (1.23–1.72) | 9.39×10⁻⁶ | |||||||
| Stage 3 | 1.32 (1.08–1.59) | 0.007 | |||||||
| Combinedb | 1.41 (1.30–1.52) | 2.08 × 10⁻¹⁸ | |||||||
The risk allele is the allele corresponding to the estimated odds ratio; RAF= risk allele frequency in controls; OR= per allele odds ratio adjusted for age, sex and significant principal components.
Number of cases and controls in the joint analysis of stage 1+stage2+stage3: rs4406737 (3,481/12,170), 20 rs4987855 (3,883/12,446), rs4987852 (3,880/12,497), rs7944004 (3,869/12,476), rs898518 (3,879/12,441), rs3769825 (3,885/12,471), rs1679013 (3,482/12,148), rs4368253 (3,882/12,473), rs8024033 (3096/7663), rs3770745 (3097/7663), rs13401811 (3,839/12,264).
For the ICGC study in stage 3, results for proxy SNPs were provided (rs4987856/rs4987855, r2=1.0; rs7698317/rs898518, r2=1.0; rs1554005/rs13401811, r2=1.0).
Identified from the 1000 Genomes meta-analysis of stage 1 and stage 2 with imputation information >0.9 in the NHL-GWAS.
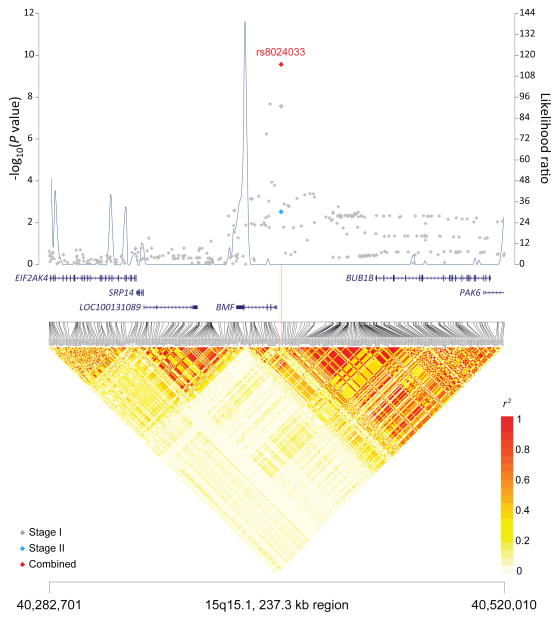
Figure 1. Association results, recombination hot-spots, and linkage disequilibrium (LD) plots for the regions newly associated with CLL.
Top, association results of GWAS data from Stage 1 NHL-GWAS (grey diamonds), Stage 2 combined data (blue diamond), Stage 3 combined data (purple diamond), and Stages 1–3 combined data (red diamond) are shown in the top panel with −log10(P) values (left y axis). Overlaid are the likelihood ratio statistics (right y axis) to estimate putative recombination hotspots across the region on the basis of 5 unique sets of 100 randomly selected control samples. Bottom, LD heatmap based on r2 values from total control populations for all SNPs included in the GWAS. (a) 10q23.31 region; (b) 18q21.33 region; (c) 11p15.5 region; (d) 4q25 region; (e) 2q33.1 region; (f) 9p21.3 region; (g) 18q21.32 region; (h) 15q15.1 region; (i) 2p22.2 region.
Table 2.
Conditional analyses for select SNPs
| New SNP | Chr | Position | Nearest gene | ORa | Pa | Conditional | Conditional | Established | r2 * | ORc | Pc | Conditional | Conditional |
|---|---|---|---|---|---|---|---|---|---|---|---|---|---|
| ORb | Pb | SNP | ORd | Pd | |||||||||
| rs13401811 | 2q13 | 111,332,575 | ACOXL, BCL2L11 | 1.43 | 6.09×10⁻¹⁷ | 1.35 | 1.60×10⁻¹² | rs17483466 | 0.02 | 1.37 | 3.53×10⁻¹⁷ | 1.31 | 6.70×10⁻¹³ |
| rs7578199 | 2q37.3 | 241,841,521 | HDLBP, FARP2 | 1.20 | 5.39×10⁻⁷ | 1.19 | 6.10×10⁻⁶ | rs757978 | 0.01 | 1.29 | 1.35×10⁻⁷ | 1.26 | 2.37×10⁻⁶ |
| rs9273363 | 6p21.32 | 32,734,250 | HLA | 1.24 | 2.24×10⁻¹⁰ | 1.24 | 3.50×10⁻⁹ | rs674313 | 0.21 | 1.13 | 5.00×10⁻⁴ | 1.06 | 0.11 |
| rs9273363 | 6p21.32 | 32,734,250 | HLA | 1.24 | 2.24×10⁻¹⁰ | 1.23 | 3.14×10⁻⁹ | rs9272535 | 0.11 | 1.18 | 7.60×10⁻⁶ | 1.12 | 0.002 |
| rs11636802 | 15q21.3 | 54,562,889 | MNS1 | 1.41 | 1.68×10⁻¹³ | 1.38 | 1.54×10⁻⁹ | rs7169431 | 0.16 | 1.27 | 1.72×10⁻⁵ | 1.06 | 0.32 |
| rs35748167 | 18q21.32 | 56,188,413 | PMAIP1, MC4R | 1.32 | 9.31×10⁻⁹ | 1.25 | 7.89×10⁻⁷ | rs4368253e | 0.003 | 1.19 | 2.82×10⁻⁷ | 1.18 | 5.76×10⁻⁷ |
| rs4987852 | 18q21.33 | 58,944,901 | BCL2 | 1.41 | 7.76×10⁻¹¹ | 1.36 | 1.50×10⁻⁸ | rs4987855e | 0.01 | 1.47 | 2.66×10⁻¹² | 1.41 | 1.33×10⁻¹⁰ |
r2 linkage disequilibrium is based on 1000 Genomes Project and is between the new SNP and established SNP in the locus
OR per allele odds ratio and P for the new SNP from the unconditional meta-analysis based on stage 1 + 2 for all loci, except 18q21.33. Data from stages 1–3 was used for 18q21.33.
OR and P for the new SNP from the conditional meta-analysis
OR and P for the established SNP from the unconditional meta-analysis
OR and P for the established SNP from the conditional meta-analysis
SNP discovered and confirmed in the current study
To explore these regions in greater detail and identify additional loci that we may have missed using just the genotyped SNPs in Stage 1, we imputed Stage 1 of our NHL-GWAS using the 1000 Genomes Project10 data (February 2012 release) and performed a meta-analysis of the results from stage 1 and stage 2. The most significant SNPs at three of our novel loci, 10q23.31 (rs2147420) 18q21.33 (rs4987856), and 4q25 (rs2003869), were highly correlated (r2 ≥0.95) with our strongest genotyped SNPs, rs4406737, rs4987885, and rs898518, respectively (Supplementary Table 6). Only modest correlation (r2 range: 0.18–0.58) was observed for the most significant imputed SNPs at 11p15.5 (rs2521269), 2q33.1 (rs11688943), and 9p21.3 (rs1359742) and our strongest genotyped SNPs in each of the respective regions. The most significant of the imputed SNPs at 18q21.32 (rs35748167) appeared to be independent of our strongest genotyped SNP (rs4368253, r2=0.003, Pconditional < 7.89×10⁻⁷ for both SNPs), suggesting a possible second, independent signal (Table 2).
Meta-analysis of our imputed scan data revealed two novel loci, 15q15.1 (BMF; P=2.71×10⁻¹⁰) and 2p22.2 (QPCT; P=1.68×10⁻⁸) (Table 1, Figure 1). In addition, although our genotyped SNP at 5p15.33 (TERT, rs10069690, P=1.92×10⁻⁷) (Supplementary Table 7) did not reach genome-wide significance, we did observe an imputed SNP in this region that reached genome-wide significance (rs7705526; P=3.75×10⁻⁸). Another promising locus was observed at 8q22.3 (ODF1; P=5.40×10⁻⁸) (Supplementary Table 7). Additional studies are needed to confirm these findings, particularly the signal on 5p15.33, which is already known to harbor risk variants for multiple cancers.13–20,
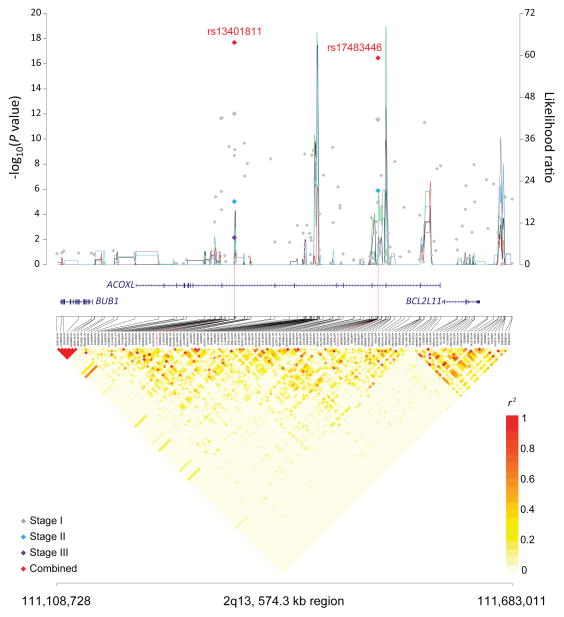
An examination of established loci revealed a new SNP in 2q13 (BCL2L11, rs13401811, P=6.09×10⁻¹⁷; Table 1, Figure 2) that was independent of the previously reported SNP. After conditioning on the established 2q13 SNP (rs17483466, r2=0.02), the new SNP rs13401811 remained strongly associated with CLL risk (Pconditional=1.60×10⁻¹², Table 2). A putative second signal was observed at the established 2q37.3 locus (Supplementary Table 5, rs7578199, P =5.39×10⁻⁷) that was in low LD (r2=0.01) and independent of the previously reported rs757978 SNP (Pconditional=6.10×10⁻⁶, Table 2), although rs7578199 was not genome-wide significant. Another possible second signal was observed on 6p21.32 (Supplementary Table 5, HLA, rs9273363, P=2.24×10⁻¹⁰). Rs9273363 showed some evidence of conditional independence with the originally reported SNPs (r2≤0.25, Pconditional ≤3.50×10⁻⁹, Table 2); however, it may be part of a shared HLA haplotype; thus accurate HLA typing is needed to further clarify its level of independence. Finally, we observed a SNP at 15q21.3 (Supplementary Table 5, rs11636802, P=1.68×10⁻¹³) that had stronger statistical significance than that of the previously reported SNP, rs7169431 (P=1.72×10−05). Although only modestly correlated (r2=0.16), rs11636802 explained all of the risk associated with rs7169431 in a conditional analysis (Table 2) suggesting that this SNP may be a better marker for the locus.
Figure 2. Association results, recombination hot-spots, and linkage disequilibrium (LD) plot for the new independent CLL susceptibility SNP in the 2q13 established locus.
Top, association results of GWAS data from Stage 1 NHL-GWAS (grey diamonds), Stage 2 combined data (blue diamond), Stage 3 combined data (purple diamond), and Stages 1–3 combined data (red diamond) are shown in the top panel with −log10(P) values (left y axis). Overlaid are the likelihood ratio statistics (right y axis) to estimate putative recombination hotspots across the region on the basis of 5 unique sets of 100 randomly selected control samples. Bottom, LD heatmap based on r2 values from total control populations for all SNPs included in the GWAS.
Heritability analysis indicated that the ten independent SNPs in our novel loci together with the new independent SNP at 2q13 (Table 1) explain approximately 5% more of the familial risk in addition to ~12% for the established loci. When we explored the contribution of all common variants to the genetic heritability of CLL (using a method that estimates the variance explained by fitting all genotyped autosomal SNPs simultaneously21,22, Online Methods) 21,22 21,22 we estimate that common SNPs have the potential to explain up to ~46% of the familial risk, suggesting more common loci, likely of small effects, are still yet to be discovered. However, the analysis also implies that common SNPs probably do not explain all of the familial risk and other factors, such as uncommon SNPs with modest effects or rare highly penetrant variants, are likely to also play a role.
Five of the novel loci (10q23.31, 18q21.33, 2q33.1, 18q21.32, and 15q15.1) identified in this study as well as the new SNP at the established 2q13 locus are located in or near genes involved in apoptosis. Rs4406737 is located on 10q23.31 between the first and second exons of FAS, a member of the tumor necrosis factor receptor superfamily that has a crucial role in the initiation of the signaling cascade of the caspase family in apoptosis. Mutations in FAS leading to defective Fas-mediated apoptosis have been documented in inherited lymphoproliferative disorders associated with autoimmunity,23,24 and families with germline FAS mutations have a substantially increased risk of other lymphoma subtypes.25
The two newly identified SNPs at 18q21.33 (rs4987855 and rs4987852) map to the 3′-UTR of B-cell CLL/lymphoma 2 (BCL2), which encodes an essential outer mitochondrial membrane protein that blocks lymphocyte apoptosis. Constitutive expression of BCL2 through t(14:18) and other translocations is common in follicular lymphomas, but the translocation is also seen in CLL albeit rarely.26 Both SNPs are located within a narrow region of BCL2 where the majority of t(14;18) translocation breakpoints occur.27 rs4987855 is in linkage disequilibrium with a SNP (rs4987856, r2=1.0) that is located within 200bp of a putative microRNA binding site for mir-19528 and was found to be nominally correlated with BCL2 expression (Supplementary Table 8, P=0.02)29. Forced overexpression of BCL2 in mice leads to an increased incidence of B-cell lymphomas.30
The novel SNPs at 18q21.32 and 15q15.1 as well as the new SNP at the established 2q13 locus are located near Bcl-2 family member genes. Rs4368253 is located approximately 51kb downstream from phorbol-12-myristat-13-acetate-induced protein 1 (PMAIP1), which encodes the proapoptotic BCL2 protein, NOXA. Regulation of apoptosis through NOXA is critical for B-cell expansion after antigen triggering.31 Down-regulation of NOXA contributes to the persistence of CLL B-cells in the lymph node environment.32 Rs8024033 is located approximately 5.4kb upstream of Bcl-2 modifying factor (BMF), which encodes an apoptotic activator that binds to BCL2 proteins. BMF has been implicated in the survival of chronic lymphocytic leukemia cells33, and loss of BMF in mice leads to B-cell hyperplasia and an accelerated development of radiation-induced thymic lymphomas34. The new SNP (rs13401811) at 2q13, a locus previously implicated in risk of CLL3,35,36 and more generally B-cell non-Hodgkin lymphomas,37 is located approximately 262kb upstream of BCL2-like 11 (BCL2L11). BCL2L11 encodes a pro-apoptotic member of the BCL2 family, BIM, which plays a key role in the regulation of apoptosis in T- and B-cell homeostasis. Loss of BIM accelerates Myc-induced leukemia in mice,38 and this SNP has been previously reported to be nominally associated with CLL in a small candidate gene study.39
The novel 2q33.1 SNP (rs3769825) resides in intron 2 of caspase-8 (CASP8) and is in LD with a missense SNP (rs13006529, r2=0.71) in the nearby caspase-10 (CASP10) (Supplementary Table 9), both of which play a central role in cell apoptosis. SNPs within this region have been associated with breast cancer,40 esophageal cancer,41 and melanoma42 susceptibility. SNPs in CASP8/CASP10, including one in moderate LD with ours (rs11674246, r2=0.66), were previously nominally associated with CLL risk in smaller case-control studies.43,44
The remaining four novel loci (11p15.5, 4q25, 9p21.3 and 2p22.2) map to other biologically interesting genes. The 4q25 SNP, rs898518, is located between the fourth and fifth exons of lymphoid enhancer-binding factor 1 (LEF1), which encodes a transcription factor involved in the Wnt signaling pathway, an essential component for the normal homeostasis of hematopoietic stem cells.45 Aberrant protein expression of LEF1 has been observed in CLL cells as well as monoclonal B-cell lymphocytosis, suggesting that LEF1 plays an early role in CLL leukemogenesis.46 Rs1679013 maps to an inter-genic region on 9p21.3, roughly 200kb upstream fromCDKN2B-AS1, an antisense non-coding RNA implicated in the risk of acute lymphocytic leukemia.47 The 2p22.2 SNP (rs3770745) is located approximately 52kb upstream of protein kinase D3 (PRKD3), which interacts with transcriptional repressor, B-cell lymphoma 6 (BCL-6). Lastly, the 11p15.5 region contains many imprinted genes and has been implicated in Beckwith-Wiedemann syndrome,48 a disorder characterized by excessive growth and a high incidence of childhood tumors.49
In conclusion, our large GWAS of CLL identified ten SNPs in nine novel loci and one new independent SNP in a previously discovered locus. Together with the previously established loci, the cumulative set of SNPs correspond to an area-under-the-curve (AUC) of 0.73. Although further studies are required to fine-map the regions, the proximity of several of these loci to genes involved in apoptosis suggests a possible underlying mechanism of biological relevance. Our results further support a substantial contribution of common gene variants in the pathogenesis of CLL.
ONLINE METHODS
Stage 1: NHL-GWAS
As part of a larger initiative, we conducted a genome-wide association study (GWAS) of CLL using cases and controls of European descent from 22 studies of non-Hodgkin lymphoma (NHL) (Supplementary Table 1), including nine prospective cohort studies, eight population-based case-control studies, and five clinic or hospital-based case-control studies. All studies obtained informed consent from their participants and approval from their respective Institutional Review Boards for this study. As described in Supplementary Table 1, cases were ascertained from cancer registries, clinics or hospitals, or through self-report verified by medical and pathology reports. The phenotype information for all NHL cases was reviewed centrally at the International Lymphoma Epidemiology Consortium (InterLymph) Data Coordinating Center and harmonized according to the hierarchical classification proposed by the InterLymph Pathology Working Group based on the World Health Organization (WHO) classification (2008).50,51
All CLL cases with sufficient DNA (n=2,343) and a subset of available controls frequency-matched by age and sex to cases (n=2,854) including 4% quality control duplicates were genotyped on the Illumina OmniExpress at the NCI Cancer Genomic Research Laboratory (CGR). Genotypes were called using Illumina GenomeStudio software, and quality control duplicates showed >99% concordance. Extensive quality control metrics were applied to the data. Monomorphic SNPs and SNPs with a call rate <93% were excluded. Samples with a call rate ≤93%, mean heterozygosity <0.25 or >0.33 based on the autosomal SNPs, or gender discordance (>5% heterozygosity on X chromosome for males and <20% heterozygosity on the X chromosome for females) were excluded. Unexpected duplicates (>99.9% concordance) and first-degree relatives based on identity by descent (IBD) sharing with Pi-hat>0.40 were removed. Ancestry was assessed using the GLU struct.admix module based on the method proposed by Pritchard et al,52 and participants with <80% European ancestry were excluded (Supplementary Figure 3). After exclusions, 2,178 (93%) cases and 2,685 (94%) controls remained (Supplementary Table 2). Genotype data previously generated on the Illumina Omni2.5 from additional 3,536 controls and 1 case from three of the studies (ATBC, CPSII, and PLCO) were also included,8 resulting in a total of 2,179 cases and 6,221 controls for the stage 1 analysis. Of these additional controls, 703 (~235 from each study) were selected to be representative of their cohort and cancer-free8. The remaining 2,823 controls were cancer-free controls from an unpublished study of prostate cancer in PLCO. SNPs with call rate <99%, with Hardy-Weinberg equilibrium P-value<1×10⁻⁶ or minor allele frequency <1% were excluded from analysis, leaving 549,934 SNPs for analysis. To evaluate population substructure, a principal components analysis (PCA) was performed using the Genotyping Library and Utilities (GLU), version 1.0, struct.pca module, which is similar to EIGENSTRAT.53 Plots of the first ten principal components are shown in Supplementary Figure 4. Association testing was conducted assuming a log-additive genetic model, adjusting for age, sex, and significant principal components. All data analysis and management was conducted using GLU.
Stage 2: Three Independent CLL GWAS
Three independent CLL GWAS provided genotype data for a meta-analysis (Supplementary Table 1). In all three studies, subjects with a genotyping call rate <95%, duplicates, related individuals, and SNPs with a call rate <95% were removed prior to imputation (Supplementary Table 4). Imputation was conducted separately for each study using IMPUTE211 and a hybrid of the 1000 Genomes Project version 2 (February 2012 release) and Division of Cancer Epidemiology and Genetics (DCEG) European reference panels.8,10 SNPs were imputed for a total of 921 cases and 1446 controls. Association testing was conducted for each study using SNPTEST version 2, adjusting for age, sex, and significant principal components for GEC and UCSF2. No principal components were significant for the Utah study.
Stage 3: Replication studies and technical validation
In stage 3, 10 SNPs in the most promising loci and one SNP from an established locus were taken forward for de novo replication in an additional 392 cases and 4561 controls from the NCI replication study (NCI Rep) and from the Utah/Sheffield Chronic Lymphocytic Leukemia study (Utah-Sheffield) (Supplementary Table 1). Additionally, these 10 SNPs were also taken forward in an in silico replication in 396 CLL cases and 311 controls from the International Cancer Genome Consortium (ICGC) (Supplementary Table 1). Genotyping for the NCI Rep study was conducted using custom TaqMan genotyping assays (Applied Biosystems) at the NCI Core Genotyping Resource and genotyping for the Utah-Sheffield study was conducted at the Core Research Facilities at the University of Utah. Blind duplicates (~5%) yielded 100% concordance. The ICGC study provided results for eight SNPs (or proxies) that were genotyped on the Affymetrix 6.0 SNP microarray (Supplementary Table 4). Association results for the NCI Rep and Utah-Sheffield studies were adjusted for age and sex, and results from the ICGC were adjusted for age, sex, and significant principal components. A comparison of the genotyping calls from the OmniExpress microarray and confirmatory TaqMan assays (n=384) yielded 99.9% concordance.
Meta analysis
Meta-analyses were performed using the fixed effects inverse variance method based on the beta estimates and standard errors from each study. For all SNPs in Tables 1 and 2, no substantial heterogeneity was observed among studies in stage 1 or among studies in stages 1–3 combined after Bonferroni correction (Pheterogeneity ≥ 0.02 for all SNPs).
Further follow-up analyses
Using 1000 Genomes data, we identified SNPs with r2>0.7 with our lead SNP that were reported to be non-synonymous or nonsense variants. We utilized HaploReg54 which is a tool for exploring non-coding functional annotation using ENCODE data, to evaluate the genome surrounding our SNPs (Supplementary Table 9). In addition, we evaluated cis associations between all novel and promising SNPs discovered in this study and the expression of nearby genes in lymphoblastoid cell lines from subjects of European descent from three publically available datasets29,55,56 (Supplementary Table 8).
Heritability analyses
To evaluate the familial risk explained by the novel loci identified in this study, we estimated the contribution of each SNP to the heritability using the equation7, h2SNP=β22f(1−f), where β is the log-odds ratio per copy of the risk allele and f is the allele frequency, and then summed the contributions of all novel SNPs. Using the equation derived by Pharoah et al57 to estimate the total heritability from the sibling relative risk (RR=8.5 from Goldin et al2), we then calculated the proportion of familial risk explained by dividing the summed contributions of the novel SNPs by the total heritability.
To estimate the contribution of all common SNPs to familial risk, we used the method proposed by Yang et al21, (which was extended to dichotomous traits22 and implemented in the Genome-wide Complex Trait Analysis (GCTA) software.58 The genetic similarity matrix was estimated from our discovery scan using all genotyped autosomal SNPs with a minor allele frequency >0.01. We used restricted maximum likelihood (REML), the default option for GCTA, to fit the appropriate variance components model that included the top 10 eigenvectors as covariates. The final estimate of heritability on the underlying liability scale assumed that the lifetime risk of CLL was 0.005. From this estimate, we calculated the proportion of familial risk explained based on a familial relative risk of 8.5. Details of fitting the variance components model and transforming from the observed to liability scale have been previously documented.22
Estimate of recombination hotspots
To identify recombination hotspots in the region we used SequenceLDhot59, a program that uses the approximate marginal likelihood method60 and calculates likelihood ratio statistics at a set of possible hotspots. We tested five unique sets of 100 control samples. PHASE v2.1 program was used to calculate background recombination rates61,62 and LD heatmap was visualized in r2 using snp.plotter program.63
Supplementary Material
Acknowledgments
We thank C. Allmer, E. Angelucci, A. Bigelow, I. Brock, K. Butterbach, A. Chabrier, D. Chan-Lam, J.M. Conners, D. Connley, M. Cornelis, K. Corsano, C. Dalley, D. Cox, H. Cramp, R. Cutting, H. Dykes, L. Ershler, A. Gabbas, R.P. Gallagher, R.D. Gascoyne, P. Hui, L. Irish, L. Jacobus, S. Kaul, J. Lunde, M. McAdams, R. Montalvan, M. Rais, T. Rattle, L. Rigacci, K. Snyder, G. Specchia, M. Stagner, P. Taylor, G. Thomas, C. Tornow, G. Wood, M. Yang, M. Zucca. The overall GWAS project was supported by the intramural program of the Division of Cancer Epidemiology and Genetics, National Cancer Institute, U.S. National Institutes of Health. A full list of acknowledgements is provided in the Supplementary Note.
Footnotes
AUTHORS’ CONTRIBUTIONS
S.I.B., C.F.S., N.J.C., A.N., W.C., S.S.W., L.R.T., A.R.B.W., P.H., M.P.P., B.M.B., B.K.A., P.C., Y.Z., G.S., A.Z.J., C.L., K.E.S., J.M., P.V., J.J.S., A.K., S. S., H.H., J.R.C., S.J.C., N.R. and S.L.S. organized and designed the study. C.F.S., N.J.C., B.J.,L.B., J.Y., A.H., L.C., P.M.B., E.A.H., J.M.C., J.R.C., S.J.C. and S.L.S. conducted and supervised the genotyping of samples. S.I.B., C.F.S., V.J., N.J.C., Z.W., N.C., C.C.C., M.Y., K.B.J., L.L., J.S., J.P., J.R.C., L.C., S.J.C., N.R. and S.L.S. contributed to the design and execution of statistical analysis. S.I.B., C.F.S., V.J., N.J.C., A.N., Z.W., W.C., A.M., R.S.K., N.C., C.C.C., M.Y., C.L., H.H., J.R.C., S.J.C., N.R. and S.L.S. wrote the first draft of the manuscript. S.I.B., C.F.S., V.J., N.J.C., A.N., W.C., A.M., S.S.W., R.S.K., Q.L., L.R.T., A.R.B.W., P.H., M.P.P., B.M.B., B.K.A., P.C., Y.Z., G.S., A.Z.J., T.G.C., T.D.S., A.J.N., N.E.K., M.L., A.H.W., K.E.S., H.O.A., M.M., B.G., E.T.C., M.G., K.C., L.A.C.A., B.J., W.R.D., B.K.L., G.J.W., L.C., P.M.B., J.R., E.A.H., M.T.S., R.D.J., L.F.T., S.D.S., Y.B., N.B., P.B., P.B., L.F., M.M., J.M., A.S., K.G.R., S.J.A., C.M.V., L.R.G., S.S.S., M.C.L., L.G.S., J.F.L., J.M.C., J.B.W., V.A.M., N.E.C., A.N., M.S.L., A.J.D.R., L.M.M., R.K.S., E.R., P.V., R.K., D.T., G.M., E.W., M.D.C., R.C.H.V., R.C.T., G.G.G., D.A., J.V., S.W., J.C., T.Z., T.R.H., K.O., A.Z., R.J.K., J.J.S., K.A.B., F.L., E.G., P.K., A.K., J.T., C.M.V., M.G.E., G.M.F., L.M., L.L., J.S, S.C., J.F.F., K.E.N., A.C., J.S., J.W., A.C., C.L.O., S.B., I.S., D.M., E.C., H.H., J.R.C., N.R. and S.L.S. conducted the epidemiological studies and contributed samples to the GWAS and/or follow-up genotyping. All authors contributed to the writing of the manuscript.
COMPETING INTERESTS
The authors declare no competing financial interests
References
- 1.Albright F, Teerlink C, Werner TL, Cannon-Albright LA. Significant evidence for a heritable contribution to cancer predisposition: a review of cancer familiality by site. BMC cancer. 2012;12:138. doi: 10.1186/1471-2407-12-138. [DOI] [PMC free article] [PubMed] [Google Scholar]
- 2.Goldin LR, Bjorkholm M, Kristinsson SY, Turesson I, Landgren O. Elevated risk of chronic lymphocytic leukemia and other indolent non-Hodgkin’s lymphomas among relatives of patients with chronic lymphocytic leukemia. Haematologica. 2009;94:647–53. doi: 10.3324/haematol.2008.003632. [DOI] [PMC free article] [PubMed] [Google Scholar]
- 3.Di Bernardo MC, et al. A genome-wide association study identifies six susceptibility loci for chronic lymphocytic leukemia. Nature genetics. 2008;40:1204–10. doi: 10.1038/ng.219. [DOI] [PubMed] [Google Scholar]
- 4.Crowther-Swanepoel D, et al. Common variants at 2q37.3, 8q24.21, 15q21.3 and 16q24.1 influence chronic lymphocytic leukemia risk. Nature genetics. 2010;42:132–6. doi: 10.1038/ng.510. [DOI] [PMC free article] [PubMed] [Google Scholar]
- 5.Slager SL, et al. Genome-wide association study identifies a novel susceptibility locus at 6p21.3 among familial CLL. Blood. 2011;117:1911–6. doi: 10.1182/blood-2010-09-308205. [DOI] [PMC free article] [PubMed] [Google Scholar]
- 6.Slager SL, et al. Common variation at 6p21.31 (BAK1) influences the risk of chronic lymphocytic leukemia. Blood. 2012 doi: 10.1182/blood-2012-03-413591. [DOI] [PMC free article] [PubMed] [Google Scholar]
- 7.Park JH, et al. Estimation of effect size distribution from genome-wide association studies and implications for future discoveries. Nature genetics. 2010;42:570–5. doi: 10.1038/ng.610. [DOI] [PMC free article] [PubMed] [Google Scholar]
- 8.Wang Z, et al. Improved imputation of common and uncommon SNPs with a new reference set. Nature genetics. 2012;44:6–7. doi: 10.1038/ng.1044. [DOI] [PMC free article] [PubMed] [Google Scholar]
- 9.Conde L, et al. Genome-wide association study of follicular lymphoma identifies a risk locus at 6p21.32. Nature genetics. 2010;42:661–4. doi: 10.1038/ng.626. [DOI] [PMC free article] [PubMed] [Google Scholar]
- 10.Consortium GP. A map of human genome variation from population-scale sequencing. Nature. 2010;467:1061–1073. doi: 10.1038/nature09534. [DOI] [PMC free article] [PubMed] [Google Scholar]
- 11.Howie BN, Donnelly P, Marchini J. A flexible and accurate genotype imputation method for the next generation of genome-wide association studies. PLoS genetics. 2009;5:e1000529. doi: 10.1371/journal.pgen.1000529. [DOI] [PMC free article] [PubMed] [Google Scholar]
- 12.Crowther-Swanepoel D, et al. Common genetic variation at 15q25.2 impacts on chronic lymphocytic leukaemia risk. British journal of haematology. 2011;154:229–33. doi: 10.1111/j.1365-2141.2011.08706.x. [DOI] [PubMed] [Google Scholar]
- 13.Rafnar T, et al. Sequence variants at the TERT-CLPTM1L locus associate with many cancer types. Nature genetics. 2009;41:221–7. doi: 10.1038/ng.296. [DOI] [PMC free article] [PubMed] [Google Scholar]
- 14.Shete S, et al. Genome-wide association study identifies five susceptibility loci for glioma. Nature genetics. 2009;41:899–904. doi: 10.1038/ng.407. [DOI] [PMC free article] [PubMed] [Google Scholar]
- 15.McKay JD, et al. Lung cancer susceptibility locus at 5p15.33. Nature genetics. 2008;40:1404–6. doi: 10.1038/ng.254. [DOI] [PMC free article] [PubMed] [Google Scholar]
- 16.Wang Y, et al. Common 5p15.33 and 6p21.33 variants influence lung cancer risk. Nature genetics. 2008;40:1407–9. doi: 10.1038/ng.273. [DOI] [PMC free article] [PubMed] [Google Scholar]
- 17.Petersen GM, et al. A genome-wide association study identifies pancreatic cancer susceptibility loci on chromosomes 13q22.1, 1q32.1 and 5p15.33. Nature genetics. 2010;42:224–8. doi: 10.1038/ng.522. [DOI] [PMC free article] [PubMed] [Google Scholar]
- 18.Haiman CA, et al. A common variant at the TERT-CLPTM1L locus is associated with estrogen receptor-negative breast cancer. Nature genetics. 2011;43:1210–4. doi: 10.1038/ng.985. [DOI] [PMC free article] [PubMed] [Google Scholar]
- 19.Kote-Jarai Z, et al. Seven prostate cancer susceptibility loci identified by a multi-stage genome-wide association study. Nature genetics. 2011;43:785–91. doi: 10.1038/ng.882. [DOI] [PMC free article] [PubMed] [Google Scholar]
- 20.Sheng X, et al. TERT polymorphisms modify the risk of acute lymphoblastic leukemia in Chinese children. Carcinogenesis. 2012 doi: 10.1093/carcin/bgs325. [DOI] [PubMed] [Google Scholar]
- 21.Yang J, et al. Common SNPs explain a large proportion of the heritability for human height. Nature genetics. 2010;42:565–9. doi: 10.1038/ng.608. [DOI] [PMC free article] [PubMed] [Google Scholar]
- 22.Lee SH, Wray NR, Goddard ME, Visscher PM. Estimating missing heritability for disease from genome-wide association studies. American journal of human genetics. 2011;88:294–305. doi: 10.1016/j.ajhg.2011.02.002. [DOI] [PMC free article] [PubMed] [Google Scholar]
- 23.Fisher GH, et al. Dominant interfering Fas gene mutations impair apoptosis in a human autoimmune lymphoproliferative syndrome. Cell. 1995;81:935–46. doi: 10.1016/0092-8674(95)90013-6. [DOI] [PubMed] [Google Scholar]
- 24.Drappa J, Vaishnaw AK, Sullivan KE, Chu JL, Elkon KB. Fas gene mutations in the Canale-Smith syndrome, an inherited lymphoproliferative disorder associated with autoimmunity. The New England journal of medicine. 1996;335:1643–9. doi: 10.1056/NEJM199611283352204. [DOI] [PubMed] [Google Scholar]
- 25.Straus SE, et al. The development of lymphomas in families with autoimmune lymphoproliferative syndrome with germline Fas mutations and defective lymphocyte apoptosis. Blood. 2001;98:194–200. doi: 10.1182/blood.v98.1.194. [DOI] [PubMed] [Google Scholar]
- 26.Baseggio L, et al. In non-follicular lymphoproliferative disorders, IGH/BCL2-fusion is not restricted to chronic lymphocytic leukaemia. British journal of haematology. 2012;158:489–498. doi: 10.1111/j.1365-2141.2012.09178.x. [DOI] [PubMed] [Google Scholar]
- 27.Cleary ML, Smith SD, Sklar J. Cloning and structural analysis of cDNAs for bcl-2 and a hybrid bcl-2/immunoglobulin transcript resulting from the t(14;18) translocation. Cell. 1986;47:19–28. doi: 10.1016/0092-8674(86)90362-4. [DOI] [PubMed] [Google Scholar]
- 28.Reshmi G, et al. C-T variant in a miRNA target site of BCL2 is associated with increased risk of human papilloma virus related cervical cancer--an in silico approach. Genomics. 2011;98:189–93. doi: 10.1016/j.ygeno.2011.06.005. [DOI] [PubMed] [Google Scholar]
- 29.Cheung VG, et al. Polymorphic cis- and trans-regulation of human gene expression. PLoS biology. 2010;8 doi: 10.1371/journal.pbio.1000480. [DOI] [PMC free article] [PubMed] [Google Scholar]
- 30.Strasser A, Harris AW, Cory S. E mu-bcl-2 transgene facilitates spontaneous transformation of early pre-B and immunoglobulin-secreting cells but not T cells. Oncogene. 1993;8:1–9. [PubMed] [Google Scholar]
- 31.Wensveen FM, et al. BH3-only protein Noxa regulates apoptosis in activated B cells and controls high-affinity antibody formation. Blood. 2012;119:1440–9. doi: 10.1182/blood-2011-09-378877. [DOI] [PubMed] [Google Scholar]
- 32.Smit LA, et al. Differential Noxa/Mcl-1 balance in peripheral versus lymph node chronic lymphocytic leukemia cells correlates with survival capacity. Blood. 2007;109:1660–8. doi: 10.1182/blood-2006-05-021683. [DOI] [PubMed] [Google Scholar]
- 33.Morales AA, et al. Expression and transcriptional regulation of functionally distinct Bmf isoforms in B-chronic lymphocytic leukemia cells. Leukemia: official journal of the Leukemia Society of America, Leukemia Research Fund, U K. 2004;18:41–7. doi: 10.1038/sj.leu.2403183. [DOI] [PubMed] [Google Scholar]
- 34.Labi V, et al. Loss of the BH3-only protein Bmf impairs B cell homeostasis and accelerates gamma irradiation-induced thymic lymphoma development. The Journal of experimental medicine. 2008;205:641–55. doi: 10.1084/jem.20071658. [DOI] [PMC free article] [PubMed] [Google Scholar]
- 35.Crowther-Swanepoel D, et al. Verification that common variation at 2q37.1, 6p25.3, 11q24.1, 15q23, and 19q13.32 influences chronic lymphocytic leukaemia risk. British journal of haematology. 2010;150:473–9. doi: 10.1111/j.1365-2141.2010.08270.x. [DOI] [PubMed] [Google Scholar]
- 36.Lan Q, et al. Genetic susceptibility for chronic lymphocytic leukemia among Chinese in Hong Kong. European journal of haematology. 2010;85:492–5. doi: 10.1111/j.1600-0609.2010.01518.x. [DOI] [PMC free article] [PubMed] [Google Scholar]
- 37.Nieters A, et al. PRRC2A and BCL2L11 gene variants influence risk of non-Hodgkin lymphoma: results from the InterLymph consortium. Blood. 2012 doi: 10.1182/blood-2012-05-427989. [DOI] [PMC free article] [PubMed] [Google Scholar]
- 38.Egle A, Harris AW, Bouillet P, Cory S. Bim is a suppressor of Myc-induced mouse B cell leukemia. Proceedings of the National Academy of Sciences of the United States of America. 2004;101:6164–9. doi: 10.1073/pnas.0401471101. [DOI] [PMC free article] [PubMed] [Google Scholar]
- 39.Kelly JL, et al. Germline variation in apoptosis pathway genes and risk of non-Hodgkin’s lymphoma. Cancer epidemiology, biomarkers & prevention. 2010;19:2847–58. doi: 10.1158/1055-9965.EPI-10-0581. [DOI] [PMC free article] [PubMed] [Google Scholar]
- 40.Cox A, et al. A common coding variant in CASP8 is associated with breast cancer risk. Nature genetics. 2007;39:352–8. doi: 10.1038/ng1981. [DOI] [PubMed] [Google Scholar]
- 41.Abnet CC, et al. Genotypic variants at 2q33 and risk of esophageal squamous cell carcinoma in China: a meta-analysis of genome-wide association studies. Human molecular genetics. 2012;21:2132–41. doi: 10.1093/hmg/dds029. [DOI] [PMC free article] [PubMed] [Google Scholar]
- 42.Barrett JH, et al. Genome-wide association study identifies three new melanoma susceptibility loci. Nature genetics. 2011;43:1108–13. doi: 10.1038/ng.959. [DOI] [PMC free article] [PubMed] [Google Scholar]
- 43.Enjuanes A, et al. Genetic variants in apoptosis and immunoregulation-related genes are associated with risk of chronic lymphocytic leukemia. Cancer research. 2008;68:10178–86. doi: 10.1158/0008-5472.CAN-08-2221. [DOI] [PubMed] [Google Scholar]
- 44.Lan Q, et al. Genetic variants in caspase genes and susceptibility to non-Hodgkin lymphoma. Carcinogenesis. 2007;28:823–7. doi: 10.1093/carcin/bgl196. [DOI] [PubMed] [Google Scholar]
- 45.Reya T, et al. A role for Wnt signalling in self-renewal of haematopoietic stem cells. Nature. 2003;423:409–14. doi: 10.1038/nature01593. [DOI] [PubMed] [Google Scholar]
- 46.Gutierrez A, Jr, et al. LEF-1 is a prosurvival factor in chronic lymphocytic leukemia and is expressed in the preleukemic state of monoclonal B-cell lymphocytosis. Blood. 2010;116:2975–83. doi: 10.1182/blood-2010-02-269878. [DOI] [PMC free article] [PubMed] [Google Scholar]
- 47.Cunnington MS, Santibanez Koref M, Mayosi BM, Burn J, Keavney B. Chromosome 9p21 SNPs Associated with Multiple Disease Phenotypes Correlate with ANRIL Expression. PLoS genetics. 2010;6:e1000899. doi: 10.1371/journal.pgen.1000899. [DOI] [PMC free article] [PubMed] [Google Scholar]
- 48.Koufos A, et al. Familial Wiedemann-Beckwith syndrome and a second Wilms tumor locus both map to 11p15.5. American journal of human genetics. 1989;44:711–9. [PMC free article] [PubMed] [Google Scholar]
- 49.Weksberg R, Shuman C, Beckwith JB. Beckwith-Wiedemann syndrome. European journal of human genetics. 2010;18:8–14. doi: 10.1038/ejhg.2009.106. [DOI] [PMC free article] [PubMed] [Google Scholar]
- 50.Morton LM, et al. Proposed classification of lymphoid neoplasms for epidemiologic research from the Pathology Working Group of the International Lymphoma Epidemiology Consortium (InterLymph) Blood. 2007;110:695–708. doi: 10.1182/blood-2006-11-051672. [DOI] [PMC free article] [PubMed] [Google Scholar]
- 51.Turner JJ, et al. InterLymph hierarchical classification of lymphoid neoplasms for epidemiologic research based on the WHO classification (2008): update and future directions. Blood. 2010;116:e90–8. doi: 10.1182/blood-2010-06-289561. [DOI] [PMC free article] [PubMed] [Google Scholar]
- 52.Pritchard JK, Stephens M, Donnelly P. Inference of population structure using multilocus genotype data. Genetics. 2000;155:945–59. doi: 10.1093/genetics/155.2.945. [DOI] [PMC free article] [PubMed] [Google Scholar]
- 53.Price AL, et al. Principal components analysis corrects for stratification in genome-wide association studies. Nature genetics. 2006;38:904–9. doi: 10.1038/ng1847. [DOI] [PubMed] [Google Scholar]
- 54.Ward LD, Kellis M. HaploReg: a resource for exploring chromatin states, conservation, and regulatory motif alterations within sets of genetically linked variants. Nucleic acids research. 2012;40:D930–4. doi: 10.1093/nar/gkr917. [DOI] [PMC free article] [PubMed] [Google Scholar]
- 55.Dixon AL, et al. A genome-wide association study of global gene expression. Nature genetics. 2007;39:1202–7. doi: 10.1038/ng2109. [DOI] [PubMed] [Google Scholar]
- 56.Stranger BE, et al. Population genomics of human gene expression. Nature genetics. 2007;39:1217–24. doi: 10.1038/ng2142. [DOI] [PMC free article] [PubMed] [Google Scholar]
- 57.Pharoah PD, et al. Polygenic susceptibility to breast cancer and implications for prevention. Nature genetics. 2002;31:33–6. doi: 10.1038/ng853. [DOI] [PubMed] [Google Scholar]
- 58.Yang J, Lee SH, Goddard ME, Visscher PM. GCTA: a tool for genome-wide complex trait analysis. American journal of human genetics. 2011;88:76–82. doi: 10.1016/j.ajhg.2010.11.011. [DOI] [PMC free article] [PubMed] [Google Scholar]
- 59.Fearnhead P. SequenceLDhot: detecting recombination hotspots. Bioinformatics. 2006;22:3061–6. doi: 10.1093/bioinformatics/btl540. [DOI] [PubMed] [Google Scholar]
- 60.Fearnhead P, Harding RM, Schneider JA, Myers S, Donnelly P. Application of coalescent methods to reveal fine-scale rate variation and recombination hotspots. Genetics. 2004;167:2067–81. doi: 10.1534/genetics.103.021584. [DOI] [PMC free article] [PubMed] [Google Scholar]
- 61.Li N, Stephens M. Modeling linkage disequilibrium and identifying recombination hotspots using single-nucleotide polymorphism data. Genetics. 2003;165:2213–33. doi: 10.1093/genetics/165.4.2213. [DOI] [PMC free article] [PubMed] [Google Scholar]
- 62.Crawford DC, et al. Evidence for substantial fine-scale variation in recombination rates across the human genome. Nature genetics. 2004;36:700–6. doi: 10.1038/ng1376. [DOI] [PubMed] [Google Scholar]
- 63.Luna A, Nicodemus KK. snp.plotter: an R-based SNP/haplotype association and linkage disequilibrium plotting package. Bioinformatics. 2007;23:774–6. doi: 10.1093/bioinformatics/btl657. [DOI] [PubMed] [Google Scholar]
Associated Data
This section collects any data citations, data availability statements, or supplementary materials included in this article.


