Abstract
Protein therapeutics have emerged as a major new class of pharmaceuticals. One important shelf-life-limiting factor of biopharmaceuticals is methionine oxidation, and therefore, it is important that analytical methods are able to thoroughly characterize all possible oxidized variants. Here, we present a fast and sensitive method to perform online methionine oxidation site assignment using granulocyte colony-stimulating factor (filgrastim) as a model. The method is based on top-down MS using the all-ion fragmentation mode of the Exactive benchtop mass spectrometer. Conditions that provide information on the intact mass of the protein as well as on fragment ions that allow unambiguous site assignment of methionine oxidation in filgrastim variants as low as 0.12 % of total peak area in a chromatographic time scale were identified. Using this method, we performed methionine oxidation site assignment in H2O2-stressed filgrastim and in filgrastim which was stored at intended conditions, respectively. We show that the relative abundance of oxidation species observed in filgrastim stored under intended conditions differs strikingly from the oxidized species observed after H2O2 stress. Additionally, we report an oxidized filgrastim variant that has not been previously described in the literature.
Figure.
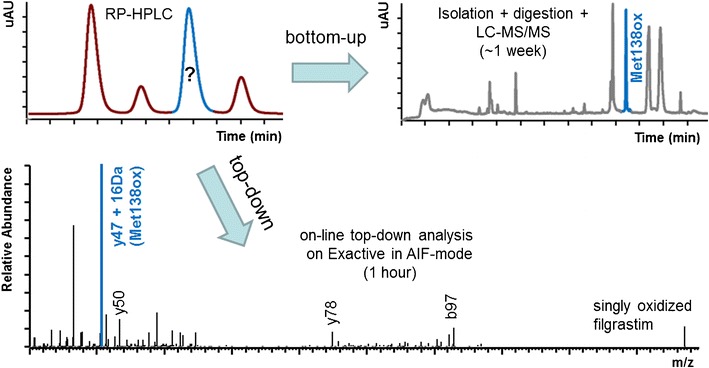
A top-down approach on an Exactive benchtop mass spectrometer in all-ion fragmentation mode is a highly attractive alternative to the traditional approach of isolation/bottom-up analysis for methionine oxidation site assignement in biopharmaceuticals. With a sensitivity as low as 0.12 % of total peak area and a throughput of about one sample per hour, the method is highly suitable for a thorough characterization of oxidized methionine residues
Keywords: G-CSF, Filgrastim, Mass spectrometry, All-ion fragmentation, Top-down MS, Methionine oxidation, Site assignment
Introduction
Granulocyte colony-stimulating factor (G-CSF) is a hematopoietic growth factor and cytokine that stimulates the production of neutrophils and affects neutrophil progenitor proliferation, differentiation, and cell functional activation [1, 2]. Recombinant human G-CSF (rhG-CSF; INN filgrastim) expressed in Escherichia coli was one of the first biopharmaceuticals to be commercialized (Neupogen®; Amgen Inc.). It is a 175-amino acid long non-glycosylated polypeptide with an additional N-terminal methionine residue not found in the native endogenous human protein. Filgrastim is largely used to treat neutropenia as well as infectious complications, which can be associated with chemotherapy [3, 4]. Following the patent expiration of the reference product in the European Union, three biosimilar filgrastims have been approved [5], one of which is Zarzio® (Sandoz). Due to the introduction of more affordable biosimilar versions of filgrastim, some countries have managed to move filgrastim back to prophylactic use in order to reduce the incidence of febrile neutropenia after chemotherapy, thereby preventing hospital readmission due to infections [6–9]. Patient-friendly application devices together with new formulations are crucial to further enhance patient access. Their development, however, requires close monitoring of filgrastim-related impurities that occur due to physical or chemical degradation of the protein.
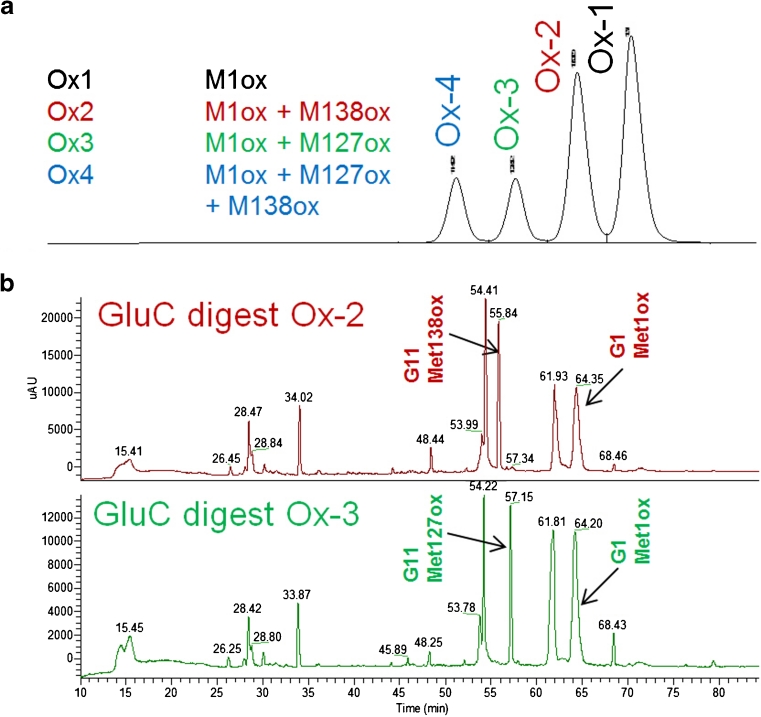
One important shelf-life-limiting degradation product of filgrastim is the oxidation of methionine residues to their sulfoxide derivatives. Filgrastim contains four methionine residues (Met1, Met122, Met127, and Met138) and an extensive body of literature is available on the analytical and biological characterization of H2O2-induced oxidized variants [10–15]. Quantification of methionine oxidation in proteins is usually performed by reverse-phase HPLC (RP-HPLC). Since each of the four methionine residues in filgrastim is susceptible to oxidation, it is important that analytical methods are able to thoroughly characterize all possible oxidized variants. Assignment of the methionine oxidation site is routinely performed by isolation of individual oxidized species and subsequent enzymatic (e.g., GluC) or chemical (e.g., CNBr) cleavage of the protein (bottom-up approach). The resulting peptides are then subjected to liquid chromatography–mass spectrometry (LC-MS) analysis (Fig. 1).
Fig. 1.
The classic approach for the assignment of methionine oxidation involves isolation of the individual oxidized species and subsequent peptide mapping using a specific protease (e.g., GluC). (a) Chromatographic separation of oxidized filgrastim variants following H2O2 treatment. (b) Peptide mapping of Ox-2 and Ox-3 fractions demonstrating unique oxidation peak whose site assignment could be elucidated using MS and MS/MS analysis (peaks labeled according to theoretical digest, e.g., G1 represents the first peptide of a GluC digest; mass spectrometry data are not shown)
Site assignment of methionine oxidation using this workflow has two major drawbacks: (1) a substantial amount of sample is required to allow variant fractionation and subsequent peptide mapping (especially for low abundant variants) and (2) the procedure is time consuming, due to elongated sample preparation and LC-MS analysis. Hence, there exists a need for a fast and sensitive method for oxidation site assignment in biopharmaceuticals such as filgrastim.
With the continuous improvement in instrumentation and data analysis software, top-down MS is becoming a highly attractive method for the characterization of proteins [16–21]. The Orbitrap family of MS analyzers is a popular and powerful tool for protein characterization due to its capabilities of high resolution and high mass accuracy. Top-down MS using this instrumentation has mostly been reported for proteins with molecular weights <30 kDa, but has also been successfully implemented for larger proteins up to the size of intact antibodies (∼150 kDa), albeit with lower resolution settings [22–27].
Herein, we report—for the first time—a top-down approach on a benchtop Exactive mass spectrometer for online methionine oxidation site assignment in a biopharmaceutical, using the microbially produced drug filgrastim. The method provides information on the intact mass of the protein variant as well as on fragment ions that allow unambiguous site assignment of methionine oxidation necessary for site-specific quantification of methionine oxidation via UV. Using this top-down approach, we also characterized an oxidized filgrastim variant that has not been previously reported in the literature.
Materials and methods
Chemicals and study material
All chemicals purchased were of highest purity available. Trifluoroacetic acid was obtained from Sigma-Aldrich (Steinheim, Germany). HPLC grade water and acetonitrile were purchased from J.T. Baker (Deventer, The Netherlands). Forced oxidation using H2O2 was performed on Sandoz filgrastim drug product (Zarzio®, formulation A) produced in house; the same batch of Zarzio® was used for selection of the diagnostic fragment ions (Figs. 2, 3, and 4). For online Met oxidation site assignment in samples stored under intended conditions (Fig. 5), Sandoz filgrastim development samples (formulation B) and Neupogen® were used. Neupogen® was sourced from Amgen (Amgen Inc., Thousand Oaks, CA) and stored under intended storage conditions.
Fig. 2.
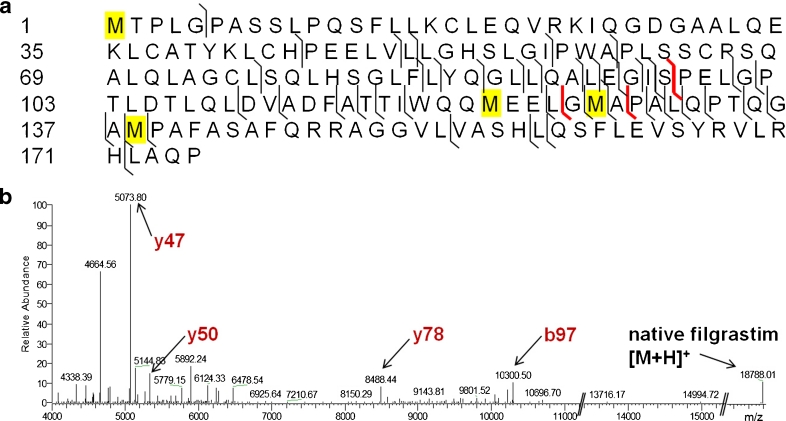
Sandoz filgrastim drug product (Zarzio®) is a biosimilar of filgrastim (recombinant human granulocyte colony-stimulation factor (rhG-CSF)) and has a molecular weight of 18.8 kDa. It contains four Met residues at positions 1, 122, 127, and 138 (highlighted in yellow). (a) Sequence coverage generated by HCD with 35 eV. (b) Deconvoluted HCD spectra of Sandoz filgrastim drug product (Zarzio®). The fragment ions y47, y50, y78, and b97 allow assignment of all four Met residues (highlighted in red), which can be oxidized under stressed conditions
Fig. 3.
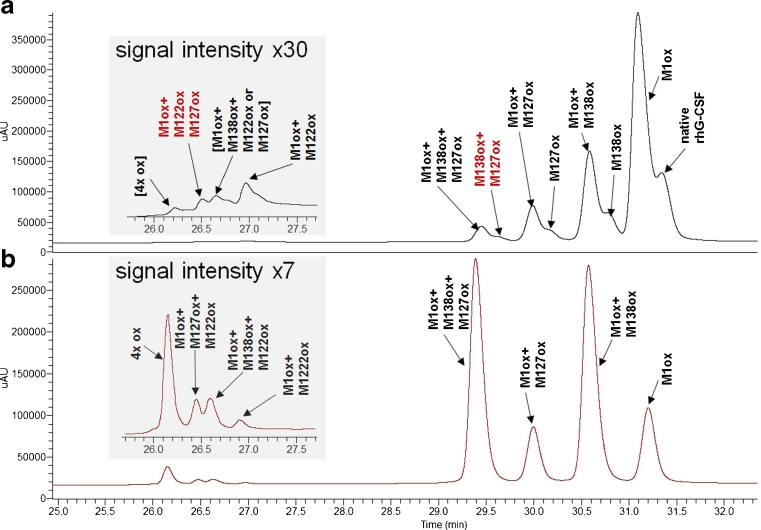
Sandoz filgrastim drug product (Zarzio®), a biosimilar filgrastim, was subjected to oxidation with (a) 0.1 % and (b) 0.5 % final concentration of H2O2, separated on a RP C18 column and electrosprayed into an Exactive mass spectrometer. Peak assignment was performed by detection of diagnostic ions following HCD fragmentation at 35 eV. Peaks labeled in brackets indicate missing fragment ions due to low abundance. The HCD spectra of peaks labeled in red are shown in Fig. 4. The site of Met oxidation can be unambiguously assigned in peaks as low as 0.70 % of total peak area (M138ox + M127ox)
Fig. 4.
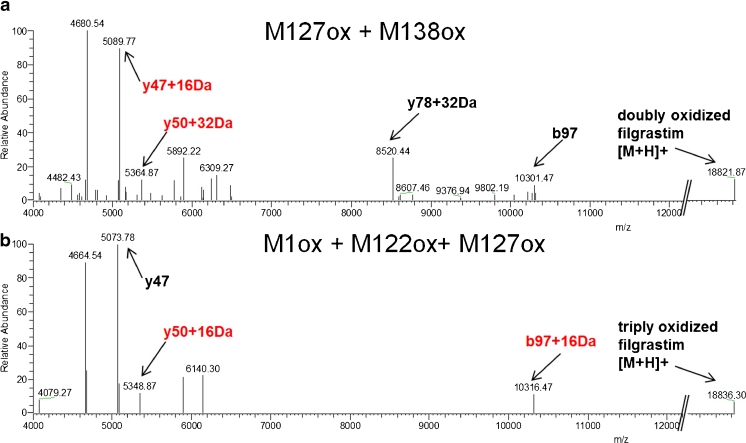
HCD spectra of low abundance oxidized filgrastim variants labeled in red in Fig. 3. (a) The diagnostic fragment ions for M127ox + M138ox (y47 + 16 Da and y50 + 32 Da) were unambiguously identified in the HCD spectra despite representing only 0.7 % of the total peak area. (b) Due to the low abundance of the triply oxidized variant, which represents 0.12 % of the total peak area, the diagnostic fragment ion y78 is missing. However, the combination of native mass (18,788.01 + 48.3) and diagnostic ions y47, y50 + 16 Da, and b97 + 16 Da allows the sites of oxidation to be elucidated
Fig. 5.
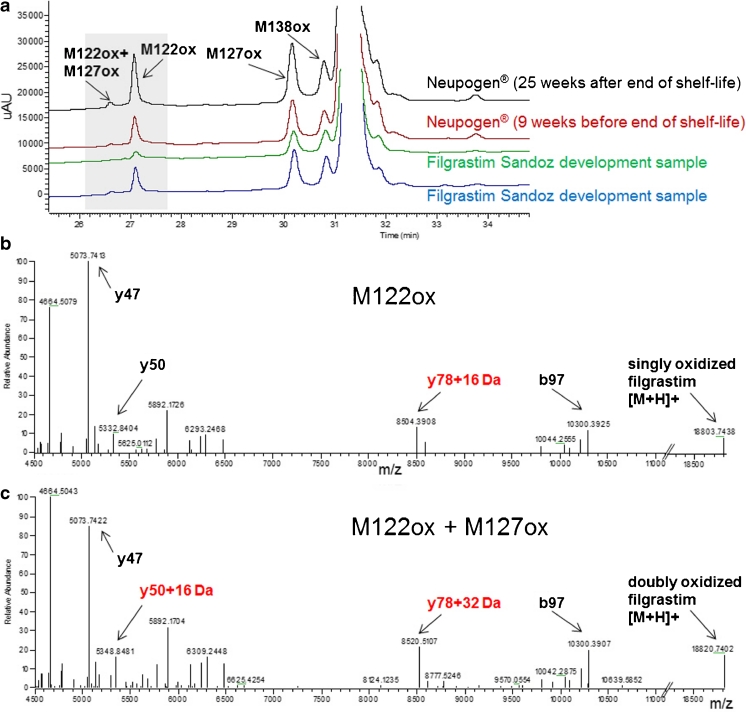
(a) UV chromatogram of Neupogen® (black trace; analysis performed 25 weeks after end-of-shelf-life, red trace analysis performed 9 weeks before end-of-shelf-life, stored at 5 ± 3 °C) and filgrastim Sandoz development samples (green and blue traces, stored for 34 weeks at 5 ± 3 °C). (b) HCD spectrum of variant peak eluting at 27.2 min and (c) HCD spectrum of variant eluting at 26.8 min
Direct infusion of filgrastim and MS analysis
Sandoz filgrastim drug product (Zarzio®, formulation A) was buffer exchanged into water using Microcon YM-3 centrifugal filter devices (Millipore, Bedford, MA) and diluted with a solution of 50 % acetonitrile (ACN) in 0.1 % trifluoroacetic acid (TFA) to a final concentration of 1.1 mg/ml. A 500-μl Hamilton syringe was used to infuse the sample directly into the Exactive mass spectrometer at a flow rate of 10 μl/min. The Exactive MS was operated in an all-ion fragmentation (AIF) mode with the following settings applied: spray voltage 4 kV, capillary temperature 275 °C, sheath gas 20, aux gas 8, scan range 200–2,000 m/z, resolution ultra high, AGC target 1e6, max inject time 100 ms, and microscans 10. Higher energy collision dissociation (HCD) fragmentation energy was manually varied between 15 and 45 eV. For data evaluation, spectra acquired within a time frame of approximately 10 s were averaged and deconvoluted using the Xtract algorithm implemented into Xaclibur 2.1 Software (Thermo Scientific, Bremen, Germany). The following parameters were used for deconvolution: S/N threshold 2, fit factor 44 %, remainder 25 %, and max charge 20. The assignment of deconvoluted AIF spectra was done manually using GPMAW 9.02 software (Lighthouse data, Odense, Denmark) to predict the masses of the individual fragment ions.
HPLC separation and all-ion fragmentation on Exactive MS
Nine micrograms of Sandoz filgrastim development sample (drug product, formulation B), Sandoz filgrastim drug product (Zarzio®; formulation A), and Neupogen®, respectively, was separated on a Zorbax 300SB-C18 column (4.6 × 150 mm, 3.5 μm particle size) with a gradient of solutions A (0.1 % TFA in water) and B (0.1%TFA in ACN) at a flow rate of 1 ml/min: 25 min from 25 % B to 54 % B followed by a 32-min gradient from 54 % B to 73 % B. After UV and fluorescence detection, the flow was split 1:5 and then electrosprayed into the Exactive MS. The mass spectrometer was again operated in the AIF mode with settings applied as discussed above, except that the mass range was set to 300 to 2,200 m/z. Deconvolution and data interpretation were performed as described above.
Results
Selection of diagnostic fragment ions
Direct infusion experiments using desalted filgrastim were carried out for the selection of diagnostic fragment ions and the optimization of HCD settings. Figure 2 shows the sequence coverage and representative HCD spectrum obtained using our top-down analysis of Sandoz filgrastim drug product (Zarzio®), a biosimilar filgrastim, stored under intended storage conditions.
Despite sequence coverage of only 25 %, all-ion fragmentation in the C-trap of the Exactive instrument produced fragment ions (highlighted in red in Fig. 2a) that allowed the discrimination of all four oxidized methionine residues found in filgrastim with reasonable intensity (Fig. 2b). Fragment ion y47 (theoretical mass of 5,073.71 Da) is the most abundant ion found in the HCD spectrum and is diagnostic for Met138. Fragment ion y50 (theoretical mass of 5,332.81 Da) contains Met127 and Met138, which, after considering the mass of y47, is diagnostic for Met127. Similarly, fragment ion y78 (theoretical mass of 8,488.35 Da) contains three methionine residues, Met122, Met127, and Met138, but becomes diagnostic for Met122 af0ter considering the masses of y50 and y47. Finally, fragment ion b97 (theoretical mass of 10,300.34 Da) is diagnostic for Met1. In addition to the diagnostic ions, we also observed some unfragmented parent ion which allowed the simultaneous measurement of the intact mass of filgrastim (theoretical monoisotopic mass [M+H]+ of 18,787.68 Da). The average mass deviation over all measured fragment ions was 11 ppm. As an alternative approach, we also tested in-source collision-induced dissociation, but were not able to detect fragment ions that could discriminate between methionines at positions 127 and 138 (data not shown). From Fig. 1b, it can be deduced that the sensitivity of the HCD method is limited by the intensity of fragments y50, y78, and b97. To optimize the generation of these limiting ions, filgrastim was subjected to higher energy collision dissociation using different acceleration potentials. By testing increasing collision potentials, fragmentation with 35 eV was selected as the best compromise between decreasing b97 intensity and increasing y78 intensity (Table 1).
Table 1.
For optimization of HCD, Sandoz filgrastim drug product (Zarzio®) was subjected to fragmentation in the C-trap using different acceleration potentials. Listed are intensities of selected fragment ions relative to the highest signal in the spectrum (y47). 35 eV was selected as the best compromise between decreasing b97 intensity and increasing y78 intensity upon increase of acceleration potential
| Fragment ion | Mass [Da] | Diagnostic for | HCD 22 eV | HCD 28 eV | HCD 35 eV | HCD 40 eV |
|---|---|---|---|---|---|---|
| b97 | 10,300.3 | Met1 | 5 | 5 | 4 | 1 |
| y78 | 8,488.4 | Met122 (considering y50 and y47) | 0 | 3 | 5 | 5 |
| y50 | 5,332.8 | Met127 (considering y47) | 18 | 20 | 20 | 22 |
| y47 | 5,073.7 | Met138 | 100 | 100 | 100 | 100 |
Online Met oxidation site assignment in H2O2-stressed filgrastim
To simulate oxidative stress conditions, Sandoz filgrastim drug product (Zarzio®) was treated with 0.1 and 0.5 % H2O2, respectively, final concentration of H2O2. Oxidized filgrastim variants were separated by RP-HPLC and online methionine oxidation site assignment was performed using our top-down method on a benchtop Exactive MS. Oxidation of filgrastim under these conditions produced a number of oxidized variants that were separated by RP-HPLC (Fig. 3).
Oxidation site assignment using our top-down approach was possible for all detected oxidized filgrastim variants. Figure 4 shows two examples of HCD spectra used for the site assignment of methionine oxidation (variants labeled in red in Fig. 3a).
In Fig. 4a, the HCD spectrum of variant denoted as Met138ox + Met127ox (0.1 % H2O2 stress) is shown. Despite the fact that this low abundance variant represents only 0.70 % of total peak area (see Fig. 3a), all diagnostic fragment ions as well as the intact mass of the protein were detected, albeit with higher mass errors for the low intensity fragments. For example, while the high-intensity fragment ion y47 + 16 Da exhibited a mass error of 13 ppm, the measured mass of the intact protein deviated by 2.1 Da from its theoretical mass. This high mass deviation for the intact protein could be explained by an isotope shift introduced by the deconvolution software due to low signal intensity. In conclusion, the data show that this filgrastim variant is doubly oxidized at residues Met127 and Met138. Figure 4b shows the HCD spectrum of the variant denoted as Met1ox + Met122ox + Met127ox (0.1 % H2O2, labeled in red in Fig. 3a). Due to the low abundance of this variant which represents only 0.12 % of total peak area, the diagnostic ion y78 + 32 Da is missing. However, by considering the parent ion mass measurement, which is 48.3 Da heavier than the non-oxidized filgrastim parent ion, together with the diagnostic ions y47, y50 + 16 Da, and b97 + 16 Da allowed us to conclude that this filgrastim variant is triply oxidized at residues Met1, Met122, and Met127. For two very low abundant impurities observed in 0.1 % H2O2 stress, the native mass of the variant denoted with [Met1ox + Met138ox + Met122ox or Met127ox] was in agreement with triply oxidized filgrastim; however, fragment ions representing the oxidation state at y50 and y78 were missing, thus impairing position assignment. The abundance of the variant labeled with [4× ox] in the 0.1 % H2O2 sample was too low to allow charge determination in the HCD spectrum and subsequent deconvolution of the tenfold-charged parent ion (theoretical average mass of native filgrastim is 1,880.89 Th in the tenfold charge state). However, a signal was detected at 1,187.30 Th, which is close to the mass of the tenfold-charged parent ion +4× 16 Da, suggesting the presence of filgrastim with all four methionine residues oxidized (not shown). Unambiguous oxidation site assignment of 4× oxidized filgrastim was possible in 0.5 % H2O2-stressed sample where these variants were more abundant (data not shown). While its implications remain unclear, it is interesting to note that in the H2O2-stressed samples, oxidation at Met122 was only observed in combination with oxidation at other methionine residues. Noteworthy, oxidation of Met122 resulted in a major shift in RP-HPLC retention time.
Isolated Met122 oxidation in biosimilar and originator filgrastim stored under intended conditions
In the process of characterizing new formulations of filgrastim being developed (Sandoz filgrastim development sample, formulation B), two new variants were observed. These new variants eluted much earlier in RP-HPLC (Fig. 5a), suggesting oxidation at Met122 alone or in combination with other methionine residues. Fragment ion analysis was able to confirm that the identity of the major unique peak is in fact a filgrastim variant with a singly oxidized Met122 residue (Fig. 5b). In addition, we identified a very low abundant variant as Met122 plus Met127 oxidation.
Isolated Met122 has been reported by Reubsaet et al. [12] in H2O2-stressed samples. However, data on G-CSF oxidation behavior published more recently as well as our data strongly suggest that the oxidized variant denoted as oxidized Met122 by Reubsaet and colleagues is actually oxidized Met1.
Therefore, this is the first report of a filgrastim variant with an isolated oxidation of Met122. Noteworthy, both variants were detected in filgrastim Sandoz development samples (Fig. 5, green and blue traces) as well as in Neupogen® (Fig. 5a, black and red traces).
Discussion
In filgrastim, oxidation of methionine residues to their sulfoxide derivatives is an important degradation pathway and might become the shelf-life-limiting factor. Therefore, it is necessary to thoroughly characterize oxidized filgrastim variants. Oxidation of a particular methionine residue can depend on its solvent accessibility. While Met1, Met138, and Met127 can interact with solvent molecules, Met122 is located at a hydrophobic region of the protein [28–30]. Oxidation of Met122 was described as relatively slow and affected by the oxidation of Met127. The oxidation of Met122 independent from the oxidation of Met127 was confirmed in filgrastim mutants where Met127 was substituted for a leucine residue (M127L variant), although with very slow oxidation rates [10].
In agreement with structural data and with earlier reports, this study demonstrates Met1 to be most susceptible to H2O2-induced oxidation, followed by Met138 and Met127 [10, 11, 28–31]. In H2O2-stressed samples, oxidation of Met122 accounted for only a minor fraction of the detected impurities (slow oxidation rate) and was always associated with the oxidation of at least another methionine residue. Interestingly, single oxidation at Met122 was observed in our filgrastim biosimilar development samples as well as in originator batches of Neupogen® stored at indicated conditions. As shown in Fig. 5a, the degree of single oxidation of Met122 in these samples was comparable to the amount of single oxidation at Met127 or Met138 and approximately tenfold more abundant than filgrastim with dual oxidation at both Met122 and Met127. Although the kinetics of these oxidation events has not been characterized in this study, the steady-state oxidation species observed in filgrastim stored under clinically relevant conditions differs strikingly from the kinetics reported for H2O2-induced oxidation, which follows the order Met1 > Met138 > Met127 >> Met122 [10, 11, 32]. Therefore, H2O2 stress does not fully reflect the oxidative mechanisms which dominate during storage. Met122 is located at the hydrophobic core of filgrastim and its oxidation could induce a conformational change, possibly explaining the strong shift observed in retention time [28–30]. Interestingly, despite the likelihood of conformational changes associated with Met122 oxidation, previous studies in which Met122 was specifically oxidized using filgrastim mutants demonstrated that Met122 oxidation has only a minor effect on the biological activity [10]. However, given the fact that the rate of Met122 oxidation depends on the formulation buffer, oxidation of Met122 should be closely monitored, especially when aiming to develop a new buffer system [14, 15].
Rapid site assignment of this new oxidized filgrastim variant was possible with the use of a novel top-down approach using a benchtop mass spectrometer. This Exactive instrument is a recently introduced stand-alone Orbitrap analyzer and offers top-down capabilities using AIF in the instrument HCD cell, allowing high resolution and mass accuracy in both the full scan and AIF mode in a robust and economical format [32]. AIF does not allow the targeted selection of a specific precursor ion; therefore, it requires reasonably pure proteins for analysis. While this is certainly a problem in complex samples (e.g., periplasmic fractions), the impurities detected in the final product are sufficiently separated by RP-HPLC before MS detection. In fact, the AIF might lead to a higher sensitivity because parent ions from all charge states are subjected to fragmentation, while in “true” MS/MS approaches, only parent ions from a single charge state are selected for dissociation, limiting the detection capability. However, future experiments will have to be carried out to determine actual differences in method sensitivity. Based on our data, the limit of oxidation site assignment from RP-HPLC-separated filgrastim variants lies between 0.12 % (Fig. 4b) and 0.70 % (Fig. 4a) of total peak area. Compared to traditional isolation/bottom-up approaches, the high sensitivity of our top-down method translates into significantly lower sample requirements for characterization (10 μg per analysis for top-down compared to 2 mg for bottom-up, assuming a variant of ∼1 % abundance). Furthermore, because our method allows direct online analysis of RP-HPLC eluents, the time required for characterization was significantly shortened from about 1 week (for isolation, digestion, and MS analysis) to 1 h.
Conclusion
The top-down approach outlined in this study describes a highly attractive alternative to the traditional approach of isolation/bottom-up analysis for methionine oxidation site assignment in biopharmaceuticals. With a demonstrated sensitivity as low as 0.12 % of total peak area and a throughput of about one sample per hour, the described method is highly suitable for a thorough characterization of oxidized methionine residues in, e.g., formulation development. With respect to instrumentation, this work shows that the Exactive benchtop mass spectrometer operated in all-ion fragmentation mode is a sensitive and economic tool for online top-down characterization of less complex samples such as microbial derived biopharmaceuticals and their degradation products.
Acknowledgments
We would like to thank Jan Visser, Martin Schiestl, and William Lamanna from Sandoz Biopharmaceuticals for their thorough review and support.
Contributor Information
Johann Holzmann, Phone: +43-5338-2002060, Email: johann.holzmann@sandoz.com.
Hansjoerg Toll, Phone: +43-5338-2009031, Email: hansjoerg.toll@sandoz.com.
References
- 1.Metcalf D. Cell. 1985;43:5–6. doi: 10.1016/0092-8674(85)90004-2. [DOI] [PubMed] [Google Scholar]
- 2.Nemunaitis J. Drugs. 1997;54:709–729. doi: 10.2165/00003495-199754050-00004. [DOI] [PubMed] [Google Scholar]
- 3.Aapro MS, Bohlius J, Cameron DA, Dal LL, Donnelly JP, Kearney N, Lyman GH, Pettengell R, Tjan-Heijnen VC, Walewski J, Weber DC, Zielinski C. Eur J Cancer. 2011;47:8–32. doi: 10.1016/j.ejca.2010.10.013. [DOI] [PubMed] [Google Scholar]
- 4.Dale DC. Drugs. 2002;62(1):1–15. doi: 10.2165/00003495-200262001-00001. [DOI] [PubMed] [Google Scholar]
- 5.Gascon P. Target Oncol. 2012;7(1):S29–S34. doi: 10.1007/s11523-011-0190-9. [DOI] [PMC free article] [PubMed] [Google Scholar]
- 6.Sorgel F, Lerch H, Lauber T. BioDrugs. 2010;24:347–357. doi: 10.2165/11585100-000000000-00000. [DOI] [PubMed] [Google Scholar]
- 7.Aapro M, Cornes P, Abraham I. J Oncol Pharm Pract. 2012;18:171–179. doi: 10.1177/1078155211407367. [DOI] [PubMed] [Google Scholar]
- 8.Salesi N, Di CB, Colonna M, Veltri E. Future Oncol. 2012;8:625–630. doi: 10.2217/fon.12.32. [DOI] [PubMed] [Google Scholar]
- 9.McCamish M, Woollett G. Clin Pharmacol Ther. 2012;91:405–417. doi: 10.1038/clpt.2011.343. [DOI] [PubMed] [Google Scholar]
- 10.Lu HS, Fausset PR, Narhi LO, Horan T, Shinagawa K, Shimamoto G, Boone TC. Arch Biochem Biophys. 1999;362:1–11. doi: 10.1006/abbi.1998.1022. [DOI] [PubMed] [Google Scholar]
- 11.Pan B, Abel J, Ricci MS, Brems DN, Wang DI, Trout BL. Biochemistry. 2006;45:15430–15443. doi: 10.1021/bi061855c. [DOI] [PubMed] [Google Scholar]
- 12.Reubsaet JL, Beijnen JH, Bult A, Hop E, Scholten SD, Teeuwsen J, Underberg WJ. J Pharm Biomed Anal. 1998;17:283–289. doi: 10.1016/S0731-7085(97)00199-4. [DOI] [PubMed] [Google Scholar]
- 13.Skrlin A, Kosor KE, Gosak D, Prester B, Mrsa V, Vuletic M, Runac D. J Pharm Biomed Anal. 2010;53:262–268. doi: 10.1016/j.jpba.2010.02.006. [DOI] [PubMed] [Google Scholar]
- 14.Yin J, Chu JW, Ricci MS, Brems DN, Wang DI, Trout BL. Pharm Res. 2004;21:2377–2383. doi: 10.1007/s11095-004-7692-4. [DOI] [PubMed] [Google Scholar]
- 15.Yin J, Chu JW, Ricci MS, Brems DN, Wang DI, Trout BL. Pharm Res. 2005;22:141–147. doi: 10.1007/s11095-004-9019-x. [DOI] [PubMed] [Google Scholar]
- 16.Kellie JF, Tran JC, Lee JE, Ahlf DR, Thomas HM, Ntai I, Catherman AD, Durbin KR, Zamdborg L, Vellaichamy A, Thomas PM, Kelleher NL. Mol Biosyst. 2010;6:1532–1539. doi: 10.1039/c000896f. [DOI] [PMC free article] [PubMed] [Google Scholar]
- 17.Macht M. Bioanalysis. 2009;1:1131–1148. doi: 10.4155/bio.09.93. [DOI] [PubMed] [Google Scholar]
- 18.Zhou H, Ning Z, Starr AE, Abu-Farha M, Figeys D. Anal Chem. 2012;84:720–734. doi: 10.1021/ac202882y. [DOI] [PubMed] [Google Scholar]
- 19.Chen G, Warrack BM, Goodenough AK, Wei H, Wang-Iverson DB, Tymiak AA. Drug Discov Today. 2011;16:58–64. doi: 10.1016/j.drudis.2010.11.003. [DOI] [PubMed] [Google Scholar]
- 20.Reid GE, McLuckey SA. J Mass Spectrom. 2002;37:663–675. doi: 10.1002/jms.346. [DOI] [PubMed] [Google Scholar]
- 21.Breuker K, Jin M, Han X, Jiang H, McLafferty FW. J Am Soc Mass Spectrom. 2008;19:1045–1053. doi: 10.1016/j.jasms.2008.05.013. [DOI] [PMC free article] [PubMed] [Google Scholar]
- 22.Tran JC, Zamdborg L, Ahlf DR, Lee JE, Catherman AD, Durbin KR, Tipton JD, Vellaichamy A, Kellie JF, Li M, Wu C, Sweet SM, Early BP, Siuti N, LeDuc RD, Compton PD, Thomas PM, Kelleher NL. Nature. 2011;480:254–258. doi: 10.1038/nature10575. [DOI] [PMC free article] [PubMed] [Google Scholar]
- 23.Mazur MT, Seipert RS, Mahon D, Zhou Q, Liu T. AAPS J. 2012;14:530–541. doi: 10.1208/s12248-012-9361-6. [DOI] [PMC free article] [PubMed] [Google Scholar]
- 24.Zhang Z, Shah B. Anal Chem. 2007;79:5723–5729. doi: 10.1021/ac070483q. [DOI] [PubMed] [Google Scholar]
- 25.Zhang J, Liu H, Katta V. J Mass Spectrom. 2010;45:112–120. doi: 10.1002/jms.1700. [DOI] [PubMed] [Google Scholar]
- 26.Bondarenko PV, Second TP, Zabrouskov V, Makarov AA, Zhang Z. J Am Soc Mass Spectrom. 2009;20:1415–1424. doi: 10.1016/j.jasms.2009.03.020. [DOI] [PubMed] [Google Scholar]
- 27.Macek B, Waanders LF, Olsen JV, Mann M. Mol Cell Proteomics. 2006;5:949–958. doi: 10.1074/mcp.T500042-MCP200. [DOI] [PubMed] [Google Scholar]
- 28.Hill CP, Osslund TD, Eisenberg D. Proc Natl Acad Sci U S A. 1993;90:5167–5171. doi: 10.1073/pnas.90.11.5167. [DOI] [PMC free article] [PubMed] [Google Scholar]
- 29.Werner JM, Breeze AL, Kara B, Rosenbrock G, Boyd J, Soffe N, Campbell ID. Biochemistry. 1994;33:7184–7192. doi: 10.1021/bi00189a022. [DOI] [PubMed] [Google Scholar]
- 30.Aritomi M, Kunishima N, Okamoto T, Kuroki R, Ota Y, Morikawa K. Nature. 1999;401:713–717. doi: 10.1038/44394. [DOI] [PubMed] [Google Scholar]
- 31.Chu JW, Yin J, Wang DI, Trout BL. Biochemistry. 2004;43:1019–1029. doi: 10.1021/bi0356000. [DOI] [PubMed] [Google Scholar]
- 32.Geiger T, Cox J, Mann M. Mol Cell Proteomics. 2010;9:2252–2261. doi: 10.1074/mcp.M110.001537. [DOI] [PMC free article] [PubMed] [Google Scholar]


