

Abstract
The binding of transcription factors (TFs) to their specific motifs in genomic regulatory regions is commonly studied in isolation. However, in order to elucidate the mechanisms of transcriptional regulation, it is essential to determine which TFs bind DNA cooperatively as dimers and to infer the precise nature of these interactions. So far, only a small number of such dimeric complexes are known. Here, we present an algorithm for predicting cell-type–specific TF–TF dimerization on DNA on a large scale, using DNase I hypersensitivity data from 78 human cell lines. We represented the universe of possible TF complexes by their corresponding motif complexes, and analyzed their occurrence at cell-type–specific DNase I hypersensitive sites. Based on ∼1.4 billion tests for motif complex enrichment, we predicted 603 highly significant cell-type–specific TF dimers, the vast majority of which are novel. Our predictions included 76% (19/25) of the known dimeric complexes and showed significant overlap with an experimental database of protein–protein interactions. They were also independently supported by evolutionary conservation, as well as quantitative variation in DNase I digestion patterns. Notably, the known and predicted TF dimers were almost always highly compact and rigidly spaced, suggesting that TFs dimerize in close proximity to their partners, which results in strict constraints on the structure of the DNA-bound complex. Overall, our results indicate that chromatin openness profiles are highly predictive of cell-type–specific TF–TF interactions. Moreover, cooperative TF dimerization seems to be a widespread phenomenon, with multiple TF complexes predicted in most cell types.
Transcription factors (TFs) typically bind the human genome in clusters to form regulatory complexes (Berman et al. 2002). However, not much is known about the precise biochemical determinants of clustered TF binding. Moreover, the ability of TFs that have relatively low sequence specificity in vitro to bind with high specificity in vivo is one of the long-standing paradoxes of regulatory genomics.
One explanation for the above observations is provided by focal chromatin openness at regulatory elements, which attracts multiple TFs to the same stretch of genomic DNA, and is further reinforced by their cobinding. Such indirect cooperativity between proximal binding sites is mostly nonspecific, since it applies in principle to any TF pair (Adams and Workman 1995). Moreover, such cobinding TFs are only subject to the “fuzzy” spacing constraint of proximity (Hannenhalli and Levy 2002; Yu et al. 2006).
Another biochemical mechanism is direct cooperativity, as exemplified by homo- or heterodimerization of specific pairs of TFs on DNA. Note that this mechanism also applies to higher-order complexes of three or more TFs. However, for simplicity, we will henceforth only refer to TF “dimers.” Intuitively, one would hypothesize that such dimeric complexes should bind DNA with rigid or semi-rigid spacing (as opposed to variable or fuzzy spacing) due to the steric constraints imposed by protein–protein interaction. However, the actual prevalence of spacing constraints in vivo remains unknown due to the lack of comprehensive data. Important examples of direct cooperativity include the p53 (TP53) homotetramer (Friedman et al. 1993), the NF-κB (NFKB) heterodimer (Chen et al. 1998a), various bHLH dimers (De Masi et al. 2011), SOX2–POU5F1 (OCT4) dimerization in embryonic stem cells (Chen et al. 2008), and AR–FOXA1 dimerization in prostate cancer cells (Wang et al. 2011). Clearly, binding of dimeric TF complexes to DNA is central to gene regulation in many well-studied biological contexts. In addition to its role in facilitating TF clusters, direct cooperativity provides a simple resolution to the paradox of binding specificity. However, little is known about the overall extent and tissue specificity of TF dimers in the human genome.
Here we present a method for comprehensively predicting cell-type–specific TF dimerization based on TF affinity motifs and DNase I hypersensitivity profiles in 78 human cell types (The ENCODE Project Consortium 2011). Uniquely, our approach can model the statistics of overlapping motifs. As we show below, motif overlap is a feature of most TF dimers, and this capability is therefore a major improvement over existing techniques. We confirm the accuracy of our predictions by multiple means, including comparison with large-scale experimental data (Ravasi et al. 2010). Based on our method, we obtain new insights into the prevalence and scope of direct TF cooperativity, and the rigidity and compactness of such interactions.
Our method is based on enrichment analysis of motif pairs at specific spacings in cell-type–specific hypersensitive sites. Thus, it differs from several existing bioinformatics approaches that aim to identify fuzzily spaced cobinding of TF pairs, i.e., indirect cooperativity (Qian et al. 2005; He et al. 2009; Bais et al. 2011; Myšičková and Vingron 2012). Recently, Whitington et al. (2011) described a method that, similarly to ours, predicts TF–TF dimerization based on enrichment of rigidly spaced motif pairs. However, this approach requires ChIP-seq data for one of the potentially cooperating TFs. In contrast, our approach is more broadly applicable, since it requires only one experimental data set per cell type. Consequently, our TF–TF dimer predictions exceeded those of Whitington et al. (2011) by over a factor of 10, and the number of predicted dimeric binding sites in regulatory elements was greater by over a factor of 100.
ChIP-seq data have also been used for TF cooperativity prediction by Wang et al. (2012), who tested for nonrandomly spaced motif pairs within binding peaks. The latter method is most suited for detecting fuzzily spaced TF–TF interactions. Consequently, the resulting predictions are different in nature from, and complementary to, those we present here.
Results
Overview of the method
To avoid redundancy in our findings, we accounted for the similarities between some of the 78 human cell types by clustering them by their genome-wide DNase I hypersensitivity profiles (Supplemental Fig. 1; see Methods). Encouragingly, the resulting dendrogram recapitulated the expected developmental hierarchy. For example, blood cells formed a single supercluster, which split into lymphoid and myeloid branches. The lymphoid set further split into T-cell and B-cell subclusters, and the myeloid set into megakaryocytic leukemias (K562, CMK) and myeloblastoid cells (CD14+ monocytes and the promyelocytic leukemias, HL-60 and NB4). We manually thresholded the cell-type dendrogram (see Methods) to define 41 distinct clusters, which we will henceforth refer to as “cell types.”
The 964 vertebrate motifs in TRANSFAC Professional (Wingender et al. 1996) were used as models of TF-binding specificity, yielding 465,130 potential motif pairs. The central assumption of our method is that dimeric TF complexes would be juxtaposed in a constrained fashion when cooperatively bound to DNA. Consequently, the genomic binding sites of cooperating TFs should form rigid motif complexes, which we define as pairs of motifs with fixed relative orientation and offset (displacement between left edges of motifs). We therefore tested all possible compact motif complexes (motif spacing ≤50 bp; see Methods) of each motif pair for enrichment in open chromatin regions specific to each of the 41 cell types.
To quantify enrichment, we counted the number of motif complex instances in each set of cell-type–specific hypersensitive sites, and then compared against a background model based on the number of instances in the union set of hypersensitive sites from all cell types (Fig. 1A,B). The significance of enrichment was assessed using a binomial distribution, after correcting for differences in motif co-occurrence frequency between foreground and background sets (see Methods). The validity of our statistical approach is supported by the observation that our motif complex enrichment P-values fit the null expectation over four orders of magnitude and are, if anything, moderately conservative (Fig. 1C).
Figure 1.
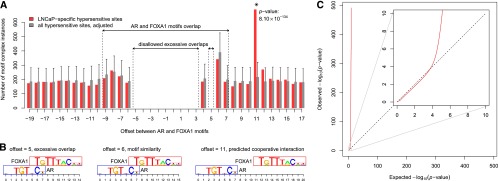
Identification of overrepresented cell-type–specific motif complexes. (A) Example of overrepresented motif complex specific to LNCaP (prostate cancer) cells. Number of instances of AR–FOXA1 motif complexes within LNCaP-specific hypersensitive sites (red bars) as a function of motif offset. Gray bars denote the expectation based on the background set of all hypersensitive sites (see Methods). Offsets in the interval [−9, 7] correspond to complexes with overlapping motifs. Offsets disallowed due to excessive motif overlap (see Methods) are indicated. Error bars correspond to P = 0.05 after Bonferroni correction. The complex with offset 11, marked with an asterisk, was the only one overrepresented in LNCaP-specific hypersensitive sites; its Bonferroni-corrected P-value is indicated. (B) Examples of AR–FOXA1 motif complexes at three different offsets; (C) Q-Q plot of observed vs. expected log10 P-values of motif complex enrichment in all ∼1.4 billion hypotheses tested. (Inset) Magnification of the first 10 decades of Q-Q plot. The calculated P-values fit the null expectation over the first four decades, indicating appropriate choice of statistical model.
Motif complexes showing statistically significant enrichment (P < 0.05 after Bonferroni correction) were recognized as evidence of cell-type–specific TF cooperativity. Application of the approach across all ∼1.39 × 10⁹ motif and cell-type combinations yielded 5233 significantly overrepresented motif complexes (Supplemental Table 4). For example, we found a highly significant AR–FOXA1 motif complex in the LNCaP prostate cancer cell line (P = 8.1 × 10−134) (Fig. 1A,B), suggestive of widespread AR–FOXA1 dimerization at prostate cancer regulatory elements (Wang et al. 2011). Note that the motif complex was enriched only at one precise offset, indicating a rigid, strongly constrained heterodimeric structure.
Since the motif database frequently contains multiple motifs for a single TF, cooperative binding of one TF pair frequently resulted in enrichment of multiple equivalent motif complexes. We therefore clustered the 5233 overrepresented motif complexes by similarity, so that each cluster constituted a distinct prediction of direct physical cooperativity in TF-DNA binding (Supplemental Table 4; see Methods). Clustering yielded 603 distinct predictions, covering 30 of the 41 cell types (73%). Each cluster was assigned the P-value of its most significant motif complex, which we refer to as the signature motif complex. Most cell types were characterized by multiple TF dimers, with 15 cell types having at least 10 predictions (Supplemental Table 3). From a TF-centric perspective, we observed that out of 350 clusters of similar motifs (see Methods), 129 participated in at least one prediction.
The number of known TF dimers is difficult to quantify, since the evidence is scattered over a large number of publications describing individual cases. We manually compiled a list of 25 known instances of direct cooperativity in DNA binding from the existing biochemical literature (Supplemental Table 1). Although this list is possibly incomplete, it is nevertheless likely that our 603 predictions outnumber the known TF–TF–DNA complexes by over an order of magnitude.
Top-ranked predictions include known instances of TF cooperativity
All of the 10 most statistically significant cooperativity predictions matched known TF complexes (Fig. 2). Moreover, the predicted cell type was also consistent with previous studies, in most of the cases. For example, the well-known cooperative interaction of POU5F1 (OCT4) with SOX2 (Ambrosetti et al. 1997; Chen et al. 2008), which is central to embryonic stem cell pluripotency, was ranked fourth and predicted in the correct cell type. Note that the OCT4–SOX2 heterodimer motif is sometimes mistakenly annotated in databases as an OCT4 or SOX2 monomer motif due to its high prevalence at OCT4 and SOX2 binding sites. Note also that the monomers participating in cooperative binding are typically predicted only at the TF-family level, i.e., “OCT” or “SOX,” since TFs within a paralog family generally bind highly similar DNA sequences. Thus, additional domain knowledge or expression analysis is needed to determine exactly which representative of each TF family is involved in the DNA-bound complex (see, for example, Carroll et al. 2005). Occasionally, prior knowledge may alter the interpretation of TF identity within a dimeric complex. In most cases, this reinterpretation merely involves substituting one paralogous TF for another. However, in exceptional cases, such as the E-box motifs in Figure 2, the TFs implied by the predicted motif pairs are not paralogous to the actual TFs binding the motif (basic helix-loop-helix dimers).
Figure 2.

Top 10 predicted motif complexes, ranked by P-value. (Middle) Below each motif complex the locations of underlying individual motifs are indicated by red and blue lines. (Left) For each motif complex, the enriched cell types are separated by “+” symbols. The number of motif complex instances in hypersensitive sites specific to each cell type is also indicated. The P-value is given for the most significant prediction across the indicated cell types. (Right) TF dimer that binds the motif complex, with literature citations.
Overall, 19 of the 25 known TF dimers (Supplemental Table 1) were present among our predictions, suggesting that our method has 76% sensitivity. This number should be considered as a lower bound, since certain TFs from the set of known dimers may not be expressed in cell types considered in our study. Notably, our 36th ranked motif complex, NFAT–AP-1 (P = 2.1 × 10−40, http://bioputer.mimuw.edu.pl/papers/tfdimers/), matches the NFAT–FOS–JUN trimer that is known to synergistically regulate several immune-response genes (Chen et al. 1998b). This trimer was predicted by our algorithm because the sequence recognized by the FOS–JUN (AP-1) dimer was present as a single motif (accession number M00926) in TRANSFAC.
Predicted interactions significantly overlap previous systematic TF–TF screens
To verify our cooperative binding predictions against experimental data on a large scale, we overlapped them with an atlas of 5238 human protein–protein interactions (PPIs) between transcription factors. The PPIs were deduced from mammalian two-hybrid assays and other forms of experimental evidence (Ravasi et al. 2010). It is important to note that, even if our predictions were perfectly accurate, only a fraction of them would be expected to be present in the PPI set, since existing experimental methods have limited sensitivity. For example, the mammalian two-hybrid assay has an estimated sensitivity of 25% (Ravasi et al. 2010). Similarly, even if our predictions covered every single true interaction, we would still expect them to include only a portion of the PPIs, due to false positives in the latter. For example, the false-detection rate of the mammalian two-hybrid assay is ∼53%. Moreover, only a subset of TF–TF complexes in the PPI set are likely to bind DNA with both subunits. Nevertheless, we found highly significant overlap (P = 1.2 × 10−82; see Methods) with the atlas.
We also compared our predictions with cooperative interactions inferred from motif analysis of ChIP-seq data (Whitington et al. 2011). We clustered the 59 human cell-type–specific motif complexes reported by Whitington et al. (2011) exactly as our complexes were clustered, and obtained 44 nonredundant predictions. Of these 44 predictions, 29 were reported in cell types for which we obtained DNase-seq data. We found that nine of these 29 (31%) were also predicted by our method in at least one cell type, and 7/29 (24%) were predicted by our method in exactly the same cell type (see Methods). Thus, there is a significant (P = 2.6 × 10⁻²³), though incomplete, overlap between the two prediction sets. Apart from false positives and negatives in the two interaction sets, one possible reason for the limited overlap is that most of the TF–TF dimers predicted by Whitington et al. (2011) were predicted to bind at <30 locations in the genome. Our method, while more general, is only sensitive to TF–TF dimers with widespread binding, since it does not benefit from the precision of ChIP-seq data. This distinction is underlined by the observation that our 603 predicted TF dimers are estimated to bind at 450,652 locations genome-wide. In contrast, the human TF cooperativity predictions in Whitington et al. (2011) cover 1821 genomic sites.
DNase I cut density independently supports predicted physical interactions
In predicting TF dimers, we did not use all of the information contained in the DNase-seq data. Specifically, we ignored variation in DNase-seq peak height—all hypersensitive sites were treated as equivalent. Consequently, we would expect false-positive motif complexes to be randomly distributed relative to peak height. In contrast, truly cooperative motif complexes should show a skew toward the “taller” hypersensitive peaks. This is because cooperativity would enhance TF–DNA binding, and thereby enhance average chromatin openness (Boyle et al. 2011; Pique-Regi et al. 2011). This opens up another avenue for independently validating our predictions—we could test each predicted TF–TF dimer for bias toward taller hypersensitive peaks. Note that there is no circularity in this validation approach, since we are testing for peak-height skews within the set of DNase I hypersensitive sites, rather than between peaks and the rest of the genome.
For illustration, consider again the AR–FOXA1 motif complex. We predicted that AR–FOXA1 would bind cooperatively at 690 locations within LNCaP-specific hypersensitive sites, with the two individual motifs offset by 11 bp. We constructed the average density profile of DNase I cuts at cooperatively bound locations by aggregating over these 690 sites (see Methods). For comparison, we considered 1909 AR–FOXA1 motif complex instances with “incorrect” spacing (motif offset between 12 and 21 bp) within the same set of hypersensitive sites. If the two TFs did indeed bind cooperatively at the predicted motif offset, this cooperativity would result in stronger average TF–DNA binding at sites with the correct motif spacing, relative to sites with the incorrect spacing. Consequently, we would expect the cut density to be greater at the 690 correctly spaced sites, relative to the 1909 incorrectly spaced sites. This is indeed the case within the central 200-bp window (Fig. 3A) (P = 1.3 × 10⁻¹³). Our examination of the cut density profiles of other known TF dimers showed the same trend (data not shown).
Figure 3.

DNase I cut density near predicted and incorrectly spaced motif complexes. (A) Example of AR–FOXA1. The average number of DNase I cuts in LNCaP-specific hypersensitive sites is shown in the vicinity of AR–FOXA1 motif complex instances. (Red curve) DNase I cut density averaged over 690 instances of the predicted AR–FOXA1 motif complex (we predict that AR–FOXA1 heterodimer binds at these locations in LNCaP cells). (Black curve) DNase I cut density averaged over 1909 instances of incorrectly spaced AR–FOXA1 motif complexes (wider than the predicted spacing by 1–10 bp). The DNase I cut density is significantly higher within ±100 bp of the predicted heterodimer binding sites. (B) Similar to A: DNase I cut density averaged over the 54 predicted motif complexes that failed to show significant enrichment for DNase I cuts when analyzed individually (see Methods).
We repeated the comparison of DNase I cut density profiles in Figure 3A for the entire set of 603 signature motif complexes, and found that, as a group, they collectively showed the expected cut-density enrichment (P < 10−300). At an individual level, 91% of the predicted cooperative interactions (549/603) showed statistically significant enrichment in DNase I cuts after correcting for multiple testing (FDR < 0.05). Thus, most of our predicted dimers were independently supported by the cut-density test.
To obtain further insight into the remaining 54 (603 − 549) predicted motif complexes that were rejected by this test, we averaged their collective DNase I cut profile and compared it with the profile at the 540 corresponding incorrectly spaced complexes. Encouragingly, we again found significant local elevation of DNase I accessibility (Fig. 3B) (P = 0.019), suggesting that deeper sequencing of DNase-seq libraries could provide sufficient statistical power to validate several additional motif complexes.
Evolutionary conservation supports predicted physical interactions
Yet another approach to validate the predicted TF dimers would be to compare evolutionary conservation scores between predicted and incorrectly spaced motif complexes. This test has limited power, since TF-binding sites are known to diverge very rapidly between species, and also because informative positions within motif complexes typically cover only ∼5–10 bp. However, we still expected at least some of our predicted complexes to show a signal of evolutionary constraint; see, for example, the constraint profile of the FOXA1 (HNF3A) homodimer (Fig. 4A). For this purpose, we used primate base-pairwise conservation scores (Pollard et al. 2010), weighted by motif information content (see Methods). For 23.7% of the predictions (143/603), we observed preferential evolutionary constraint (FDR < 0.05), further supporting the validity of our predictions (Fig. 4B).
Figure 4.
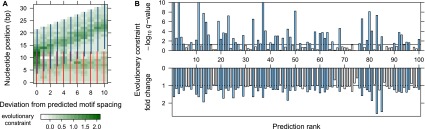
Evolutionary constraint signatures of predicted motif complexes. (A) Example of FOXA1 (HNF3A) homodimer, ranked 11th and predicted in LNCaP (prostate cancer) cells. Again, we considered the predicted motif complex (first column) and its 10 incorrectly spaced variants. At each nucleotide position, color intensity indicates the average phyloP constraint score, weighted by information content at the corresponding motif position (see Methods). Evolutionary constraint is highest at the predicted motif spacing. (B) Evolutionary constraint q-values and fold change for the top 100 predicted motif complexes. Evolutionary constraint scores were calculated for each predicted motif complex and its 10 incorrectly spaced variants (see Methods). For each prediction, we tested whether the corresponding motif complex instances were enriched for evolutionary constraint relative to the remaining 10 spacings. We show the corresponding q-values (top) and fold changes (bottom) of evolutionary constraint scores between the predicted motif complex and its incorrectly spaced variants. Predictions with q-value below 0.05 are indicated by blue bars in both plots.
Predicted cooperative interactions are rigid and compact
There is some uncertainty in the literature about the spatial properties of motif pairs that are bound by TF dimers (Mirny 2010; Biggin 2011). Here, we define motif spacing as the number of intervening nucleotides between the edges of the two motifs (negative values indicate motif overlap). As noted above, numerous studies have tested for fuzzy motif spacing, and predicted TF–TF interactions with relatively large intermotif distances (∼tens of base pairs). In contrast, some biochemical analyses suggest that dimeric motif spacings should be rigid or semi-rigid and also compact (<5 bp). Known TF complexes that fit this pattern include a number of SOX–OCT heterodimers (Ng et al. 2012) and several nuclear receptor dimers (Umesono et al. 1991). Our results clearly fit the latter model, as illustrated by the spatial pattern of motif complex enrichment scores corresponding to our top 100 predictions (Fig. 5A). Note that most of the 603 predicted interactions require completely rigid spacing and the vast majority of the rest allow only 1 or 2 bp of variation in motif spacing (Fig. 5B).
Figure 5.

Rigidity and compactness of transcription factor dimers. (A) For each of the top 100 predictions, we display the motif complex enrichment P-value as a function of motif spacing (see Methods). Spacings to the left of the red line correspond to overlapping motifs. (B) Very few of the 603 predicted motif complexes remain significantly enriched when motif spacing is altered, suggesting that cooperative motif complexes are rigidly spaced. (C) Spacing distribution of predicted motif dimers (top) and known TF dimers (bottom; Supplemental Table 1). Spacings to the left of the red line correspond to overlapping motifs. Predicted and known dimers are compact, i.e., tightly spaced.
Interestingly, the vast majority (87.2%) of motif spacings among our 603 predictions were negative, indicating motif overlap (Fig. 5C). It is possible that this high frequency of overlap merely represents an artifact of uninformative base pairs present at the flanks of TRANSFAC motifs. However, even after trimming potentially redundant motif positions (see Methods), we still found that 67.8% of the motif pairs overlapped (Supplemental Fig. 4). Consistently, a high degree of overlap was observed even among the trimmed motif pairs corresponding to known TF dimers (Fig. 5C; Supplemental Table 1). Thus, 87.2% of the associations detected by our approach would be invisible to existing methods that do not allow motif overlap. Moreover, even after motif trimming, which is not necessarily advisable in all cases, 67.8% of our predictions would be undetectable by all existing approaches. Overall, our results indicate that TF dimers bind rigid and highly compact motif complexes.
Predicted cooperative interactions indicate key role of FOXA1 in prostate cancer cells
As noted above, all of the top 10 cooperativity predictions matched known TF dimers (Fig. 2). However, the 11th-ranked prediction, which implies a FOXA1 (HNF3A) homodimer in prostate cancer cells (P = 5.1 × 10−93) (Fig. 6B), is, to the best of our knowledge, novel. This motif dimer also shows a very strong signal of preferential evolutionary constraint (q = 5.2 × 10⁻¹⁸) (Fig. 4A). Note that in the same prostate cancer cell line there already exists one well-known dimeric complex involving FOXA1, namely, AR–FOXA1 (Wang et al. 2011), which ranked sixth amongst our predictions (Fig. 6A). Inspired by these two cases, we searched for additional FOXA1 cooperative interactions among our predictions. Strikingly, we found a second predicted FOXA1 homodimer, with a completely different structure (ranked 108th, P = 8.8 × 10⁻¹⁸) (Fig. 6C), as well as a predicted FOXA1–NFI heterodimer (ranked 139th, P = 6.4 × 10⁻¹⁵) (Fig. 6D). Thus, we predict that FOXA1 is involved in at least four strong cooperative dimeric binding modes in prostate cancer cells, only one of which was previously known.
Figure 6.
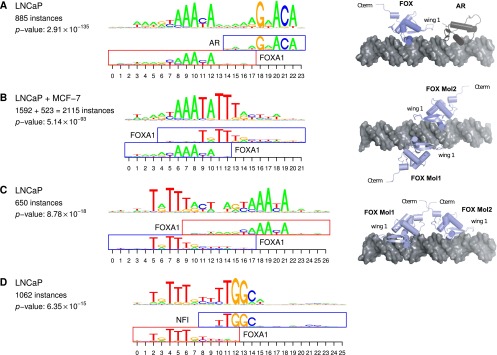
Key role of FOXA1 in prostate cancer cells (LNCaP). (Left) Most significant cooperativity predictions involving FOXA1 and underlying overrepresented motif complexes. The number of instances and P-value are given as in Figure 2. (Right) Predicted 3D structures of respective TF–TF–DNA complexes. (A) FOXA1–AR heterodimer; (B) diverging FOXA1 homodimer; (C) converging FOXA1 homodimer; (D) FOXA1–NFI heterodimer. Due to the lack of crystal structure for NFI in PDB, no 3D structure is predicted in D.
To assess whether the four motif dimers involving FOXA1 topologically permit the assembly of dimeric TF complexes, we attempted to generate structural models. To this end, we first simulated ideal B-DNA structures containing the dimer motifs from Figure 6 using the w3DNA server (http://w3dna.rutgers.edu/). Next, we downloaded structural models from the Protein Data Bank (PDB) (Berman et al. 2000) containing androgen receptor (Shaffer et al. 2004) and FOX (Littler et al. 2010) DNA-binding domains (PDB identifiers 1R4I and 3G73) when bound to DNA sequences that closely match the consensus of our composite motifs. Unfortunately, we found no PDB entries with reasonable sequence similarity to NFI. To assemble hypothetical ternary TF–TF–DNA complexes, we superimposed DNA strands of the experimental crystal structures upon the simulated DNA with composite motifs using least-squares fitting in Coot (Emsley and Cowtan 2004). We then visualized the resulting complexes using PyMOL (DeLano 2002).
By analyzing the resulting models of TF dimers on DNA, we found that both homodimeric FOX complexes as well as the heterodimeric FOX–AR complex can assemble without any steric hindrance. Furthermore, the protein interfaces of the FOX–AR complex (Fig. 6A) as well as the converging FOX homodimer (Fig. 6C; Supplemental Fig. 5) are positioned favorably such that they could engage in direct protein–protein interactions. The diverging FOX homodimer (Fig. 6B) is arranged on opposing faces of the DNA double helix, and direct protein–protein interactions between the DNA-binding domains are less likely in the present conformation, barring pronounced allosteric effects. It is possible that FOX–FOX binding cooperativity in this case is mediated by DNA conformational changes, as has been previously observed in multiple instances (Baburajendran et al. 2011).
Discussion
Genome-wide scans for DNase I hypersensitivity are a powerful tool for mapping cis-regulatory elements with high spatial precision in any given cell type (Crawford et al. 2006). One major advantage of this method is that, when combined with TF–DNA affinity models (motifs), DNase-seq can facilitate binding-site predictions for a broad range of individual TFs (Boyle et al. 2011; Pique-Regi et al. 2011). We have taken the latter approach one step further by using DNase-seq data to predict cooperatively bound TF complexes genome wide. In all, we predicted cooperative binding of 603 signature motif complexes to 450,652 binding sites in regulatory regions specific to 28 different cell types. As a resource for future investigations, we provide these 603 motif complexes, along with exact genomic coordinates of their occurrences in cell-type–specific regulatory elements genome-wide (http://bioputer.mimuw.edu.pl/papers/tfdimers/).
The power of our method derives from the fact that it can, in principle, predict all TF complexes in a given cell type based on a single DNase-seq data set. Additional data sets could be incorporated in the future to predict dimers in additional cell types. Judging from the set of 25 known cooperative dimers, our predictions have sensitivity of at least ∼76%. The vast majority of the 603 predicted complexes are novel. Overall, our results suggest that TF dimerization is far more widespread than previously known. This provides at least a partial explanation to the paradox of TF–DNA-binding specificity in large genomes. While TFs may individually possess low sequence selectivity, the complexes they form with other DNA-binding factors could be highly specific (Levine and Tjian 2003). Thus, our results suggest that the current bioinformatics focus on predicting TF–DNA binding based on individual position weight matrices and chromatin openness data should be expanded.
We systematically validated our TF cooperativity predictions by comparing against a large-scale experimental database of protein–protein interactions, and found highly significant overlap. This concordance is highly encouraging given the profound differences between our computational method and experimental approaches. Our method interrogates TFs in their native environment in multiple human cell types, whereas experimental techniques such as two-hybrid assays measure interactions between chimeric, artificially expressed human proteins in a single nonhuman cell type. Another important distinction is that the two-hybrid assay measures the propensity of proteins to form contacts independently of DNA, whereas our method specifically detects formation of TF complexes on genomic DNA. Moreover, the two-hybrid assay does not accommodate tissue-specificity of TF isoforms, post-translational modifications, or the potential effect of cofactors on cooperative binding.
We also used a novel statistical test to detect local elevation of the DNase-seq tag density, which validated 91% (549/603) predictions, and showed that at least some of the remaining 54 predictions would have also been validated if the corresponding DNase-seq libraries had been sequenced to greater depth. Another indication of functional relevance of the proposed complexes is the preferential evolutionary conservation of motif pairs with predicted structure. These findings independently support the accuracy of TF cooperativity predictions.
FOXA1 is well known to act as a pioneer factor in multiple cell types, including breast and prostate cancer cells (Zaret and Carroll 2011). In other words, FOXA1 can initiate binding even at nucleosome-occluded DNA sites, and thereby potentiate subsequent binding of other factors. One would therefore imagine that FOXA1 should be able to bind all of its motif matches in the human genome. However, this is clearly not the case; in reality, FOXA1 binds only a small subset of its candidate sites (Lupien et al. 2008). Thus, there must be some other mechanism that compensates for the limited ability of chromatin openness to confer binding specificity upon pioneer TFs. Our results suggest that multiple homodimeric and heterodimeric binding modes could potentially contribute to the binding specificity of FOXA1. Alternatively, one could hypothesize that dimerization may enhance the ability of this pioneer factor to compete with nucleosomes when the cognate DNA-binding surface is not accessible. Interestingly, other known pioneer factors, such as GR and GATA (Zaret and Carroll 2011), also appear among our top 40 predicted interactions, suggesting that dimerization could potentially represent a general specificity mechanism for pioneering TFs.
Previous studies have focused almost exclusively on fuzzily spaced cobinding of TFs, which is in general indicative of functional or indirect cooperativity. In contrast, biochemical studies suggest that only a single motif spacing, or at most two to three spacings, are compatible with direct cooperativity through TF dimerization (Grove et al. 2009; Cotnoir-White et al. 2011; Slattery et al. 2011). Moreover, even when TFs are seen to dimerize at a few different possible spacings, one spacing typically dominates in terms of binding affinity. For example, although OCT4 and SOX2 can dimerize at motif pairs separated by precisely three additional base pairs relative to the canonical OCT4–SOX2 motif spacing, the canonical spacing clearly provides greater binding affinity (Ng et al. 2012). Not surprisingly, therefore, in vivo binding sites overwhelmingly favor the canonical spacing (Chen et al. 2008).
Our results indicate that there exists a large class of conformationally constrained TF dimers that bind rigidly spaced motif complexes. The inflexibility of these motif complexes implies that dimerization on DNA frequently imposes strict constraints on the relative spatial conformation of the participating TFs. As in the case of OCT4 and SOX2, a small number of additional motif spacings may indeed provide alternate dimeric binding modes for the same factors, but these additional modes are likely to have lower affinity and also to contribute relatively few genomic binding sites. Finally, our predicted motif complexes are typically highly compact, perhaps suggesting that TF dimerization is mediated by DNA-binding domains more commonly than by cofactors or DNA-distal domains.
Methods
Identifying hypersensitive sites in 78 ENCODE cell types
We incorporated DNase I hypersensitivity data sets produced at the University of Washington as part of the ENCODE Project (Genome Browser track wgEncodeUwDnase). The 161 initially considered data sets covered 85 distinct cell types. We excluded some data sets with atypical GC-content spectra, reducing the number of data sets to 148, and the number of distinct cell types to 78 (data not shown). We relied on the hg19 read alignments listed in Supplemental Table 2. To identify hypersensitive regions, we used the F-Seq peak-calling algorithm (Boyle et al. 2008), treating each replicate separately.
We discarded hypersensitive regions, whose peak position lay within a repetitive region (union of RepeatMasker and Tandem Repeat Finder), and hard-masked repetitive base pairs in the remaining hypersensitive regions. We also hard-masked coding regions. To make the data sets obtained from different cell types comparable, we limited our analysis to the top 50,000 hypersensitive sites in each cell type. We also fixed the size of each hypersensitive region at 400 bp, centered on the F-Seq peak. Hypersensitivity calls from replicates were merged as described in the next subsection.
Clustering of cell types into 41 cell-type clusters
To account for the intrinsic similarity of many of the cell types considered, we used a systematic method to cluster them into coherent cell-type clusters based on the similarity of their hypersensitivity profiles. We represented the profiles of the 148 data sets as genome-wide binary vectors, with value 1 at positions within hypersensitive regions and value 0 elsewhere. We then calculated the dissimilarity between any two data sets as the Hamming distance between the respective binary vectors, scaled in such a way that the maximum dissimilarity across all comparisons equals 1.
We used complete-linkage hierarchical clustering to collapse the 148 data sets from 78 cell types into cell type clusters. Before clustering, we first joined replicates from the same cell type at the lowest level of the dendrogram. The resulting dendrogram, along with the threshold defining the 41 cell type clusters, are presented in Supplemental Figure 1. We then merged the sets of hypersensitive regions, obtained as described in the previous subsection, within each cell-type cluster, combining overlapping regions into a single hypersensitive site.
Cluster-specific hypersensitive regions were defined as genomic regions hypersensitive in a given cell-type cluster, but not in any other cluster. In case of partial overlap, the nonoverlapping fragment was considered cluster specific. For brevity, we will refer to the cluster-specific hypersensitive regions as “cell-type–specific hypersensitive regions.”
Calculating motif occurrence statistics
All 964 vertebrate motifs from TRANSFAC Professional 2011.2 were used as models of TF-binding specificity. Given a pair of motifs, their motif complex was defined as a motif pair with a specified mutual orientation and offset. The offset was defined as the coordinate of the leftmost position of one motif in the coordinate system of the other motif (with zero-based start), whereas the spacing was defined as the number of intervening nucleotides between the edges of the two motifs. We allowed overlapping motif complexes, which were characterized by negative spacing. We considered only the motif complexes within up to 50-bp spacing between the two motifs. Let us denote by s the fixed orientation and offset of the motifs, and call it the structure of the motif complex.
For each combination of cell type, motif pair (M1, M2), and its structure s, we calculated the significance of motif complex overrepresentation as follows. First, matches to individual motifs were identified within hypersensitive sites at a motif score threshold that provided at least 80% sensitivity (Rahmann et al. 2003). Pairs of motif matches that fit the specified structure s were taken as instances of the motif complex.
Let C12(s) and c12(s) be the number of observed motif complex occurrences in a given set of cell-type–specific hypersensitive regions (foreground) and in the background set of all hypersensitive regions, respectively. Also, let N12(s) and n12(s) be the number of all possible complex occurrences in the foreground and in the background, respectively. By a possible occurrence of the motif complex we mean any occurrence such that the whole complex fits within the corresponding hypersensitive region. Then f12(s) = C12(s)/N12(s) is the probability of observing the motif complex s in the foreground, and b12(s) = c12(s)/n12(s) is the probability of observing the motif complex s in the background.
Let C12 be the total number of observed occurrences in the foreground of the pair of motifs (M1, M2) with structure s ranging over spacings up to 50 bp and both orientations. In a similar way, we define the numbers c12, N12, and n12. Then f12 = C12/N12 is the probability of observing in the foreground the pair of motifs (M1, M2) within a reasonable range of structures. Likewise, b12 = c12/n12 is the probability of observing in the background the pair of motifs (M1, M2) within a reasonable range of structures.
The null hypothesis is that the conditional foreground probability f12(s)/f12 and the conditional background probability b12(s)/b12 are the same. Consequently, the P-value of observing in the foreground at least C12(s) occurrences of the motif complex with a specified structure s can be calculated as the probability of observing at least C12(s) successes in N12(s) trials of the Bernoulli process with probability of success f12 · (b12(s)/b12).
An intuition behind the success probability of the Bernoulli schema is that it is the background probability b12(s) of observing a given motif complex with structure s adjusted by the factor f12/b12, which reflects the relative motif pair densities in the foreground and in the background. Note that if we fix the pair of motifs and the structure s, then the background conditional probability stays the same and choice of cell type (foreground) affects the probability of success in the Bernoulli schema by the factor f12.
Limiting the set of cooperativity predictions
We expected that transcription factors, which bind cooperatively in a particular cell type, should also be subject to individual overrepresentation in this cell type. To account for this expectation, we considered only pairs of motifs satisfying the condition f12 ≥ b12, i.e., pairs of motifs, which are at least as frequent in the foreground as in the background (within a reasonable range of structures).
Another constraint directly corresponded to steric hindrance between two TFs. Some approaches, e.g., Whitington et al. (2011), require that the motifs forming a motif complex must not overlap. However, many of the available motifs have redundant low-information positions at their ends, which would hinder the prediction of genuine TF cooperativities. Consequently, previous studies could not avoid trimming of low-information flanking regions of the motifs. We decided to apply a different approach, allowing minor motif overlaps, to retain all of the information contained in the binding affinity models. Our statistics account for possible over- or underrepresentation of motif complexes consisting of overlapping motifs (Fig. 1B). As explained below, excessive motif overlaps were disallowed as being highly unlikely; motif complexes dominated by one of the individual motifs were also disallowed.
To measure the degree of overlap, we introduced the concept of overlapping information content. For each overlapping motif position we define it as the minimum of the two information content values of the overlapping motifs. For the whole motif complex, we defined it as the sum of the overlapping information content values, ranging over all overlapping positions. We called an overlap minor if the overlapping information content did not exceed 2 bits. We disallowed major (i.e., not minor) overlaps, because such colliding configurations are unlikely to correspond to direct TF cooperativity.
We also disallowed motif complexes, in which one of the individual motifs dominates the entire complex. To measure the share of an individual motif in a motif complex, we defined the information contribution of each motif. For a nonoverlapping motif position, it is simply equal to the information content of the individual motif at that position. For an overlapping motif position, if the two motifs differ in information content at that position, then the information contribution at that position of the more informative motif is equal to its information content at that position, and the information contribution at that position of the other motif is set to 0. In the case of equal information content, both of the motifs have the information contribution at that position set to half of their information content at this position. We defined the information contribution of a motif in the motif complex as the sum of its information contribution values, ranging over all positions. We considered only motif complexes in which both of the individual motifs had the information contribution of at least 6 bits.
To avoid artifacts arising from individual motifs that occur extremely rarely within hypersensitive sites, we considered only motif complexes that occurred at least 100 times within cell-type–specific hypersensitive regions (C12(s) ≥ 100). Moreover, we were aware that certain motifs are similar to themselves in a different layout. In particular, overrepresentation of a particular motif complex evokes possible overrepresentation of shadow motif complexes consisting of the same motifs, but with altered offset or orientation. We therefore allowed only one occurrence of each combination of motif pair and cell type by incorporating only the motif complex with the smallest P-value. Finally, we considered only the overrepresented motif complexes with corrected P-value <0.05. The P-values were Bonferroni-corrected by multiplying by the total number of hypotheses tested, across all motif pairs, orientations, offsets, and cell types (∼1.4 billion).
Clustering of cooperativity predictions
Due to the redundancy of the motif database used, a single TF–TF cooperative interaction may be reported as multiple, mutually redundant motif complexes (see, for example, Supplemental Fig. 3). We therefore clustered the 5233 overrepresented motif complexes as described below. For each motif complex, we calculated its representative, called dimer motif, by counting nucleotide frequencies at all of its instances, including a 5-bp margin on both sides.
As suggested by Gupta et al. (2007), we used the squared Euclidean distance (ED2) as the dissimilarity measure of dimer motifs, assuming the clustering threshold of 2 for ED2. The overrepresented motif complexes were ranked by P-value in ascending order. We clustered them in a greedy manner, subsequently comparing each complex with already established clusters. The comparison was done by calculating ED2 between the considered complex and the most significant motif complex in the considered cluster. If any ED2 was less than 2, then the considered complex was merged with its counterpart with the smallest P-value and discarded from further comparisons; in the other case, a new cluster was established. In this way we obtained the 603 clusters, which we refer to as predicted dimers or simply predictions. Each prediction was assigned the P-value of its most significant motif complex, which we refer to as the signature motif complex. Consequently, each prediction was characterized by the cell types in which its signature motif complex was predicted.
In rare cases, it may happen that a longer monomer motif can be constructed by combining two short, degenerate motifs. To facilitate manual identification of such artifacts, we reported instances where the dimer motif closely matched (ED2 < 2) a single motif from the database (see Supplemental Table 4). Note that it would not be appropriate to automatically discard such dimer motifs, due to the contamination of motif databases with dimer motifs (e.g., SOX–OCT).
Clustering and trimming of individual motifs
All of the individual 964 motifs were clustered so as to obtain a TF-centric view of our predictions. We used complete linkage hierarchical clustering, based on ED2 between the motifs, to obtain 350 motif clusters. The clustering threshold was set to 2, i.e., all of the motifs in one motif cluster had their pairwise ED2 not greater than 2.
Motif trimming in Supplemental Figure 4 was implemented as in Whitington et al. (2011), by eliminating uninformative base pairs from the flanks. In other words, we removed all columns with information content ≤0.25 bit from both sides of the individual motif.
Comparison with the atlas of combinatorial transcriptional regulation
The atlas contains interactions between human TFs derived from mammalian two-hybrid assays and supplemented with low-throughput experimental evidence in the literature (Supplemental Table S2 in Ravasi et al. 2010). The interactions are stored as 5238 pairs of Entrez identifiers (IDs). To perform the comparison, we mapped the TRANSFAC motif identifiers from our predicted complexes onto Entrez IDs, using the default mapping provided by TRANSFAC. As a result, 836 TRANSFAC motifs were mapped to 523 Entrez IDs in a many-to-many manner.
To evaluate the agreement between our predictions and the atlas we used a hypergeometric test. We set the space of pairs to form the universe of all 136,503 possible pairs on the set of 523 mappable Entrez IDs. The predicted TRANSFAC motif pairs map to a subset of 7941 pairs in this universe, constituting the set of trials. The set of successes is a subset of 1288 Entrez ID pairs out of all 5238 pairs stored in the atlas, in which each component can be mapped to one of the 836 TRANSFAC motifs. The intersection with the atlas is given by a set of 279 successful trials, i.e., the Entrez ID pairs that are mappable from the predicted pairs and are stored in the atlas.
Sensitivity of 21.7% was estimated by the ratio of the number of successful trials (279) over successes (1288). It is 3.7 times higher than a sensitivity of 5.8% expected by pure chance alone, given by the ratio of trials (7941) and the size of the universe (136,503).
Our predictions in the form of TRANSFAC motif pairs were grouped into 603 clusters of similar pairs, with each cluster interpreted as one prediction of a complex. There are 563 mappable clusters, i.e., clusters that contain at least one TRANSFAC motif pair with both components belonging to the set of 836 mapped motifs. A total of 91 of those clusters are confirmed by the atlas, i.e., contain at least one motif pair that maps on a pair of Entrez IDs that is stored in the atlas. To evaluate the precision of our predictions with respect to the atlas we computed the fraction of the mappable clusters that are confirmed by the atlas (91 out of 563), yielding 16.2% precision.
Comparison with ChIP-seq-based approach of Whitington et al. (2011)
We repeated our computational experiment using the motifs reported by Whitington et al. (2011). In case they used a custom motif, we applied the closest counterpart found in TRANSFAC, trimmed or extended, respectively. We adjusted the motif sensitivity threshold in our method from 0.8 to 0.95, so that the number of individual motif occurrences in the genome was large enough for the overrepresentation statistics to be powerful.
Calculating DNase I cut density score
We compared the number of DNase I cuts between the instances of a predicted signature motif complex and the instances of its slight alterations, which we refer to as incorrectly spaced complexes, consisting of the same two motifs, but with slightly increased spacing between them, by +1 up to +10 bp. Both sets contained only the instances within hypersensitive sites specific to cell types for which the cooperativity prediction was made. Having fixed one prediction, we calculated the DNase I digestion patterns for both the predicted complex instances and incorrectly spaced complex instances, as shown in Figure 3. Our DNase I cut denstiy score was the number of DNase I cuts in the ±100-bp neighborhood of the motif complex instance, calculated with a triangular kernel and normalized within each prediction so that its average value for incorrectly spaced complexes equals 1. We then used the Mann–Whitney U-test to assess whether the instances of predicted motif complex are more enriched in DNase I cuts than incorrectly spaced complex instances.
Calculating evolutionary conservation score
We followed a similar approach as for the DNase I cut density score, comparing the predicted and incorrectly spaced complexes. For each occurrence of the motif complex, we have calculated the weighted average of phyloP primate base-pairwise cross-species constraint scores (Pollard et al. 2010), where the weights were proportional to the information content at the corresponding nucleotide in the dimer motif. This weighting is justified by the fact that higher information content positions are likely to be more constrained. Again, we used the Mann–Whitney U-test to assess whether the instances of predicted motif complex are more conserved than incorrectly spaced complex instances.
Acknowledgments
We acknowledge the Stamatoyannopoulos group from the University of Washington, and the ENCODE Project and ENCODE Data Coordination Center at UCSC for providing the DNase I hypersensitivity data sets. This work was supported by the Agency for Science, Technology and Research (A*STAR Singapore) Joint Council Office grant no. JCOAG03_FG02_2009, Ministry of Science and Higher Education (Poland) grant no. N N301 065236, and National Science Centre (Poland) grant nos. N N519 652740 and 2011/03/N/NZ2/03177.
Footnotes
[Supplemental material is available for this article.]
Article published online before print. Article, supplemental material, and publication date are at http://www.genome.org/cgi/doi/10.1101/gr.154922.113.
Freely available online through the Genome Research Open Access option.
References
- Adams CC, Workman JL 1995. Binding of disparate transcriptional activators to nucleosomal DNA is inherently cooperative. Mol Cell Biol 15: 1405–1421 [DOI] [PMC free article] [PubMed] [Google Scholar]
- Ambrosetti DC, Basilico C, Dailey L 1997. Synergistic activation of the fibroblast growth factor 4 enhancer by Sox2 and Oct-3 depends on protein-protein interactions facilitated by a specific spatial arrangement of factor binding sites. Mol Cell Biol 17: 6321–6329 [DOI] [PMC free article] [PubMed] [Google Scholar]
- Baburajendran N, Jauch R, Tan CY, Narasimhan K, Kolatkar PR 2011. Structural basis for the cooperative DNA recognition by Smad4 MH1 dimers. Nucleic Acids Res 39: 8213–8222 [DOI] [PMC free article] [PubMed] [Google Scholar]
- Bais AS, Kaminski N, Benos PV 2011. Finding subtypes of transcription factor motif pairs with distinct regulatory roles. Nucleic Acids Res 39: e76. [DOI] [PMC free article] [PubMed] [Google Scholar]
- Berman HM, Westbrook J, Feng Z, Gilliland G, Bhat TN, Weissig H, Shindyalov IN, Bourne PE 2000. The Protein Data Bank. Nucleic Acids Res 28: 235–242 [DOI] [PMC free article] [PubMed] [Google Scholar]
- Berman BP, Nibu Y, Pfeiffer BD, Tomancak P, Celniker SE, Levine M, Rubin GM, Eisen MB 2002. Exploiting transcription factor binding site clustering to identify cis-regulatory modules involved in pattern formation in the Drosophila genome. Proc Natl Acad Sci 99: 757–762 [DOI] [PMC free article] [PubMed] [Google Scholar]
- Biggin MD 2011. Animal transcription networks as highly connected, quantitative continua. Dev Cell 21: 611–626 [DOI] [PubMed] [Google Scholar]
- Boyle AP, Guinney J, Crawford GE, Furey TS 2008. F-Seq: A feature density estimator for high-throughput sequence tags. Bioinformatics 24: 2537–2538 [DOI] [PMC free article] [PubMed] [Google Scholar]
- Boyle AP, Song L, Lee BK, London D, Keefe D, Birney E, Iyer VR, Crawford GE, Furey TS 2011. High-resolution genome-wide in vivo footprinting of diverse transcription factors in human cells. Genome Res 21: 456–464 [DOI] [PMC free article] [PubMed] [Google Scholar]
- Carroll JS, Liu XS, Brodsky AS, Li W, Meyer CA, Szary AJ, Eeckhoute J, Shao W, Hestermann EV, Geistlinger TR, et al. 2005. Chromosome-wide mapping of estrogen receptor binding reveals long-range regulation requiring the forkhead protein FoxA1. Cell 122: 33–43 [DOI] [PubMed] [Google Scholar]
- Chen FE, Huang DB, Chen YQ, Ghosh G 1998a. Crystal structure of p50/p65 heterodimer of transcription factor NF-κB bound to DNA. Nature 391: 410–413 [DOI] [PubMed] [Google Scholar]
- Chen L, Glover JN, Hogan PG, Rao A, Harrison SC 1998b. Structure of the DNA-binding domains from NFAT, Fos and Jun bound specifically to DNA. Nature 392: 42–48 [DOI] [PubMed] [Google Scholar]
- Chen X, Xu H, Yuan P, Fang F, Huss M, Vega VB, Wong E, Orlov YL, Zhang W, Jiang J, et al. 2008. Integration of external signaling pathways with the core transcriptional network in embryonic stem cells. Cell 133: 1106–1117 [DOI] [PubMed] [Google Scholar]
- Cheret C, Doyen A, Yaniv M, Pontoglio M 2002. Hepatocyte nuclear factor 1 α controls renal expression of the Npt1-Npt4 anionic transporter locus. J Mol Biol 322: 929–941 [DOI] [PubMed] [Google Scholar]
- Cotnoir-White D, Laperrière D, Mader S 2011. Evolution of the repertoire of nuclear receptor binding sites in genomes. Mol Cell Endocrinol 334: 76–82 [DOI] [PubMed] [Google Scholar]
- Courtois G, Baumhueter S, Crabtree GR 1988. Purified hepatocyte nuclear factor 1 interacts with a family of hepatocyte-specific promoters. Proc Natl Acad Sci 85: 7937–7941 [DOI] [PMC free article] [PubMed] [Google Scholar]
- Crawford GE, Holt IE, Whittle J, Webb BD, Tai D, Davis S, Margulies EH, Chen Y, Bernat JA, Ginsburg D, et al. 2006. Genome-wide mapping of DNase hypersensitive sites using massively parallel signature sequencing (MPSS). Genome Res 16: 123–131 [DOI] [PMC free article] [PubMed] [Google Scholar]
- De Masi F, Grove CA, Vedenko A, Alibés A, Gisselbrecht SS, Serrano L, Bulyk ML, Walhout AJ 2011. Using a structural and logics systems approach to infer bHLH-DNA binding specificity determinants. Nucleic Acids Res 39: 4553–4563 [DOI] [PMC free article] [PubMed] [Google Scholar]
- DeLano WL. 2002. The PyMOL molecular graphics system. DeLano Scientific, San Carlos, CA. [Google Scholar]
- Emsley P, Cowtan K 2004. Coot: Model-building tools for molecular graphics. Acta Crystallogr D Biol Crystallogr 60: 2126–2132 [DOI] [PubMed] [Google Scholar]
- The ENCODE Project Consortium 2011. A user's guide to the encyclopedia of DNA elements (ENCODE). PLoS Biol 9: e1001046. [DOI] [PMC free article] [PubMed] [Google Scholar]
- Friedman PN, Chen X, Bargonetti J, Prives C 1993. The p53 protein is an unusually shaped tetramer that binds directly to DNA. Proc Natl Acad Sci 90: 3319–3323 [DOI] [PMC free article] [PubMed] [Google Scholar]
- Grove CA, De Masi F, Barrasa MI, Newburger DE, Alkema MJ, Bulyk ML, Walhout AJ 2009. A multiparameter network reveals extensive divergence between C. elegans bHLH transcription factors. Cell 138: 314–327 [DOI] [PMC free article] [PubMed] [Google Scholar]
- Gupta S, Stamatoyannopoulos J, Bailey T, Noble W 2007. Quantifying similarity between motifs. Genome Biol 8: R24. [DOI] [PMC free article] [PubMed] [Google Scholar]
- Hannenhalli S, Levy S 2002. Predicting transcription factor synergism. Nucleic Acids Res 30: 4278–4284 [DOI] [PMC free article] [PubMed] [Google Scholar]
- He X, Chen CC, Hong F, Fang F, Sinha S, Ng HH, Zhong S 2009. A biophysical model for analysis of transcription factor interaction and binding site arrangement from genome-wide binding data. PLoS ONE 4: e8155. [DOI] [PMC free article] [PubMed] [Google Scholar]
- Hollenhorst PC, Chandler KJ, Poulsen RL, Johnson WE, Speck NA, Graves BJ 2009. DNA specificity determinants associate with distinct transcription factor functions. PLoS Genet 5: e1000778. [DOI] [PMC free article] [PubMed] [Google Scholar]
- Kahler RA, Westendorf JJ 2003. Lymphoid enhancer factor-1 and β-catenin inhibit Runx2-dependent transcriptional activation of the osteocalcin promoter. J Biol Chem 278: 11937–11944 [DOI] [PubMed] [Google Scholar]
- Levine M, Tjian R 2003. Transcription regulation and animal diversity. Nature 424: 147–151 [DOI] [PubMed] [Google Scholar]
- Littler DR, Alvarez-Fernández M, Stein A, Hibbert RG, Heidebrecht T, Aloy P, Medema RH, Perrakis A 2010. Structure of the FoxM1 DNA-recognition domain bound to a promoter sequence. Nucleic Acids Res 38: 4527–4538 [DOI] [PMC free article] [PubMed] [Google Scholar]
- Lupien M, Eeckhoute J, Meyer CA, Wang Q, Zhang Y 2008. FoxA1 translates epigenetic signatures into enhancer-driven lineage-specific transcription. Cell 132: 958–970 [DOI] [PMC free article] [PubMed] [Google Scholar]
- McLure KG, Lee PW 1998. How p53 binds DNA as a tetramer. EMBO J 17: 3342–3350 [DOI] [PMC free article] [PubMed] [Google Scholar]
- Mirny LA 2010. Nucleosome-mediated cooperativity between transcription factors. Proc Natl Acad Sci 107: 22534–22539 [DOI] [PMC free article] [PubMed] [Google Scholar]
- Myšičková A, Vingron M 2012. Detection of interacting transcription factors in human tissues using predicted DNA binding affinity. BMC Genomics 13: S2. [DOI] [PMC free article] [PubMed] [Google Scholar]
- Ng CK, Li NX, Chee S, Prabhakar S, Kolatkar PR, Jauch R 2012. Deciphering the Sox-Oct partner code by quantitative cooperativity measurements. Nucleic Acids Res 40: 4933–4941 [DOI] [PMC free article] [PubMed] [Google Scholar]
- Pique-Regi R, Degner JF, Pai AA, Gaffney DJ, Gilad Y, Pritchard JK 2011. Accurate inference of transcription factor binding from DNA sequence and chromatin accessibility data. Genome Res 21: 447–455 [DOI] [PMC free article] [PubMed] [Google Scholar]
- Pollard KS, Hubisz MJ, Rosenboom K, Siepel A 2010. Detection of non-neutral substitution rates on Mammalian phylogenies. Genome Res 20: 110–121 [DOI] [PMC free article] [PubMed] [Google Scholar]
- Qian J, Esumi N, Chen Y, Wang Q, Chowers I, Zack DJ 2005. Identification of regulatory targets of tissue-specific transcription factors: Application to retina-specific gene regulation. Nucleic Acids Res 33: 3479–3491 [DOI] [PMC free article] [PubMed] [Google Scholar]
- Rahmann S, Müller T, Vingron M 2003. On the power of profiles for transcription factor binding site detection. Stat Appl Genet Mol Biol 2 doi: 10.2202/1544-6115.0132 [DOI] [PubMed] [Google Scholar]
- Ravasi T, Suzuki H, Cannistraci CV, Katayama S, Bajic VB, Tan K, Akalin A, Schmeier S, Kanamori-Katayama M, Bertin N, et al. 2010. An atlas of combinatorial transcriptional regulation in mouse and man. Cell 140: 744–752 [DOI] [PMC free article] [PubMed] [Google Scholar]
- Reinhold MI, Naski MC 2007. Direct interactions of Runx2 and canonical Wnt signaling induce FGF18. J Biol Chem 282: 3653–3663 [DOI] [PubMed] [Google Scholar]
- Shaffer PL, Jivan A, Dollins DE, Claessens F, Gewirth DT 2004. Structural basis of androgen receptor binding to selective androgen response elements. Proc Natl Acad Sci 101: 4758–4763 [DOI] [PMC free article] [PubMed] [Google Scholar]
- Slattery M, Riley T, Liu P, Abe N, Gomez-Alcala P, Dror I, Zhou T, Rohs R, Honig B, Bussemaker HJ, et al. 2011. Cofactor binding evokes latent differences in DNA binding specificity between Hox proteins. Cell 147: 1270–1282 [DOI] [PMC free article] [PubMed] [Google Scholar]
- Tanaka N, Kawakami T, Taniguchi T 1993. Recognition DNA sequences of interferon regulatory factor 1 (IRF-1) and IRF-2, regulators of cell growth and the interferon system. Mol Cell Biol 13: 4531–4538 [DOI] [PMC free article] [PubMed] [Google Scholar]
- Treiber N, Treiber T, Zocher G, Grosschedl R 2010. Structure of an Ebf1:DNA complex reveals unusual DNA recognition and structural homology with Rel proteins. Genes Dev 24: 2270–2275 [DOI] [PMC free article] [PubMed] [Google Scholar]
- Umesono K, Murakami KK, Thompson CC, Evans RM 1991. Direct repeats as selective response elements for the thyroid hormone, retinoic acid, and vitamin D3 receptors. Cell 65: 1255–1266 [DOI] [PMC free article] [PubMed] [Google Scholar]
- Wang D, Garcia-Bassets I, Benner C, Li W, Su X, Zhou Y, Qiu J, Liu W, Kaikkonen MU, Ohgi KA, et al. 2011. Reprogramming transcription by distinct classes of enhancers functionally defined by eRNA. Nature 474: 390–394 [DOI] [PMC free article] [PubMed] [Google Scholar]
- Wang J, Zhuang J, Iyer S, Lin X, Whitfield TW, Greven MC, Pierce BG, Dong X, Kundaje A, Cheng Y, et al. 2012. Sequence features and chromatin structure around the genomic regions bound by 119 human transcription factors. Genome Res 22: 1798–1812 [DOI] [PMC free article] [PubMed] [Google Scholar]
- Whitington T, Frith MC, Johnson J, Bailey TL 2011. Inferring transcription factor complexes from ChIP-seq data. Nucleic Acids Res 39: e98. [DOI] [PMC free article] [PubMed] [Google Scholar]
- Wingender E, Dietze P, Karas H, Knuppel R 1996. TRANSFAC: A database on transcription factors and their DNA binding sites. Nucleic Acids Res 24: 238–241 [DOI] [PMC free article] [PubMed] [Google Scholar]
- Yu X, Lin J, Zack DJ, Qian J 2006. Computational analysis of tissue-specific combinatorial gene regulation: Predicting interaction between transcription factors in human tissues. Nucleic Acids Res 34: 4925–4936 [DOI] [PMC free article] [PubMed] [Google Scholar]
- Zaret KS, Carroll JS 2011. Pioneer transcription factors: Establishing competence for gene expression. Genes Dev 25: 2227–2241 [DOI] [PMC free article] [PubMed] [Google Scholar]