Abstract
Background. The gold nanoparticles (GNPs) have potential applications in cancer diagnosis and therapy. In an attempt to characterise the potential toxicity or hazards of GNPs as a therapeutic or diagnostic tool, the fluorescence spectra in several rat organs in vivo were measured after intraperitoneal administration of GNPs. Methods. The experimental rats were divided into control and six groups (G1A, G1B, G2A, G2B, G3A, and G3B; G1: 20 nm; G2: 10 nm; G3: 50 nm; A: infusion of GNPs for 3 days; B: infusion of GNPs for 7 days). The fluorescence measurements were investigated in the liver, kidney, heart, and lung organs of rats after intraperitoneal administration of GNPs for periods of 3 and 7 days in vivo. Results. The 10 and 20 nm GNPs exhibited spherical morphology shape, while the 50 nm GNPs exhibited hexagonal shape. A sharp decrease in the fluorescence intensity induced with the larger 50 nm GNPs in the liver, kidney, heart, and lung organs of rats at the exposure duration of 3 and 7 days in vivo compared with the smaller 10 and 20 nm GNPs was observed. Conclusions. The decrease in fluorescence intensity may be attributed to occurrence of strong quenching, decrease in number and surface area of GNPs, and high clearance of GNPs via urine and bile. Moreover, decreasing size may lead to an exponential increase in surface area relative to volume, thus making GNPs surface more reactive on aggregation and to its surrounding biological components. The size, shape, surface area, number, and clearance of GNPs play a key role in toxicity and accumulation in the different rat organs. This study demonstrates that fluorescence peak intensity is particle size and exposure duration dependent. This study suggests that fluorescence intensity can be used as a useful tool for pointing to bioaccumulation and toxicity induced by GNPs in the different rat organs.
1. Introduction
Fluorescence is the emission of light by a substance that has absorbed light or other electromagnetic radiation of a different wavelength. In most cases, the emitted light has a longer wavelength, and therefore lower energy, than the absorbed radiation. However, when the absorbed electromagnetic radiation is intense, it is possible for one electron to absorb two photons; this two-photon absorption can lead to emission of radiation having a shorter wavelength than the absorbed radiation. Fluorescence has many practical applications, including mineralogy, chemical sensors, dyes, and biological detectors [1].
Nanotechnology has recently emerged as a promising field for the treatment and diagnosis of a variety of diseases [2]. GNPs are particularly promising because of their ease of synthesis in various shapes and the potential for conjugation with peptides and proteins, which can target the GNPs to specific interaction partners [3].
The origin of the unique optical properties of GNPs is a phenomenon known as surface plasmon resonance (SPR). When an electromagnetic radiation, of a wavelength much smaller than the diameter of the GNPs, hits the particles, it induces coherent, resonant oscillations of the metal electrons across the NPs. These oscillations are known as the SPR, which lie within visible frequencies and result in strong optical absorbance and scattering properties of the GNPs [4, 5]. This property allows the use of GNPs for many applications, as Raman sensors [6], photocatalysts [7], and photoelectrochemical materials [8, 9], while in the bioscience and medical fields, GNPs can be used as immunostaining marker for electron microscopy and as chromophores for immunoreactions and nucleic acid hybridization [10, 11].
Numerous studies have shown that exposure to smaller sized particles can produce inflammatory and cytotoxic effects when compared to exposure to larger sized particles at equivalent mass concentration [22]. It is considered that smaller NPs can be more reactive with biological components and have adverse effects due to large surface area and much particle number [23].
Toxicity has been thought to originate from nanomaterial size and surface area, composition, and shape. The nanoparticle size plays a role in how the body responds to, distributes, and eliminates materials [7, 11]. The particle size can also affect the mode of endocytosis, cellular uptake, and the efficiency of particle processing in the endocytic pathway [24, 25].
The GNPs show several features that make them well suited for biomedical applications, including straightforward synthesis, stability, and the potential for surface modification with active biological molecules such as peptides or proteins [26]. Semmler-Behnke et al. [27] observed that a considerable percentage of 18 nm GNPs is removed from the blood and trapped predominantly in the liver and spleen.
The GNPs can be used in various biomedical applications; however, very little is known about their particle size and exposure duration dependence in vivo. The GNPs can offer great promise for biomedical applications, particularly in novel diagnostic and therapeutic methods [2]. Here, we focus our attention on aspects related to fluorescence spectroscopy for different GNP sizes dissolved in aqueous solution and at different exposure duration periods in several rat organs in vivo. Moreover, the GNPs size and shape are monitored by the transmission electron microscopy (TEM).
2. Materials and Methods
2.1. Gold Nanoparticles (GNPs)
The 10, 20, and 50 nm GNPs (products MKN-Au-010, MKN-Au-020, and MKN-Au-050, Canada, resp.) were purchased. All GNPs used in this study were in aqueous solution at a concentration of 0.01%. The mean size and morphology of these GNPs were evaluated using transmission electron microscope (TEM) images. Moreover, the homogeneity of GNPs in terms of shape and size was evaluated.
2.2. Animals
Healthy male Wistar-Kyoto rats were obtained from the Laboratory Animal Centre (College of Pharmacy, King Saud University). Rats of age 8–12 weeks (approximately 250 g body weight) were housed in pairs in humidity- and temperature-controlled ventilated cages on a 12 h day/night cycle. A conventional rodent diet and water were provided. Forty rats were individually caged and divided into a control group (NG: n = 10), group 1 (A: infusion of 20 nm GNPs for 3 days; n = 5; B: infusion of 20 nm GNPs for 7 days; n = 5), group 2 (A: infusion of 10 nm GNPs for 3 days; n = 5; B: infusion of 10 nm GNPs for 7 days; n = 5), and group 3 (A: infusion of 50 nm GNPs for 3 days; n = 5; B: infusion of 50 nm GNPs for 7 days; n = 5). Doses (50 μL) of 10, 20, or 50 nm GNPs in aqueous solution were administered to the animals via intraperitoneal injection every day for 3 or 7 days. The rats were anesthetised by inhalation of 5% isoflurane until muscular tonus relaxed. Liver, kidney, heart, and lung organs were dissected and collected from each rat. In order to assess rat organ uptake, as much blood as possible was collected from the rats to maximise residual blood drainage from the organs. All experiments were conducted in accordance with guidelines approved by the King Saud University Local Animal Care and Use Committee.
2.3. Digestion of Rat Organ Samples
Liver, kidney, heart, and lung samples were dissected from each rat, wet-digested with nitric acid, and stored as acidic digest solutions for analysis by fluorescence spectroscopy. The rat organs were first freeze-dried to minimize and to facilitate subsequent sample preparation steps. Each sample organ was then homogenised to a fine powder by ball milling in plastic containers. Approximately 0.20–0.25 g of powdered sample organ was weighed into a Teflon reaction vessel and 3 mL of HNO3 was added. The closed reaction vessel was heated in a 130°C oven until digestion was completed. The rat organ samples were then diluted to a final volume of 20 mL with quartz distilled water and stored in 1 oz. polyethylene bottles for subsequent fluorescence spectroscopy analysis.
2.4. Fluorescence Spectroscopy
Fluorescence spectra for several rat organs after intraperitoneal administration of 10, 20, or 50 nm GNPs and for periods of 3 and 7 days were obtained using a FluoroMax-2 spectrofluorometer (JOBIAN YVON-SPEX, Instruments S. A., Inc., France). Fluorescence measurements were made over the wavelength range 250–700 nm using 1 cm path length quartz cuvettes, which were cleaned before each use by sonicating for 5 min in deionised water and then rinsing with deionised water.
2.5. Histological Investigation
Fresh portions of liver, heart, kidney, and lung from each rat were cut rapidly, fixed in neutral buffered formalin (10%), and then dehydrated, with grades of ethanol (70, 80, 90, 95, and 100%). Dehydration was then followed by clearing the samples in 2 changes of xylene. Samples were then impregnated with 2 changes of molten paraffin wax, and then embedded and blocked out. Paraffin sections (4-5 μm) were stained with hematoxylin and eosin (the conventional histological and stain) according to [15–17]. Stained sections of control and treated rats were examined for alterations in the hepatocytes for the presence of inflammatory, fatty change and Kupffer cells hyperplasia and necrosis [13–15].
3. Results and discussion
3.1. Size and Morphology of Different GNPs
The 10 and 20 nm GNPs showed spherical morphology with a narrow particle size distribution when dispersed in solution. The mean size for these GNPs was calculated from the TEM images. The mean measured size was 9.45 ± 1.33 nm for 10 nm GNPs and 20.18 ± 1.80 nm for 20 nm GNPs. GNPs of 50 nm diameters, in contrast, were not spherical but hexagonal in TEM images, as shown in Figures 1 and 2. The high electron density and homogeneous shape and size of the GNPs make them highly conspicuous under the TEM [12].
Figure 1.
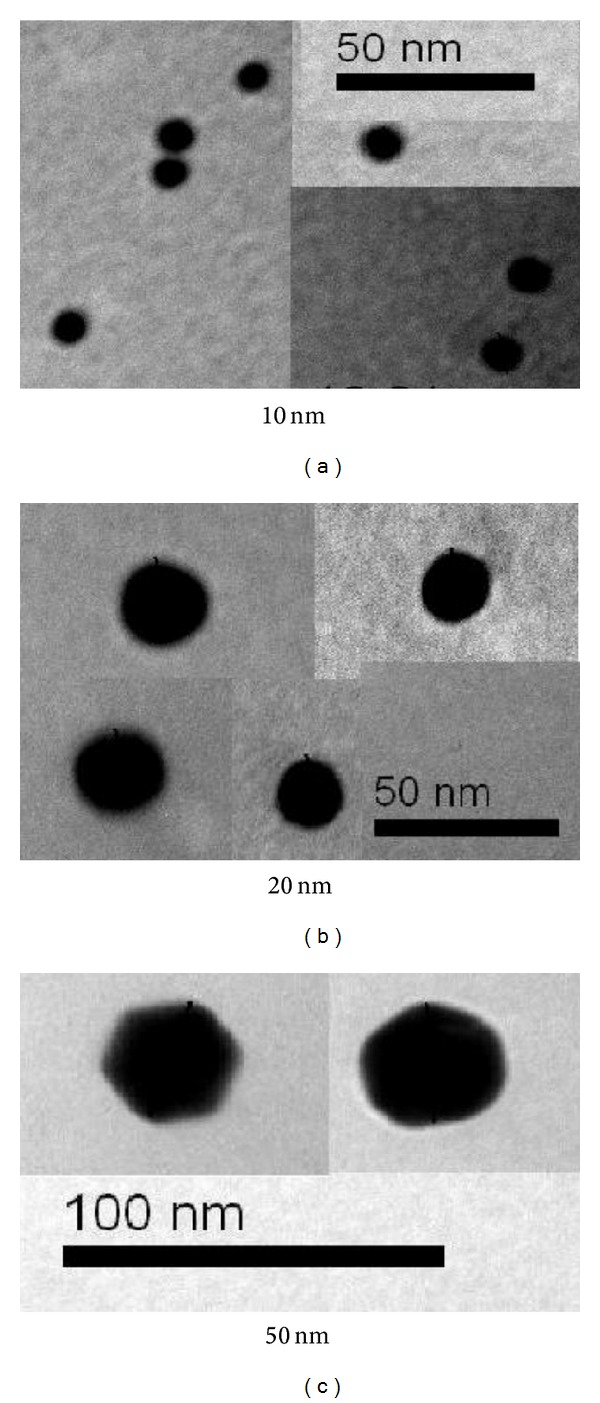
TEM images for different GNP samples [12].
Figure 2.
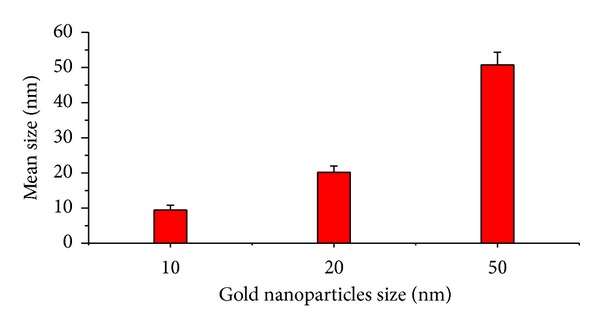
The size of 10, 20, and 50 nm gold nanoparticles measured using TEM images [12].
The size effect of GNPs at the infusion periods of 3 days (G1A, G2A, and G3A) and 7 days (G1B, G2B, and G3B) on the fluorescence intensity of the liver organ is shown in Figure 3. The fluorescence peak intensity increased for G1A, G2A, G1B, and G2B and decreased for G3A and G3B compared with the control. The fluorescence peak intensity for G1B was higher than G1A and for G2B than G2A [12, 28–30]. This result demonstrates that the fluorescence intensity is GNPs size and exposure duration dependent.
Figure 3.
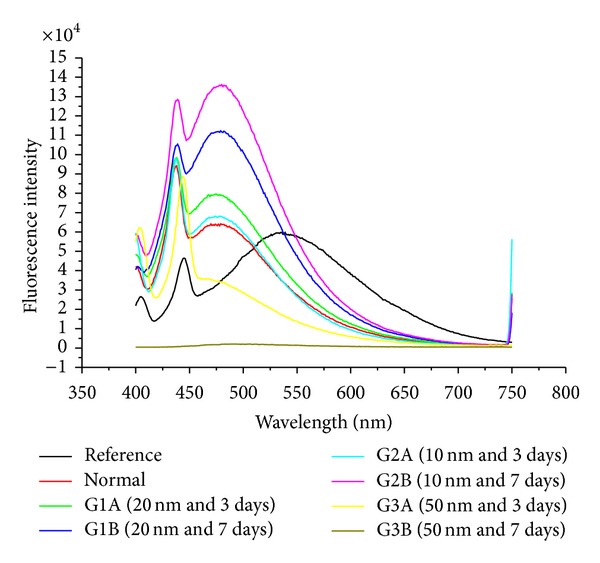
The liver fluorescence emission peak intensities after intraperitoneal administration of 10, 20, and 50 nm GNPs for periods of 3 and 7 days.
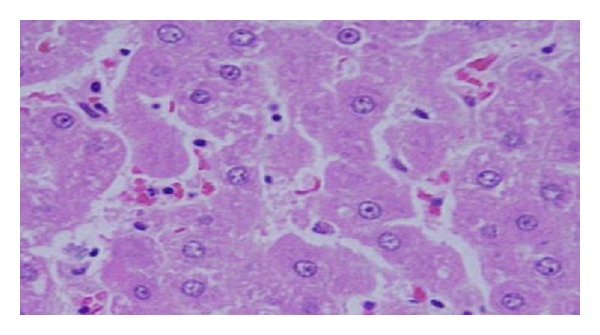
GNPs-normal rat demonstrated that normal hepatocyte is shown in Figure 4. Cloudy swelling with pale cytoplasm and poorly delineated and displaced nuclei in all GNPs-treated rats observed (Figure 5). The ballooning degeneration was more prominent with 10 nm size particles than the larger ones. This swelling might be exhibited as a result of disturbances of membranes function leads to massive influx of water and Na+ due to GNPS effects. Cellular swelling might be accompanied by leakage of lysosomal hydrolytic enzymes that lead to cytoplasmic degeneration and macromolecular crowding [13–15]. The vacuolated swelling of the cytoplasm of the hepatocytes of the GNPs-treated rats might indicate acute and subacute liver injury induced by these NPs. Variable nuclei sizes were observed in some hepatocytes.
Figure 4.
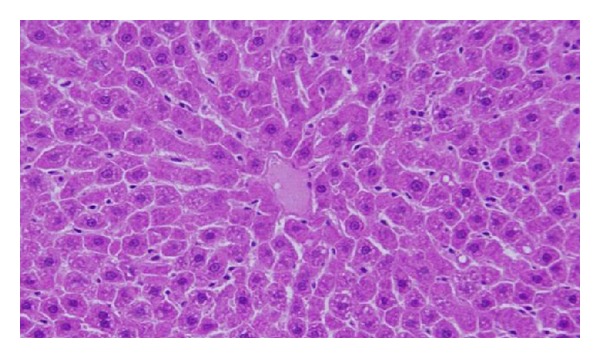
GNPs-normal rat demonstrated normal hepatocyte.
Figure 5.
GNPs-treated rat received 50 μL of 10 nm GNPs for 3 days [13–15].
The GNPs-normal rat demonstrated normal hepatocyte (Figure 4). The GNPs-treated rat received 50 μL of 10 nm GNPs for 3 days demonstrating hepatocytes cloudy swelling [13–15] (Figure 5).
The sinusoidal Kupffer cells became prominent and increased in number due to GNPs exposure. This change was more prominent with 10 nm GNPs and dose of 100 μL than 50 nm GNPS and more after 7 days of administration than rats exposed to GNPs for 3 days as shown in Figure 6. Kupffer cells activation might indicate that GNPs activate the phagocytic activity of the sinusoidal cells by increasing the number of kupffer cells to help in removing the accumulated GNPs where lysosomes are involved in the intracellular breakdown into small metabolic products. The produced Kupffer cells hyperplasia might be correlated with the amount of injurious to the hepatic tissue induced by GNPs intoxication and represent a defense mechanism of detoxification. Kupffer cell hyperplasia contributes to hepatic oxidative stress [13, 14].
Figure 6.
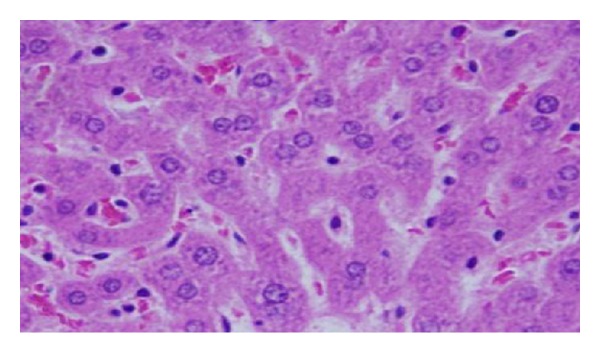
GNPs-treated rat received 50 μL of 10 nm particles for 7 days [13–15].
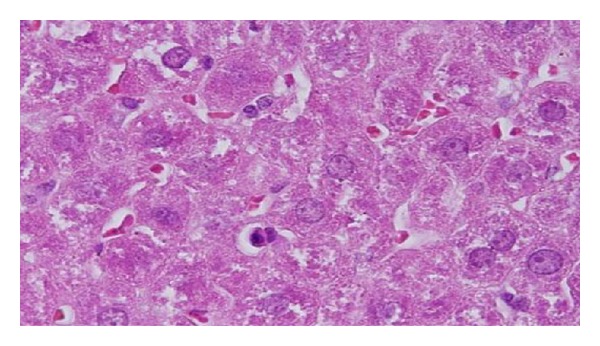
Sporadic spotty well-defined necrosis was noticed in some hepatocytes of GNPs-treated rats. The insulted cells exhibited highly eosinophilic amorphous cytoplasm with occasional apoptotic characterization (Figure 7). This alteration was detected in the liver of rats exposed to 10 nm size GNPs but was not seen with those exposed to 50 nm size GNPs. Apoptotic alteration might be followed by organelles swelling, specially mitochondria, endoplasmic reticulum, and rupture of lysosomes which might lead to amorphous eosinophilic cytoplasm as an initial sign in the sequence of hepatocytes necrosis before shrinking and dissolution of nuclei [13, 14]. The seen hepatocytes necrosis due to GNPs exposure might indicate oxidative stress on these cells by glutathione depletion [16, 17].
Figure 7.
GNPs-treated rat received 50 μL of 10 nm particles for 3 days [13–15].
The size effect of GNPs at the infusion periods of 3 days (G1A, G2A, and G3A) and 7 days (G1B, G2B, and G3B) on the fluorescence intensity of the kidney organ is shown in Figure 8. The fluorescence peak intensity increased for G1A, G2A, G1B, and G2B and decreased for G3A and G3B compared with the control. The fluorescence peak intensity for G1B was higher than G1A and for G2B than G2A [12, 28–30]). This result demonstrates that the fluorescence intensity is GNPs size and exposure duration dependent.
Figure 8.
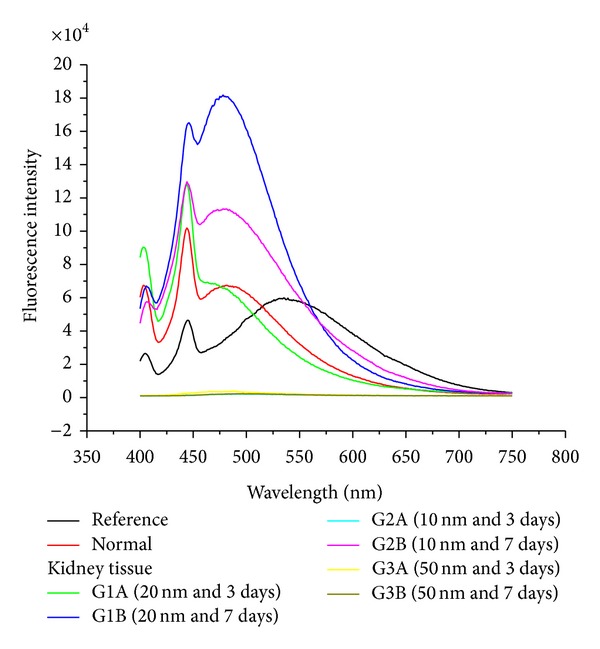
The kidney fluorescence emission peak intensities after intraperitoneal administration of 10, 20, and 50 nm GNPs for periods of 3 and 7 days.
The GNPs-treated rat which received 50 μL of 10 nm particles for 3 days demonstrated glomerular congestion (arrow) [18, 19] (Figure 9). The GNPs-treated rat which received 50 μL of 10 nm particles for 3 days demonstrated vacuolar degeneration stars): vacuolization of the renal cells was seen and increased in severity in the renal tubules of rats which received 100 μL of 10 or 20 nm GNPs with less or no vacuolar degeneration with 50 nm particles. More vacuolar degeneration was observed in the renal cells of rats exposed to 7 days than ones exposed to 3 days [18, 19] (Figure 10). The GNPs-treated rat which received 50 μL of 10 nm particles for 3 days demonstrated hyaline droplets in the cytoplasm of the renal cells (arrows). Hyaline droplets were detected in the renal epithelium of rats which received 100 μL of 10 or 20 nm GNPs. Droplets appearance is associated with protein metabolism disturbances. This alteration was not seen in the renal tissue of rats exposed to 50 nm particles [18, 19] (Figure 11).
Figure 9.
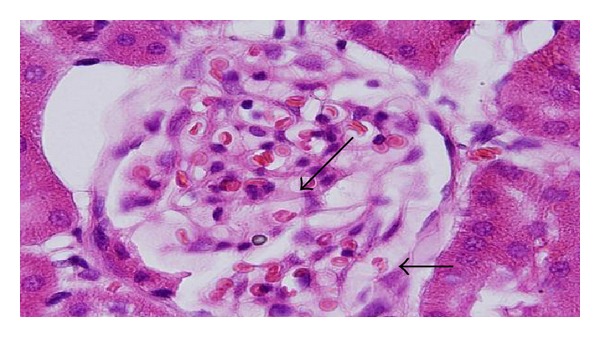
GNPs-treated rat received 50 μL of 10 nm particles for 3 days [16, 17].
Figure 10.
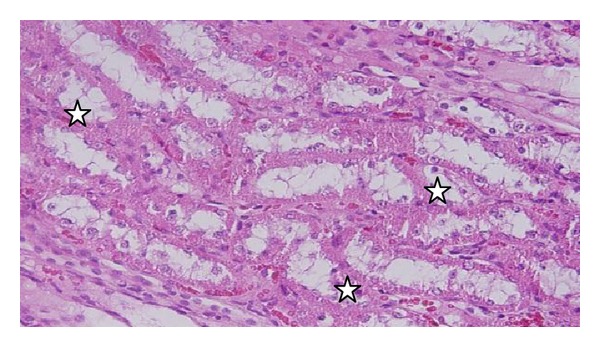
GNPs-treated rat received 50 μL of 10 nm particles for 3 days [16, 17].
Figure 11.
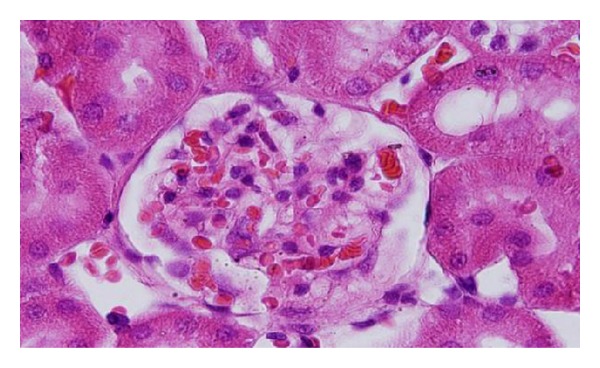
GNPs-treated rat received 50 μL of 10 nm particles for 3 days [16, 17].
The size effect of GNPs at the infusion periods of 3 days (G1A, G2A, and G3A) and 7 days (G1B, G2B, and G3B) on the fluorescence intensity of the heart organ is shown in Figure 12. The fluorescence peak intensity increased for G1A, G2A, G1B, and G2B and decreased for G3A and G3B compared with the control. The fluorescence peak intensity for G1B was higher than G1A and for G2B than G2A [12, 28–30]. This result demonstrates that the fluorescence intensity is GNPs size and exposure duration dependent.
Figure 12.
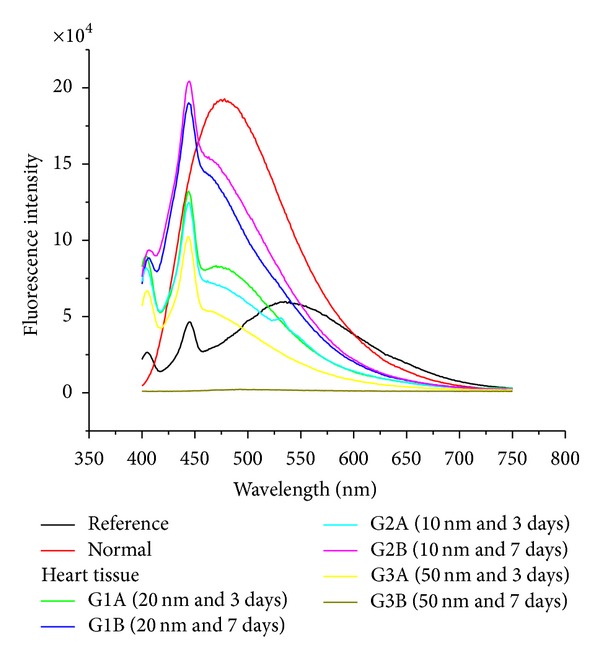
The heart fluorescence emission peak intensities after intraperitoneal administration of 10, 20, and 50 nm GNPs for periods of 3 and 7 days.
Microscopic pictures show that GNPs-normal rat demonstrated benign, blunt-looking heart muscle with various heart muscle orientations and with no pathological findings [18, 19] (Figure 13). The GNPs-treated rat which received 50 μL of 10 nm particles for 3 days demonstrated extravasation of red blood cells with few scattered lymphocytic infiltrate [18, 19] (Figure 14). The GNPs-treated rat which received 50 μL of 10 nm particles for 7 days demonstrated scattered foci of hemorrhage with extravasation of red blood cells, a few scattered cytoplasmic vacuolization [18, 19] (Figure 15).
Figure 13.
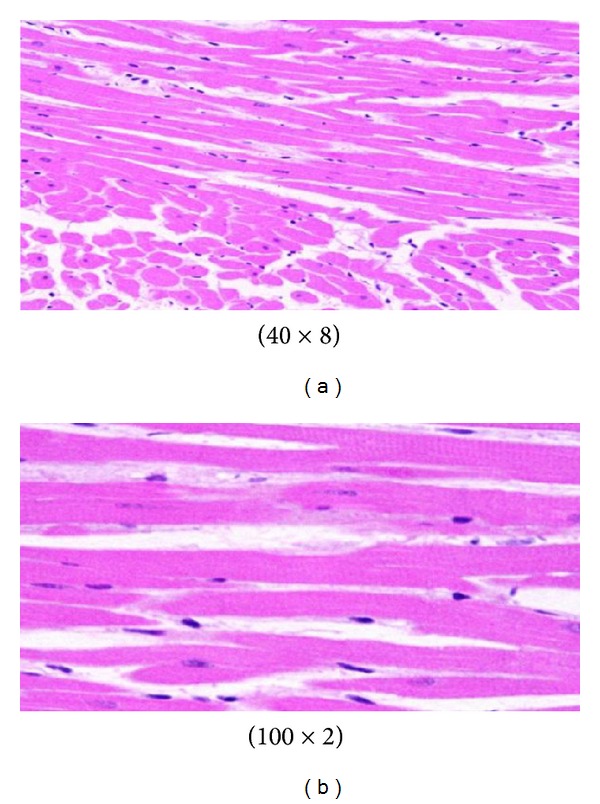
Figure 14.
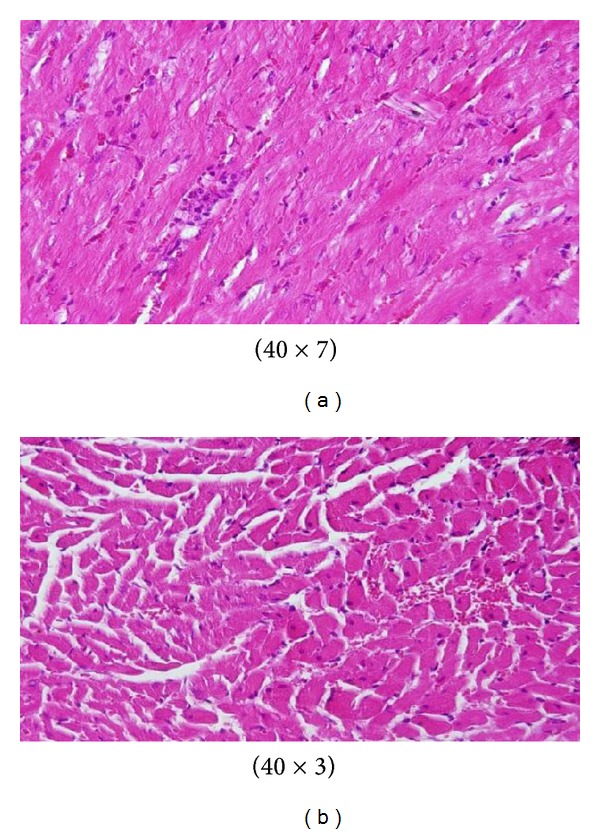
GNPs-treated rat received 50 μL of 10 nm particles for 3 days [18, 19].
Figure 15.
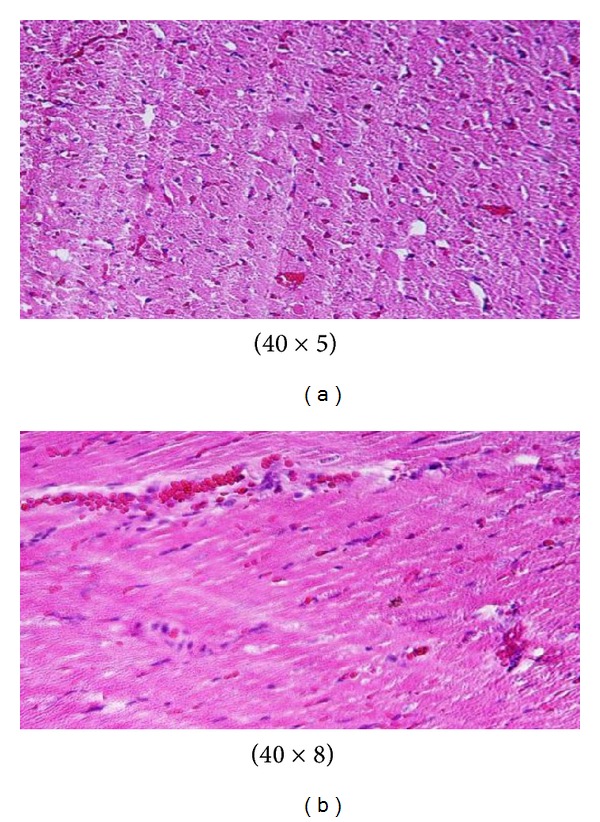
GNPs-treated rat received 50 μL of 10 nm particles for 7 days [18, 19].
The size effect of GNPs at the infusion periods of 3 days (G1A, G2A, and G3A) and 7 days (G1B, G2B, and G3B) on the fluorescence intensity of the lung organ is shown in Figure 16. The fluorescence peak intensity increased for G1A, G2A, and G1B and decreased for G2B, G3A, and G3B compared with the control. The fluorescence peak intensity for G1A was higher than G1B, and for G2A than G2B [12, 28–30]. This result demonstrates that the fluorescence intensity is GNPs size and exposure duration dependent.
Figure 16.
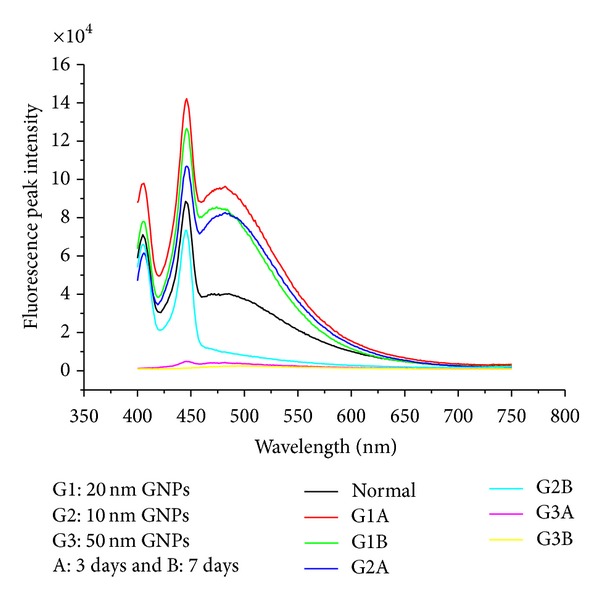
The lung fluorescence emission peak intensities after intraperitoneal administration of 10, 20 and 50 nm GNPs for periods of 3 and 7 days.
Control group: microscopic pictures show that GNP-normal rats demonstrated well-formed and open alveoli with normal spate, few scattered small lymphocytes, and minimal eosinophils [20, 21] (Figure 17). The GNPs-treated rats which received 50 μL of 10 nm GNPs for 3 days demonstrated more diffuse interstitial pneumonia, dense inflammatory cell infiltrates of small lymphocytes, fibrosis, and more prominent extravasation of red blood cells [20, 21] (Figure 18). The GNP-treated rats which received 50 μL of 10 nm particles for 7 days demonstrated prominent chronic inflammatory cell infiltrates surrounded by dilated and congested blood vessels, scattered dense extravasation of red blood cells, and foci of hemosiderin granules [20, 21] (Figure 19).
Figure 17.
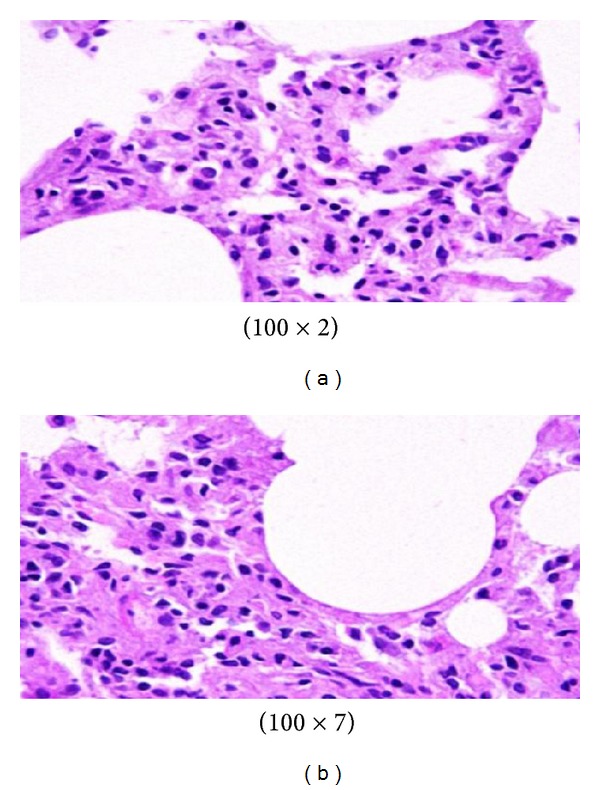
Control group: microscopic pictures show GNP-normal rats [20, 21].
Figure 18.
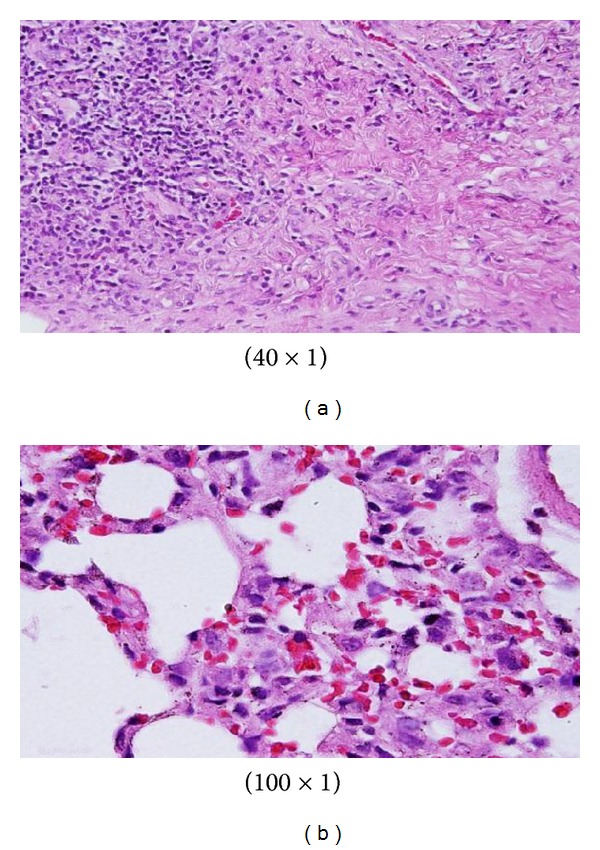
GNPs-treated rats received 50 μL of 10 nm GNPs for 3 days [20, 21].
Figure 19.
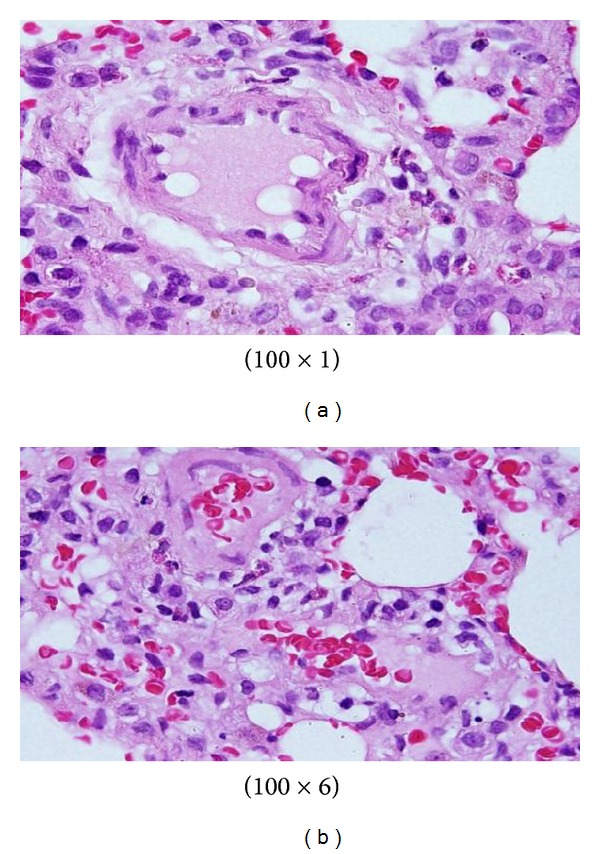
GNP-treated rats received 50 μL of 10 nm particles for 7 days [20, 21].
The level of superoxide dismutase (SOD) significantly decreased in rat kidney liver and lung organs after intraperitoneal administration of 10 nm GNPs for exposure duration of 3 and 7 days compared with the control (Figure 20). The SOD which catalyzes the dismutation of the superoxide anion (O2 ∙−) into hydrogen peroxide and molecular oxygen is one of the most important antioxidative enzymes.
Figure 20.
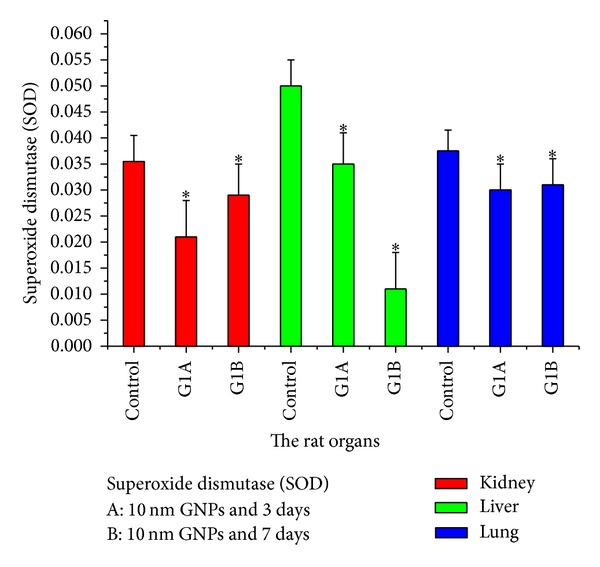
The superoxide dismutase (SOD) levels after intraperitoneal administration of 10 nm GNPs for exposure duration of 3 (G1A) and 7 (G1B) days in the rat kidney, liver, and lung organs.
The malondialdehyde (MDA: lipid peroxidation) values significantly increased in rat liver, lung, heart, and kidney organs after intraperitoneal administration of 10 nm GNPs for exposure duration of 3 and 7 days compared with the control (Figure 21). This indicates the increased production of free radicals or ROS in these organs as a result of intraperitoneal administration of GNPs into rats, concomitant with the increased production of MDA. Haseeb Khan et al. [31] found the same result for MDA in rat liver organ. The smaller particles tend to be more toxic than the larger ones. The exposure of GNPs (average diameter 5.3 ± 1 nm) produced oxidative stress within 24 h in mytilusedulis [32, 33].
Figure 21.
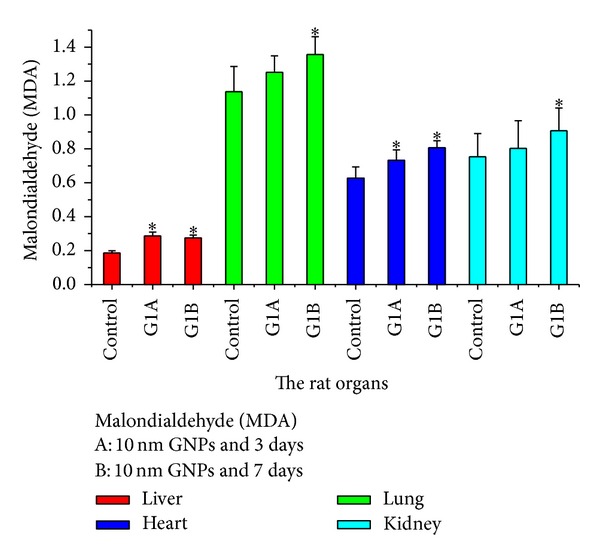
The malondialdehyde (MDA) levels after intraperitoneal administration of 10 nm GNPs for exposure duration of 3 (G1A) and 7 (G1B) days in the rat liver, lung, heart, and kidney organs.
The organ distributions of GNPs are size dependent, while small GNPs of 5–15 nm have wider organ distribution than that of large GNPs of 50–100 nm [27, 34, 35]. It has been found that GNPs with a long blood circulation time can accumulate in the liver and spleen and significantly affect the gene expression [36]. Thus, the hepatotoxicity of GNPs may be attributed to accumulation of NPs in liver.
The liver and spleen are considered two dominant organs for biodistribution and metabolism of GNPs [27, 34–36]. If GNPs are larger than renal filtration cutoff, they are not excreted in urine; instead they are eliminated from the blood by the reticuloendothelial system and thus tend to accumulate in the spleen and liver [34, 37].
The decrease in fluorescence intensity observed with the larger 50 nm GNPs compared with the smaller 10 and 20 nm GNPs may be attributed to the following factors: (1) formation of a strong ground state complex between serum albumins and GNPs (static quenching); (2) differences in the physical and chemical properties of nanoparticles of different sizes and shapes (the 50 nm GNPs were hexagonal, and nanoparticle properties are highly size and shape dependent); (3) faster uptake of and clearance by liver macrophages of the 50 nm GNPs compared to the other nanoparticles.
The fluorescence peak intensity in the liver, kidney, and heart organs of rats for G1B was higher than G1A and for G2B than G2A. This result demonstrates that the fluorescence intensity is GNPs size and exposure duration dependent, while the fluorescence peak intensity in the lung organ of rats for G1A was higher than G1B and for G2A than G2B. This result demonstrates that the fluorescence intensity is GNPs size and exposure duration dependent.
The results of this study indicate that decrease in GNPs size produces an exponential increase in surface area relative to volume, which may make the GNPs more self-reactive (i.e., may promote aggregation) and more prone to interactions with surrounding molecules (biological components). Moreover, increased uptake of NPs may lead to accumulation in certain tissues, where the particles may interfere with critical biological functions [9, 24].
The smaller nanoparticles size imparts physical and chemical properties that are very different from those of the same material in bulk form. They have a larger surface area to volume ratio compared to bulk materials; they may thus exhibit an enhanced or hindered tendency to aggregate (depending on the surface chemistry), enhanced photoemission, high electrical or heat conductivity, or improved surface catalytic activity [22, 24].
The nanoparticle surfaces can interact with biological components, and nanoparticles may be more reactive than larger particles toward biomolecules. It has been shown, for example, that the severity and the likelihood of inflammatory response transiently increased, within 12 h, following injection of 200 or 100 nm GNPs into experimental animals. GNPs were ultimately trapped by macrophages in the spleen and liver and remained in these tissues until 4 weeks after the single injection [10].
The present results suggest that the larger 50 nm GNPs may be highly cleared via urine and bile. Nanoparticles for therapeutic use need to have a long retention time in order to encounter and interact with the desired target. However, a long retention time can result in toxic effects in vivo. Thus, route and rate of nanomaterial clearance is an important issue [38]. The absorbed nanoparticles in the systemic circulation can be excreted through various routes, such as the kidneys or bile. Renal clearance of solid nanosized materials is known to be influenced by particle size and surface charge [38, 39].
The smaller 10 and 20 nm GNPs have shown a propensity to accumulate in the several rat organs following injection. The rat organs distribution of GNPs was size and exposure duration dependent; the smaller GNPs showed the most widespread organ accumulation and distribution.
4. Conclusions
The aim of the present study was to evaluate the fluorescence spectra of several rat organs after intraperitoneal administration of 10, 20, and 50 nm GNPs at exposure duration of 3 and 7 days in vivo in an attempt to characterise the potential toxicity or hazards of GNPs as a therapeutic tool.
High electron density and homogeneous shape and size make GNPs highly conspicuous in TEM images. The 10 and 20 nm GNP exhibited spherical morphology shape, while the 50 nm GNPs exhibited hexagonal shape.
A sharp decrease in fluorescence intensity induced with the larger 50 nm GNPs in the liver, kidney, heart, and lung organs of rat in vivo was observed. This decrease may be attributed to occurrence of strong quenching, and decrease in number and surface area of GNPs in addition to high clearance of GNPs via urine and bile. Moreover, the decrease in size may lead to an exponential increase in surface area relative to volume, thus making GNPs surface more reactive on itself (aggregation) and to its surrounding environment (biological components).
This study demonstrates that fluorescence peak intensity is particle size and exposure duration dependent. The size, shape, surface area, number, and clearance of GNPs play a key role in toxicity, and the distribution and accumulation of GNPs in the different rat organs may be mediated by dynamic protein binding and exchange. This study suggests that fluorescence intensity may be used as a useful and important diagnostic tool for the distribution and bioaccumulation induced by the administration of GNPs to rats.
Authors' Contribution
M. A. K. Abdelhalim has analysed the data, interpreted and written the final draft of this paper. The animal model used in this study was obtained from the Laboratory Animal Center (College of Pharmacy, King Saud University, Saudi Arabia). M. A. K. Abdelhalim has conceived the study and its design and obtained research grants for this study. Moreover, the author have read and approved the final paper.
Conflict of Interests
The author declares that he has no conflict of interests.
Acknowledgments
The author is very grateful to the National Plan of Science and Technology (NPST). This research was financially supported by the National Science and Technology Innovation Plan (NSTIP), Research no. 08-ADV206-02 and Research no. 09-NAN670-02, College of Science, King Saud University, Saudi Arabia. The author would like to extend his sincere appreciation to the Deanship of Scientific Research at King Saud University for its funding of this research through the research Group Project no. RGP-VPP-285.
References
- 1.Lakowicz JR, Barry R. Principles of Fluorescence Spectroscopy. 3rd edition. Springer; 2008. [Google Scholar]
- 2.Caruthers SD, Wickline SA, Lanza GM. Nanotechnological applications in medicine. Current Opinion in Biotechnology. 2007;18(1):26–30. doi: 10.1016/j.copbio.2007.01.006. [DOI] [PubMed] [Google Scholar]
- 3.Kogan MJ, Olmedo I, Hosta L, Guerrero AR, Cruz LJ, Albericio F. Peptides and metallic nanoparticles for biomedical applications. Nanomedicine. 2007;2(3):287–306. doi: 10.2217/17435889.2.3.287. [DOI] [PubMed] [Google Scholar]
- 4.Schmid G. Large clusters and colloids. Metals in the embryonic state. Chemical Reviews. 1992;92(8):1709–1727. [Google Scholar]
- 5.Jain PK, ElSayed IH, El-Sayed MA. Au nanoparticles target cancer. Nano Today. 2007;2(1):18–29. [Google Scholar]
- 6.Tian Z-Q, Ren B, Wu D-Y. Surface-enhanced Raman scattering: from noble to transition metals and from rough surfaces to ordered nanostructures. Journal of Physical Chemistry B. 2002;106(37):9463–9483. [Google Scholar]
- 7.Kamat PV. Photophysical, photochemical and photocatalytic aspects of metal nanoparticles. Journal of Physical Chemistry B. 2002;106(32):7729–7744. [Google Scholar]
- 8.Shipway AN, Katz E, Willner I. Nanoparticle arrays on surfaces for electronic, optical, and sensor applications. ChemPhysChem. 2000;1(1):18–52. doi: 10.1002/1439-7641(20000804)1:1<18::AID-CPHC18>3.0.CO;2-L. [DOI] [PubMed] [Google Scholar]
- 9.Kuwahara Y, Akiyama T, Yamada S. Facile fabrication of photoelectrochemical assemblies consisting of gold nanoparticles and a tris(2,2′-bipyridine)ruthenium(II)-viologen linked thiol. Langmuir. 2001;17(19):5714–5716. [Google Scholar]
- 10.Mirkin CA, Letsinger RL, Mucic RC, Storhoff JJ. A DNA-based method for rationally assembling nanoparticles into macroscopic materials. Nature. 1996;382(6592):607–609. doi: 10.1038/382607a0. [DOI] [PubMed] [Google Scholar]
- 11.Huber M, Wei T-F, Müller UR, Lefebvre PA, Marla SS, Bao YP. Gold nanoparticle probe-based gene expression analysis with unamplified total human RNA. Nucleic Acids Research. 2004;32(18):e137–e145. doi: 10.1093/nar/gnh133. [DOI] [PMC free article] [PubMed] [Google Scholar]
- 12.Abdelhalim MAK, Mady M. Liver uptake of gold nanoparticles after intraperitoneal administration in vivo: a fluorescence study. Lipids in Health and Disease. 2011;10, article 195 doi: 10.1186/1476-511X-10-195. [DOI] [PMC free article] [PubMed] [Google Scholar]
- 13.Abdelhalim MAK, Jarrar BM. Gold nanoparticles administration induced prominent inflammatory, central vein intima disruption, fatty change and Kupffer cells hyperplasia. Lipids in Health and Disease. 2011;10, article 133 doi: 10.1186/1476-511X-10-133. [DOI] [PMC free article] [PubMed] [Google Scholar]
- 14.Abdelhalim MAK, Jarrar BM. Gold nanoparticles induced cloudy swelling to hydropic degeneration, cytoplasmic hyaline vacuolation, polymorphism, binucleation, karyopyknosis, karyolysis, karyorrhexis and necrosis in the liver. Lipids in Health and Disease. 2011;10, article 166 doi: 10.1186/1476-511X-10-166. [DOI] [PMC free article] [PubMed] [Google Scholar]
- 15.Abdelhalim MAK, Jarrar BM. Histological alterations in the liver of rats induced by different gold nanoparticle sizes, doses and exposure duration. Journal of Nanobiotechnology. 2012;10, article 5 doi: 10.1186/1477-3155-10-5. [DOI] [PMC free article] [PubMed] [Google Scholar]
- 16.Abdelhalim MAK, Jarrar BM. Renal tissue alterations were size-dependent with smaller ones induced more effects and related with time exposure of gold nanoparticles. Lipids in Health and Disease. 2011;10, article 163 doi: 10.1186/1476-511X-10-163. [DOI] [PMC free article] [PubMed] [Google Scholar]
- 17.Abdelhalim MAK, Jarrar BM. The appearance of renal cells cytoplasmic degeneration and nuclear destruction might be an indication of GNPs toxicity. Lipids in Health and Disease. 2011;10, article 147 doi: 10.1186/1476-511X-10-147. [DOI] [PMC free article] [PubMed] [Google Scholar]
- 18.Abdelhalim MAK. Exposure to gold nanoparticles produces cardiac tissue damage that depends on the size and duration of exposure. Lipids in Health and Disease. 2011;10, article 205 doi: 10.1186/1476-511X-10-205. [DOI] [PMC free article] [PubMed] [Google Scholar]
- 19.Abdelhalim MAK. Gold nanoparticles administration induces disarray of heart muscle, hemorrhagic, chronic inflammatory cells infiltrated by small lymphocytes, cytoplasmic vacuolization and congested and dilated blood vessels. Lipids in Health and Disease. 2011;10, article 233 doi: 10.1186/1476-511X-10-233. [DOI] [PMC free article] [PubMed] [Google Scholar]
- 20.Abdelhalim MAK. Exposure to gold nanoparticles produces pneumonia, fibrosis, chronic inflammatory cell infiltrates, congested and dilated blood vessels, and hemosiderin granule and emphysema foci. Journal of Cancer Science and Therapy. 2012;4(3):46–50. [Google Scholar]
- 21.Abdelhalim MAK. Lung tissue alterations were size-dependent with smaller ones induced more effects and related with time exposure of gold nanoparticles. Journal of Cancer Science & Therapy. 2012;4, article 6 [Google Scholar]
- 22.Wang X, Duan S, Geng B, Cui J, Yang Y. Schmeissneria: a missing link to angiosperms? BMC Evolutionary Biology. 2007;7, article 14 doi: 10.1186/1471-2148-7-14. [DOI] [PMC free article] [PubMed] [Google Scholar]
- 23.Nel A, Xia T, Mädler L, Li N. Toxic potential of materials at the nanolevel. Science. 2006;311(5761):622–627. doi: 10.1126/science.1114397. [DOI] [PubMed] [Google Scholar]
- 24.Liu WT. Nanoparticles and their biological and environmental applications. Journal of Bioscience and Bioengineering. 2006;102:1–7. doi: 10.1263/jbb.102.1. [DOI] [PubMed] [Google Scholar]
- 25.Baptista P, Pereira E, Eaton P, et al. Gold nanoparticles for the development of clinical diagnosis methods. Analytical and Bioanalytical Chemistry. 2008;391(3):943–950. doi: 10.1007/s00216-007-1768-z. [DOI] [PubMed] [Google Scholar]
- 26.Pissuwan D, Valenzuela SM, Cortie MB. Therapeutic possibilities of plasmonically heated gold nanoparticles. Trends in Biotechnology. 2006;24(2):62–67. doi: 10.1016/j.tibtech.2005.12.004. [DOI] [PubMed] [Google Scholar]
- 27.Semmler-Behnke M, Kreyling WG, Lipka J, et al. Biodistribution of 1.4- and 18-nm gold particles in rats. Small. 2008;4(12):2108–2111. doi: 10.1002/smll.200800922. [DOI] [PubMed] [Google Scholar]
- 28.Abdelhalim MAK. The period effects of intraperitoneal administration of different gold nanoparticle sizes on kidney tissue of rat in vivo using fluorescence measurements. African Journal of Microbiology Research. 2011;5(21):3588–3595. [Google Scholar]
- 29.Abdelhalim MAK. The period effects of intraperitoneal administration of different gold nanoparticle sizes on heart tissue of rats using fluorescence measurements: in vivo. International Journal of Physical Sciences. 2011;6(26):6166–6170. [Google Scholar]
- 30.Abdelhalim MAK. The period effects of intraperitoneal administration of different gold nanoparticle sizes on heart tissue of rats using fluorescence measurements: in vivo. Scientific Research and Essays. 2011;6(25):5403–5410. [Google Scholar]
- 31.Haseeb Khan A, Abdelhalim MAK, Al-Ayed MS, Abdullah Alhomida S. Effect of GNPs on glutathione and malondialdehyde levels in liver, lung, heart and kidney of rats in vivo. Saudi Journal of Biological Sciences. 2012;19:461–464. doi: 10.1016/j.sjbs.2012.06.005. [DOI] [PMC free article] [PubMed] [Google Scholar]
- 32.Tedesco S, Doyle H, Blasco J, Redmond G, Sheehan D. Oxidative stress and toxicity of gold nanoparticles in Mytilus edulis . Aquatic Toxicology. 2010;100(2):178–186. doi: 10.1016/j.aquatox.2010.03.001. [DOI] [PubMed] [Google Scholar]
- 33.Tedesco S, Doyle H, Blasco J, Redmond G, Sheehan D. Exposure of the blue mussel, Mytilus edulis, to gold nanoparticles and the pro-oxidant menadione. Comparative Biochemistry and Physiology C. 2010;151(2):167–174. doi: 10.1016/j.cbpc.2009.10.002. [DOI] [PubMed] [Google Scholar]
- 34.De Jong WH, Hagens WI, Krystek P, Burger MC, Sips AJAM, Geertsma RE. Particle size-dependent organ distribution of gold nanoparticles after intravenous administration. Biomaterials. 2008;29(12):1912–1919. doi: 10.1016/j.biomaterials.2007.12.037. [DOI] [PubMed] [Google Scholar]
- 35.Chen Y-S, Hung Y-C, Liau I, Huang GS. Assessment of the in vivo toxicity of gold nanoparticles. Nanoscale Research Letters. 2009;4(8):858–864. doi: 10.1007/s11671-009-9334-6. [DOI] [PMC free article] [PubMed] [Google Scholar]
- 36.Balasubramanian SK, Jittiwat J, Manikandan J, Ong C-N, Yu LE, Ong W-Y. Biodistribution of gold nanoparticles and gene expression changes in the liver and spleen after intravenous administration in rats. Biomaterials. 2010;31(8):2034–2042. doi: 10.1016/j.biomaterials.2009.11.079. [DOI] [PubMed] [Google Scholar]
- 37.Von Maltzahn G, Park J-H, Agrawal A, et al. Computationally guided photothermal tumor therapy using long-circulating gold nanorod antennas. Cancer Research. 2009;69(9):3892–3900. doi: 10.1158/0008-5472.CAN-08-4242. [DOI] [PMC free article] [PubMed] [Google Scholar]
- 38.Choi CJ, Anantharam V, Saetveit NJ, Houk RS, Kanthasamy A, Kanthasamy AG. Normal cellular prion protein protects against manganese-induced oxidative stress and apoptotic cell death. Toxicological Sciences. 2007;98(2):495–509. doi: 10.1093/toxsci/kfm099. [DOI] [PMC free article] [PubMed] [Google Scholar]
- 39.Gupta R. System behaviour of wood truss assemblies. Progress in Structural Engineering and Materials. 2005;7(4):183–193. [Google Scholar]


