

Abstract
How the cell converts graded signals into threshold-activated responses is a question of great biological relevance. Here, we uncover a nonlinear modality of epidermal growth factor receptor (EGFR)-activated signal transduction, by demonstrating that the ubiquitination of the EGFR at the PM is threshold controlled. The ubiquitination threshold is mechanistically determined by the cooperative recruitment of the E3 ligase Cbl, in complex with Grb2, to the EGFR. This, in turn, is dependent on the simultaneous presence of two phosphotyrosines, pY1045 and either one of pY1068 or pY1086, on the same EGFR moiety. The dose–response curve of EGFR ubiquitination correlate precisely with the non-clathrin endocytosis (NCE) mode of EGFR internalization. Finally, EGFR-NCE mechanistically depends on EGFR ubiquitination, as the two events can be simultaneously re-engineered on a phosphorylation/ubiquitination-incompetent EGFR backbone. Since NCE controls the degradation of the EGFR, our findings have implications for how the cell responds to increasing levels of EGFR signalling, by varying the balance of receptor signalling and degradation/attenuation.
Keywords: EGFR, endocytosis, ubiquitination
Introduction
The conversion of graded stimuli into switch-like, threshold-controlled, biological outputs presents the cell with different challenges according to whether the signal has to be resolved in space or in time. The former case is exemplified by the specification of boundaries during patterning in development. In this instance, the process is frequently instructed by morphogens that diffuse from a localized source to create a gradient in an area of unpatterned cells. Within this area, the graded morphogenetic signal is transduced into sharp response borders: a process that requires the activation of threshold-controlled mechanisms, and that has been analysed in various developmental contexts (see for instance, Ashe and Briscoe, 2006; Lander, 2007; Barkai and Shilo, 2009).
A different biological setting is represented by those occurrences in which the gradient is not extended in space, but in which cells must enact strategies to respond to varying concentrations of a stimulus, such as a growth factor. In this context, one obvious possibility is that cellular responses are directly proportional to the stimulus, that is, graded input elicits graded output. Another, not mutually exclusive, possibility is that some signalling events are threshold controlled. In the case of the epidermal growth factor (EGF), we have recently uncovered a phenotype that might be underpinned by such a mechanism. The EGF receptor (EGFR) is internalized through both clathrin-mediated endocytosis (CME) and non-clathrin endocytosis (NCE). However, while CME is active at all ligand concentrations, NCE is observed only when high EGF concentrations are applied to cells (Lund et al, 1990; Yamazaki et al, 2002; Sigismund et al, 2005; Orth et al, 2006; Sigismund et al, 2008), suggesting that it might be threshold controlled.
The functional meaning and relevance of EGFR-NCE is still somehow obscure. For instance, its presence depends on the cellular context ((Sigismund et al, 2005; Kazazic et al, 2006; Orth et al, 2006; Madshus and Stang, 2009; Rappoport and Simon, 2009), see also Results in this paper). In the cellular populations in which EGFR-NCE is active, however, it might impinge heavily on the regulation of EGFR signalling, since we have shown that while CME is primarily coupled with EGFR recycling to the cell surface (and therefore with sustainment of signalling), NCE is largely devoted to commit the receptor to lysosomal degradation (Sigismund et al, 2008). Thus, the sharp activation of NCE above a certain ligand threshold (while CME nevertheless persists) might regulate the net signalling output, in response to increasing EGF concentrations, in a nonlinear fashion.
Intriguingly, a post-translational modification of the EGFR, that is, EGFR ubiquitination, might also be threshold controlled, as we have shown that pronounced EGFR ubiquitination occurs only at high EGF concentrations (Sigismund et al, 2005, 2008). EGFR ubiquitination is executed by the E3 ligase Cbl (Levkowitz et al, 1998, 1999). Cbl is recruited to the activated EGFR by two distinct mechanisms: it can interact directly with the receptor at pY1045 (Levkowitz et al, 1999), or indirectly, through Grb2, at pY1068 or pY1086 (Waterman et al, 2002; Jiang et al, 2003). A possible mechanistic link between EGFR ubiquitination and EGFR-NCE was provided by the observation that an ubiquitination-impaired mutant of the EGFR (Y1045F) (Levkowitz et al, 1999) is internalized exclusively through CME, regardless of the concentration of EGF (Sigismund et al, 2005, 2008). Thus, one could hypothesize a threshold-controlled scenario in which a linear EGF signal is converted, above a certain dose, in a ubiquitination signal, which in turn switches on the NCE mode of EGFR internalization. The present studies were undertaken to test this possibility and to experimentally challenge various mechanistic models through which this might occur.
Results
A threshold effect for EGFR ubiquitination
Upon EGF treatment, the ubiquitination of the EGFR—measured by immunoblot (IB)—increased sharply over a narrow range of EGF concentrations, being minimal at 1 ng/ml and nearly maximal at 10 ng/ml, both in epithelial cells (HeLa) and in fibroblasts (NR6-EGFR cells) (Figure 1A). Conversely, the EGFR phosphotyrosine (pY) content, used as a surrogate for receptor activation, displayed a typical hyperbolic dose–response curve, which translated in a semi-linear behaviour when a log scale was used for EGF doses (Figures 1A and B and Supplementary Figures 1A-C; see also Supplementary Figures 1D–F for a series of specificity controls). More precisely, the dose–response curves for EGFR phosphorylation and ubiquitination displayed different degrees of sigmoidicity, best approximated by Hill functions with Hill coefficients (nH) of 1 and 3, respectively.
Figure 1.
Analysis of EGFR ubiquitination. (A) HeLa or NR6 cells were stimulated with the indicated concentrations of EGF for 2 min (in this and all subsequent figures). IP and IB were performed as indicated (Ub, ubiquitin P4D1 antibody). (B) HeLa cells were stimulated with EGF, followed by IB with the indicated antibodies. (C, D) Lysates of HeLa cells stimulated with EGF, as indicated, were subjected to ELISA, forward approach (Supplementary Figure 2A), using the indicated detecting Ab (Ub, FK2 antibody). Results are shown as % of max (see Materials and methods). (E) Lysates of HeLa cells stimulated with EGF, as indicated, were subjected to ELISA, reverse approach (Supplementary Figure 2B), using the indicated detecting Ab (Ub, FK2 antibody). (F) Comparison of the EGFR ubiquitination and phosphorylation curves of HeLa cells obtained by forward and reverse ELISA. In all panels (and in all subsequent figures), error bars indicate s.d. calculated on at least three independent experiments. P-values were calculated using two-way ANOVA analysis. When comparing curves that showed significant differences (in all figures), we show the relative P-values; when comparing curves that did not show significant differences (in all figures), we display R, the Pearson correlation coefficient.
Source data for this figure is available on the online supplementary information page.

To obtain independent quantitative measurements, we exploited an ELISA-based approach (Supplementary Figures 2A and B). In this assay, performed both as a ‘forward’ or ‘reverse’ ELISA, the dose–response curve of EGFR ubiquitination was clearly different from those of EGFR-pY or of individual phosphosites and displayed an evident threshold effect (Figures 1C–F and Supplementary Figure 2C).
We also performed quantitative mass spectrometry (MS) analysis (that is, SILAC, stable isotope-labelled amino acid in cell culture) of EGFR ubiquitination and tyrosine phosphorylation (Figures 2A and B and Supplementary Figure 3A). The amount of ubiquitin peptides in EGFR-enriched preparation of cells stimulated with different EGF doses was compared to the amount obtained upon stimulation with EGF at the maximal dose (100 ng/ml). Also by this method, a clear threshold effect for total EGFR ubiquitination was visible (Figures 2C and D and Supplementary Figures 3B and C), with quantitative estimates obtained by MS and ELISA almost coincident (Figure 2D, bottom). Importantly, we could unequivocally identify a ubiquitinated EGFR peptide, corresponding to K692-Ub and previously identified as one of the major EGFR-Ub sites (Huang et al, 2006), which also showed a threshold behaviour (Figure 2E, top), while several EGFR-pY sites displayed more gradual increments (Supplementary Figures 3D–F). The mean ratio of different phosphosites is reported in Figure 2E bottom. Additional technical information on the MS experiments is reported in Supplementary Figures 3G–K and in Supplementary Table 1.
Figure 2.

SILAC-MS for quantitative analysis of ubiquitinated and phosphorylated EGFR. (A) Schematic representation of the SILAC-MS approach. HeLa cells were grown in SILAC-encoded ‘light’ or ‘heavy’ media (Supplementary Experimental Procedures). ‘Light’ (L) cells were stimulated with 100 ng/ml of EGF; ‘heavy’ (H) cells were treated independently with increasing concentrations of EGF, as indicated. Cells were then harvested and mixed (H/L) in 1:1 ratio for each pair. (B) Lysates from the seven H/L mixtures were subjected to anti-EGFR IP and SDS–PAGE. Lanes were cut (shown by red lines) starting from the position of the EGFR (asterisk), to cover potential differentially ubiquitinated forms. (C) Left, LTQ-FTICR mass spectra of Ub (UBC, peptide 11–27, left) and EGFR (peptide 81–98, right) from each H/L mixture (a more detailed representation is in Supplementary Figures 3B and C). (D) Threshold ubiquitination of EGFR, detected by MS. Top, high-accuracy quantification of total EGFR (87) and Ub (13) peptides; see Supplementary Table 1 for raw data. Bottom, comparison of EGFR-Ub data obtained with forward ELISA (Figure 1C) and SILAC-MS (from top panel). R, Pearson correlation coefficient. (E) Top, SILAC ratios of the EGFR ubiquitination site (K692-Ub) shown in Supplementary Figure 3G. Bottom, mean SILAC ratios of EGFR phosphorylation were calculated on the basis of the three pY sites shown in Supplementary Figures 3D–F. Note that, while mean pY increases linearly upon EGF stimulation (R2=0.97, square of correlation coefficient; see also Supplementary Figures 3D–F for the linear behaviour of single pY sites), the abundance of the EGFR-Ub peptide increases with a threshold behaviour, similarly to total Ub (panel D). SILAC ratios are calculated using MaxQuant (see Supplementary Figures 3H–K for more detailed pictures).
We concluded that EGFR ubiquitination is threshold controlled.
The threshold effect for EGFR ubiquitination occurs at the PM
One of the goals of this study is to establish a mechanistic connection between EGFR ubiquitination and EGFR-NCE (see below). It was critical, therefore, to establish that the threshold effect was already operative at the PM, where internalization occurs. For this reason, we performed all experiments after 2 min of EGF treatment, when EGFR internalization is minimal. However, since it is known that EGFR ubiquitination begins at the PM and continues in endosomes (Umebayashi et al, 2008), it was also necessary to determine exactly where the observed EGFR ubiquitination threshold occurred, under our experimental conditions.
To address this question, we inhibited both CME and NCE internalization of the EGFR, by silencing the expression of dynamin 2 in HeLa cells (Figures 3A and B), and then analysed ligand-induced EGFR ubiquitination. The threshold effect for EGFR ubiquitination, evidenced both by IB (Figure 3A) and—quantitatively—by ELISA (Figure 3C), persisted in dynamin 2-knockdown (KD) cells, thus proving that it occurs at the PM. In addition, the magnitude of both EGFR ubiquitination and tyrosine phosphorylation was comparable in KD and wild-type (WT) cells (Figure 3A), arguing that—under our conditions of analysis—the vast majority of these events takes place at the PM. We note that our results do not imply that endosomal ubiquitination of EGFR is not threshold controlled, but simply that the threshold effect occurs already at the PM.
Figure 3.
The threshold effect for EGFR ubiquitination occurs at the PM. (A) Top, HeLa cells were subjected to dynamin 2-KD and treated for 2 min with EGF at the indicated concentrations. IP and IB were as shown. (B) EGFR internalization kinetics in dynamin 2-KD cells was measured using 125I-EGF at low (1 ng/ml) or high (30 ng/ml) EGF concentrations. Results are expressed as the internalization rate constant (Ke, left panel) or as % of Ke in control cells (right panel), and are the mean of triplicate points (s.e.m.<8%). Dynamin 2-KD (Dyn 2-KD) severely impaired EGFR internalization both at low and high EGF concentrations, reducing rates to background levels. Similar background levels have previously been observed by us in clathrin-KD+filipin-treated HeLa cells, in which both CME and NCE are inhibited (Sigismund et al, 2005, 2008). These results confirm that both CME and NCE of the EGFR are dynamin 2 dependent. Comparable results were obtained with two different silencing oligos for dynamin 2 (data not shown). (C) Lysates of HeLa cells, control and dynamin 2-KD, stimulated with EGF for 2 min at the indicated concentrations were subjected to ELISA, forward approach (Supplementary Figure 2A), using anti-Ub (FK2) and anti-pY as detecting antibodies. Results are shown as a percentage of the maximal tyrosine phosphorylation or ubiquitination (% of max, see Materials and methods). Graph error bars indicate s.d. calculated on at least three independent experiments. All P-values were calculated using two-way ANOVA analysis. As shown the Ub curves were not significantly different between control and KD; the same was true for the pY curves. Conversely, the Ub curves were significantly different from the pY curves.
Source data for this figure is available on the online supplementary information page.

A threshold effect for Cbl recruitment to the EGFR
EGFR ubiquitination is executed by the E3 ligase Cbl (Levkowitz et al, 1998, 1999). We investigated how the activity of Cbl is controlled in the cell to produce the EGFR ubiquitination threshold.
The Cbl family is composed of three genes, c-Cbl, Cbl-b and Cbl-c (Schmidt and Dikic, 2005; Lipkowitz and Weissman, 2011). By quantitative RT–PCR analysis (Q-PCR), we found that our HeLa cells express c-Cbl and, to a lower extent, Cbl-b, but little if any Cbl-c (Figure 4A). The expression level of c-Cbl and Cbl-b was confirmed by IB (Figure 4B). The silencing of c-Cbl caused a sizable reduction in EGFR ubiquitination, while silencing of Cbl-b produced modest effects, even when it was silenced together with c-Cbl (Figure 4C). We concluded that, in the cellular system under scrutiny, c-Cbl is the major E3 ligase responsible for EGFR ubiquitination at the PM. Thus, we concentrated on c-Cbl (henceforth, Cbl) in the subsequent experiments.
Figure 4.
The EGFR–Cbl interaction is threshold controlled. (A) Q-PCR of c-Cbl, Cbl-b and Cbl-c in HeLa cells. Both Ct values (threshold cycles) and mRNA level of c-Cbl, Cbl-b and Cbl-c (normalized on 18S mRNA and expressed as fraction of c-Cbl mRNA) are reported. (B) HeLa cells were subjected to c-Cbl and Cbl-b-KD, alone or in combination (Contr, HeLa cells transfected with control oligo). IB was as shown (Tub, tubulin; loading control). (C) HeLa cells, transfected with the indicated oligos as in B, were stimulated with EGF as shown. Lysates were subjected to IP and IB as shown. For the Ub blots: l.e., long exposure; s.e., short exposure. Note that two different oligos targeting c-Cbl and Cbl-b were used, with comparable results. In panel B and C, results obtained with UTR1 (for both c-Cbl and Cbl-b) are shown (see Materials and methods for details). (D) Top, HeLa cells were treated with EGF as indicated for 2 min and then IP and IB as shown. Bottom, quantitative assessment. Results are expressed as a percentage of the maximal amount (% of max, see Materials and methods) of EGFR that coimmunoprecipitates (Co-IP) with c-Cbl (from now on Cbl), Grb2 or Shc.
Source data for this figure is available on the online supplementary information page.

We analysed the association between Cbl and EGFR in vivo. We detected a clear threshold effect in the EGF-induced co-immunoprecipitation (co-IP) between the two proteins, an effect that was not evident when the physical association of EGFR with other known interactors, such as Grb2 or Shc, was analysed (Figure 4D, see also Supplementary Figure 4 for additional experiments relevant to the interaction between Grb2 and the EGFR). Thus, the association of Cbl with the EGFR exhibits a unique dose–response behaviour that correlates with a similar behaviour of the Cbl-mediated ubiquitination of the EGFR.
Experimental challenge of models of threshold control of EGFR ubiquitination
There are several mechanisms that, in principle, could explain the EGFR ubiquitination threshold. One obvious possibility is that the phosphorylation of individual Cbl-binding sites on EGFR (pY1045 or one between Y1068 and Y1086) increases in a sigmoidal fashion with the doses of EGF (Figure 5A, threshold phosphorylation model). We have, however, tested and excluded this possibility (Figure 1B). Indeed, individual EGFR phosphosites do not display threshold phosphorylation, as shown both for the direct (pY1045, Figure 1B) and for the indirect Cbl-binding phosphosites (pY1068 or pY1086, Figures 1B and D).
Figure 5.
Models describing the generation of EGFR-Ub threshold. (A) Top, schematic representation of EGFR ubiquitination and EGFR phosphorylation, as a function of ligand concentration. xT represents the half-maximal EGF dose for EGFR ubiquitination (i.e., the ubiquitination threshold) and it is used to separate in the pictograms underneath (dashed line) the events occurring at low EGF (left) from those occurring at high EGF (right). In the inset, the various symbols used in the models are shown. Various models potentially accounting for the EGFR ubiquitination threshold (in all models the ubiquitination of EGFR by Cbl is indicated by a solid arrow line). 1) Threshold phosphorylation model. The model contemplates that the phosphorylation of individual Cbl-binding sites on EGFR (pY1045 or one between Y1068 and Y1086) increases in a sigmoidal fashion with the doses of EGF. The model is depicted for pY1045, but it could be equally applied to the indirect (Grb2-mediated) binding site(s) (pY1068/pY1086). 2) Threshold Cbl activation model. The model contemplates that the enzymatic function of Cbl is activated in a nonlinear fashion by signalling events (e.g., direct tyrosine phosphorylation of Cbl by the EGFR, indicated by a dashed arrow line) that occur only under high EGF. 3) Competition model. This model invokes the existence of a high affinity, rate-limiting (low amount) competitor X. At low EGF (left), such competitor—that in the model would bind only to activated EGFR—prevents Cbl from interacting with the EGFR or from ubiquitinating the receptor (in this latter case, either directly inhibiting Cbl activity or masking Ub sites on the EGFR, not shown). At high EGF (right), the competitor becomes limiting and Cbl could therefore bind and ubiquitinate the EGFR. 4) Cooperative model. Cbl/Grb2 complex binds stably to EGFR only when pY1045 and at least one of pY1068 and pY1086 are present in the same EGFR molecule. In this case, the EGFR phosphorylation pattern determines the ubiquitination threshold. At low EGF (left), EGFR is poorly phosphorylated and the probability of having the two key sites in the same EGFR molecule is low (possible low-affinity binding of the Cbl:Grb2 complex to single sites is shown by a dotted line). However, this probability increases at high EGF (right) allowing for the cooperative recruitment of Cbl/Grb2. This model implies that phosphorylation sites are phosphorylated independently of one another (as shown experimentally in Figure 7C and Supplementary Figure 7) and therefore the probability of having one site phosphorylated within the same EGFR molecule increases gradually with the EGF concentration, while the probability of having two sites increases sharply. (B) EGF dose–response curve of Cbl phosphorylation. Left, HeLa cells were treated with EGF for 2 min as indicated. Lysates were prepared in RIPA buffer (w/ 1% SDS) and then diluted to 0.2% SDS (see Materials and methods). IP and IB was as shown. Right, quantitation of the blots.
Source data for this figure is available on the online supplementary information page.

A second group of models is based on either positive or negative regulation of Cbl. In the first case (threshold Cbl activation model, Figure 5A), the enzymatic activity of Cbl could be activated in a nonlinear fashion. It is known that the activation of Cbl depends on its phosphorylation by EGFR (Levkowitz et al, 1999; Kassenbrock and Anderson, 2004), which induces—and possibly stabilizes—an open Cbl conformation, required for the interaction with the E2 enzyme (Dou et al, 2012). However, the EGF-induced Cbl phosphorylation displays a gradual increment over a range of EGF concentrations (Figure 5B), arguing against this hypothesis (see also Supplementary Figure 5 for additional experiments on Cbl phosphorylation).
Inhibition of Cbl function has been extensively investigated in the literature (Schmidt and Dikic, 2005; Ryan et al, 2006). Various permutations of models centred on Cbl-negative regulation can be envisaged. One example is represented in the ‘competition model’ (Figure 5A), where there might be competition between high-affinity and low-affinity proteins for binding to the EGFR. When the number of binding sites (pY sites) is limited (as it would occur at low EGF doses), low-affinity binders (as Cbl hypothetically might be) would be prevented from interacting with the EGFR. If the number of high-affinity ligands is limiting, they would be titrated as the number of binding sites increases, in response to EGF escalation, allowing for the low-affinity ligands to interact with EGFR. A variation of this scenario, which still relies on negative Cbl regulation, is represented by a ‘threshold-controlled relief of inhibition’ model (not shown), which postulates that negative regulation exerted over Cbl by cellular factors can be relieved by signalling events emanating from activated EGFR (e.g., phosphorylations) in a nonlinear fashion.
Finally, a cooperative model can be envisioned (Figure 5A), postulating that Cbl alone cannot account for the ubiquitination of EGFR, but it requires the formation of a complex with Grb2. This would imply that only receptors harbouring simultaneous phosphorylation of Y1045 (i.e., the Cbl2-binding site) and Y1045 and/or Y1068 (i.e., Grb2-binding sites) can effectively bind to Cbl and be thereby ubiquitinated. Such a mechanism might account, at least in part, for the ubiquitination threshold, in that the probability of having both sites phosphorylated on the same EGFR molecule would increase nonlinearly as a function of ligand concentration.
An important insight towards the definition of the correct model derived from Grb2 silencing experiments. Under these conditions, EGFR ubiquitination was significantly reduced (Figure 6A) and—more importantly—there was a switch from threshold to non-threshold behaviour (Figures 6B and C, note that IP in Grb2-KD cells was performed with three times more lysate to have comparable EGFR-Ub signal versus WT cells). These results define an important property of the system in vivo, that is, the ubiquitination threshold is Grb2 dependent. To define the molecular mechanism involved, we set up in vitro EGFR:Cbl association assays and EGFR ubiquitination assays. When GST-Cbl was used to pull down EGFR from cellular lysates, from cells stimulated with increasing concentrations of EGF, the curve exhibited a linear (non-threshold) shape (Figure 6D). However, by adding purified Grb2 (ten-fold molar excess versus Cbl) to the reaction, the threshold effect was promptly restored, with an overall behaviour similar to that observed for the in vivo interaction (Figure 6D). Next, we set up an in vitro Cbl-dependent EGFR ubiquitination reaction, in which purified phosphorylated EGFR was used as a substrate. This assay showed a strong requirement for the presence of Grb2 for efficient catalysis, while Cbl alone was not very efficient, despite the presence of efficient phosphorylation of its direct binding site, Y1045 (Figure 6E). Together the in vitro data establish a causal link between threshold-controlled (Grb2-mediated) Cbl association with EGFR and its catalytic ability towards the EGFR (Figures 7 and 8). In addition, the sum of the above results is more readily compatible with the cooperativity model than with models based on negative regulation.
Figure 6.
Grb2 is required to generate the EGFR-Ub threshold in vivo and in vitro. (A) HeLa cells were subjected to Grb2-KD or transfection with control oligos. Lysates were stimulated with EGF for 2 min as indicated and subjected to IP/IB as indicated. (B) Top, HeLa cells, either control or Grb2-KD, were stimulated with EGF for 2 min at the indicated concentrations. Lysates were subjected to IP and IB as shown. Note that the Grb2-KD displays approximately three-fold reduced total ubiquitination with respect to control cells (panel A); thus, we used three-fold more lysate (3 × , 1 mg for Grb2-KD, 300 μg for control) to obtain comparable IB signals. Bottom, quantitative assessment. Results are expressed as a percentage of the maximal amount (% of max, see Materials and methods) of EGFR ubiquitination. (C) Lysates of HeLa cells, control and Grb2-KD, stimulated with EGF for 2 min at the indicated concentrations were subjected to ELISA, reverse approach (see Supplementary Figure 2B), using anti-Ub (FK2) as capturing antibody. Results are shown as a percentage of the maximal ubiquitination (% of max, see Materials and methods). (D) Left, lysates of HeLa cells stimulated with EGF for 2 min at the indicated concentrations were subjected to pull-down assay with 10 μg of GST-Cbl as bait, in absence (left panels) or in presence of 10 × molar excess bacterially purified Grb2 (right panels). IB was as shown. Right, quantitation of the blots. (E) In vitro ubiquitination assay. GST-EGFR cytoplasmic tail (250 ng) was subjected to in vitro autophosphorylation reaction and then bound to beads followed by incubation with ubiquitin (1 μg), purified E1 (100 ng), UbcH5c as E2 (500 ng), Cbl as E3 (500 ng), in absence or presence of purified Grb2. IB was as indicated. Results are representative of at least three experiments. Control reactions without EGFR or without E2 are also shown. All P-values were calculated using two-way ANOVA analysis. Graph error bars indicate s.d. calculated on at least three independent experiments.
Source data for this figure is available on the online supplementary information page.

Figure 7.
Phosphorylation, ubiquitination and association with Cbl of EGFR add-back mutants. (A) Top, HeLa cells were stimulated with EGF for 2 min at the indicated concentrations. Lysates were prepared in 1% SDS-containing lysis buffer (see Materials and methods) and subjected to IP and/or IB as shown. Eight-tenth of the IP were IB with anti-pY1045; one-tenth each of the IP was IB with anti-pY1068 or anti-EGF. Bottom, quantitation of the blots shown as % of max. Mean and statistical analysis performed on three independent experiments are shown. (B) Top. Scheme of the add-back mutants used in this study. The intracellular domain (kinase domain and C-terminal tail) of the EGFR is shown, with the position of the relevant residues. Critical tyrosine residues involved in Cbl/Grb2 binding are indicated in blue, while the other tyrosine residues in the EGFR tail are depicted in grey. Bottom, NR6 cells stably expressing EGFR-WT or the indicated mutants were analysed by 125I-EGF saturation binding and the number of surface receptors was measured. Data are expressed as surface EGFRs/cell. (C) Quantitation of tyrosine phosphorylation of individual phosphosites in the EGFR add-back mutants (in comparison to EGFR-WT), as a function of EGF dose. Results are expressed as absolute values in arbitrary units (a.u., 100=max WT at 100 ng/ml EGF, see Materials and methods). Raw data are in Supplementary Figure 7. (D) Left, cells expressing the indicated mutants were stimulated with EGF (100 ng/ml, 2 min). Lysates were subjected to IP and IB as indicated. Right, quantitation of the blots. Results were normalized for the amount of immunoprecipitated EGFR and are expressed as % of the values obtained in EGFR-WT cells. Mean and statistical analysis performed on three independent experiments are shown. (E) Left, NR6 cells stably expressing EGFR-WT or the indicated mutants cells were stimulated with EGF (100 ng/ml, 2 min). Lysates were subjected to IP and IB as indicated. Right, quantitation of the Ub blot. Results were normalized for the amount of immunoprecipitated EGFR and are expressed as % of the values obtained in EGFR-WT cells. Mean and statistical analysis performed on three independent experiments are shown.
Source data for this figure is available on the online supplementary information page.

Figure 8.
Dose–response behaviour of Cbl-binding and receptor ubiquitination of EGFR add-back mutants. (A) Left, NR6 cells stably expressing the Y1045+ mutant, the Y1045/68/86+ mutant or EGFR-WT, were stimulated with EGF for 2 min at the indicated concentrations. Lysates were subjected to IP and IB as shown. Note that for the 1045+ mutant, we used two-fold more lysate (2 × , 2 mg for 1045+, 1 mg for EGFR-WT and Y1045/68/86+) and different washing conditions (see Materials and methods). Right, quantitative assessment. (B) Left, NR6 cells stably expressing the Y1045+ mutant, the Y1045/68/86+ mutant or EGFR-WT, were stimulated with EGF for 2 min at the indicated concentrations. Lysates were subjected to IP and IB as shown. Note that the 1045+ mutant displays approximatley five-fold reduced total ubiquitination with respect to EGFR-WT (Figure 8A); thus, we used five-fold more lysate (5 × , 1 mg for 1045+, 200 μg for EGFR-WT and Y1045/68/86+) to obtain comparable IB signals. Right, quantitative assessment. (C) The same samples were subjected to ELISA, forward approach, using anti-Ub (FK2) as detecting antibodies. Results are shown as a percentage of WT ubiquitination (arbitrary units, 100=max WT, left panel) or percentage of maximal ubiquitination in each dose–response curve (% of max, right panel, see Materials and methods). Graph error bars indicate s.d. calculated on at least three independent experiments. All P-values were calculated using two-way ANOVA analysis. R, the Pearson correlation coefficient.
Source data for this figure is available on the online supplementary information page.

pY1045 and pY1068/1086 are synergistically required for Cbl recruitment and optimal EGFR ubiquitination
We sought for in vivo evidence to support the cooperativity model. This model postulates that efficient recruitment of Cbl to active EGFRs depends on the simultaneous presence of pY1045 and either one of pY1068 or pY1086. In addition, the concomitant presence of pY1045 and pY1068/1086 on the same receptor moiety should increase sharply and non-gradually as a function of ligand. To test this latter possibility, we immunoprecipitated EGFR from cellular lysates with an anti-pY1068 Ab, followed by IB with anti-pY1045 (or with anti-pY1068 as a control). To exclude artifacts due to EGFR dimerization, lysates were obtained in the presence of 1% SDS (to destroy protein–protein interactions) followed by dilution to working concentrations of SDS (0.2%). As shown in Figure 7A, the Y1068 phosphorylation curve displayed a gradual EGF-dependent increase (similarly to what is already shown for all analysed individual phosphosites, see Figure 1B), while the simultaneous phosphorylation of Y1045 and Y1068 on the same EGFR moiety displayed a clear threshold effect.
Next, we turned to molecular genetics and engineered a series of mutants in which the relevant phosphosites (pY1045, pY1068 and pY1086) were altered. Initial experiments with mutants in which these interaction surfaces were abrogated, alone or in combination, yielded results compatible with the cooperativity model (Supplementary Figure 6). A more stringent approach, however, required re-engineering of these surfaces in the absence of other phosphosites that can contract multiple interactions with unpredictable effects. Thus, we engineered add-back mutants (Figure 7B) by first creating a pY-null EGFR backbone (the 9Y- mutant) and then adding back the Tyr relevant for the cooperativity model (alone or in combination, 1045+, 1068/1086+ and 1045/1068/1086+ mutants, Figure 7B). These mutants were expressed, at comparable levels (Figure 7B), in cells devoid of endogenous EGFR. The mutants exhibited EGF-stimulated gradual (non-threshold) tyrosine phosphorylation, as expected (Figure 7C and Supplementary Figure 7). Importantly, they also exhibited intrinsic kinase activity apparently indistinguishable from WT, as judged by their ability to autophosphorylate the re-engineered tyrosine residues (1045 and 1068) as efficiently as EGFR-WT (Figure 7C and Supplementary Figure 7). Incidentally, these results imply that, at least for Y1045 and Y1068, tyrosine phosphorylation events are independent of each other and of the phosphorylation of other sites.
We then tested the in vivo association of the add-back mutants with Cbl and their EGF-induced ubiquitination. Compared to EGFR-WT, Cbl association to the 1045+ mutant was reduced by four- to five-fold, while association with the 1068/86+ mutant was reduced to negligible levels (Figure 7D). Instead, the association of Cbl with the 1045/1068/1086+ mutant was indistinguishable from EGFR-WT (Figure 7D). In addition, there was a clear cooperative effect of the 1045 and of the 1068/86 phosphosites towards association with Cbl (Figure 7D). Similarly, the 1045 and the 1068/1086 phosphosites exerted a clear cooperative effect also on EGFR ubiquitination (Figure 7E). Importantly, the ubiquitination levels of the add-back mutants reflected the levels of their in vivo binding to Cbl (compare Figures 7D and E). Together, these results again support the cooperativity model of interaction of the Cbl:Grb2 complex with the EGFR (see also Supplementary Figure 4 for additional information), and argue that this modality of interaction is indeed responsible for the EGFR ubiquitination threshold.
As a final approach, we analysed whether the ‘sigmoidal’ behaviour of Cbl:EGFR association and of EGFR ubiquitination could be re-engineered on a pY-null EGFR backbone, by progressively adding back the relevant phosphosites. To this end, we compared the EGF dose–response curves of Cbl:EGFR co-IP and of receptor ubiquitination of the 1045+ and 1045/1068/1086+ mutants versus EGFR-WT. The dose–response curves of the 1045/1068/1086+ mutant displayed threshold behaviours similar to that of EGFR-WT (Cbl:EGFR Co-IP, Figure 8A; receptor ubiquitination, Figures 8B and C). Conversely, the 1045+ mutant displayed non-threshold gradual dose–response curves, consistent with the fact that its interaction with Cbl depends on a single site (Figures 8A–C). Thus, the sum of all evidence strongly argues that the threshold effect for EGFR ubiquitination is due to a threshold mechanism in the recruitment of the Cbl:Grb2 complex, which is in turn is dependent on cooperativity between pY1045 and pY1068/1086 of the EGFR.
The ubiquitination threshold is mechanistically linked to the NCE internalization threshold of the EGFR
We have previously shown that the NCE modality of EGFR internalization is operative only at relatively high concentrations of EGF ((Sigismund et al, 2005, 2008), see also various additional characterizations in Supplementary Figure 8), suggesting that it might be controlled by some threshold signals emanating from the receptor. Thus, we sought for evidence that could mechanistically link the EGFR ubiquitination threshold to EGFR-NCE.
The notion of EGFR-NCE, however, has been challenged by reports showing that the internalization of EGFR proceeds through CME at all tested doses (Kazazic et al, 2006; Rappoport and Simon, 2009). It was important, therefore, to first resolve this issue before proceeding with further analyses. We tested for the presence of a NCE pathway of EGFR internalization in a panel of cell lines and found that five of nine lines displayed EGFR-NCE (Table I and Supplementary Figure 9). We concluded that NCE, although cell context dependent, is a common mode of EGFR internalization.
Table 1. Presence of EGFR-NCE in various cell lines.

The presence of an EGFR-NCE pathway in the indicated cell lines was evaluated by comparing the internalization curves of WT versus clathrin-KD cells or dynamin-KD (see Supplementary Figure 9 for estimation of the KD level), or by comparing WT versus filipin-treated cells, and calculating the endocytic rate constants (Ke or Ke obs) as explained in detail in Supplementary Experimental Procedures (section—Definition of EGFR-NCE and experimental determination of CME and NCE of the EGFR—). Cells were also subjected to 125I-EGF saturation binding assays to measure EGFR surface number/cell. Results are the average of triplicate points (s.e.m.<10%) and representative of at least two independent experiments. We would like to draw attention to the comparison between two different HeLa cell isolates, HeLa Milan and HeLa Oslo. Our previous studies (Sigismund et al, 2008; Sigismund et al, 2005) have shown that HeLa cells display EGFR-NCE. Another study, however, showed that the same type of cells only display EGFR-CME (Kazazic et al, 2006). To resolve the discrepancy, we compared the HeLa isolates used in both studies (HeLa Milan (our isolate)) and HeLa Oslo (kindly provided by IH Madshus, University of Oslo, Norway)) under the same experimental conditions. We were able to confirm the findings of both studies, with HeLa Milan, but not HeLa Oslo, displaying EGFR-NCE. In addition, since we observed that HeLa Milan displayed ∼four-fold more surface EGFRs than HeLa Oslo (∼3.0 × 10⁵ EGFRs/cell, versus ∼0.8 × 10⁵ EGFRs/cell, respectively), we investigated whether the differences in EGFR-NCE could be ascribed to the different levels of expression of the receptor. To this end, we attenuated the expression of EGFR in HeLa Milan by EGFR-KD (HeLa Milan EGFR-KD, 0.7 × 10⁵ EGFRs/cell) and tested the presence of EGFR-NCE. Also in this case, as shown in the panel, the cells displayed NCE of the EGFR.
Next, we proceeded to investigate how EGFR ubiquitination and EGFR-NCE are related. As an initial approach, we tested the impact of Cbl silencing on the various modalities of EGFR internalization. In our HeLa cells, pharmacological and/or molecular genetics approaches allow to identify three pathways of internalization, CME, NCE and what we operationally define as ‘background endocytosis’ (BE), which corresponds essentially to the residual fraction of endocytosis upon dynamin 2-KD or upon combined clathrin-KD and filipin treatment (see Supplementary Figures 8A and B and Supplementary Experimental Procedures—Definition of EGFR-NCE and experimental determination of CME and NCE of the EGFR–). It is of note that both CME and NCE were sensitive to treatment with EGFR kinase inhibitors, while BE (assessed by dynamin 2-KD) was essentially unaffected (Supplementary Figure 8C), thus probably representing a constitutive kinase-independent pathway, as also supported by experiments with kinase-dead EGFR mutants (Supplementary Figure 8D).
At low EGF doses (a condition under which NCE is not active), the Cbl KD resulted in a ∼30% decrease of the EGF internalization rate, similar to what already reported by others (Bertelsen et al, 2011; Huang et al, 2007). Under the same conditions, double KDs—Cbl-clathrin or Cbl-dynamin 2—did not result in any worsening of the individual clathrin or dynamin 2 KD phenotypes, respectively (Figure 9A and Supplementary Figure 10 for KD levels). At high doses of EGF (where both CME and NCE are active), the Cbl KD caused a marked (albeit not complete) reduction in the EGF internalization rate (Figure 9A). Importantly, in a clathrin-KD background, the Cbl KD was able to further reduce the EGF internalization rate to levels indistinguishable from those of BE (measured by dynamin 2 KD). In addition, the double Cbl-dynamin 2 KD did not worsen significantly the effect of the dynamin 2 KD alone (Figure 9A). Finally, by knocking down Grb2 expression, we could also show that EGFR-NCE is Grb2 dependent (Supplementary Figure 11). We concluded that—in the model system under scrutiny—NCE is completely Cbl dependent, CME displays a moderate dependency on Cbl, and BE is independent of it.
Figure 9.

EGFR ubiquitination and EGFR-NCE are mechanistically linked. (A) 125I-EGF internalization kinetics in control HeLa cells or upon KD of the indicated proteins at low (1 ng/ml, top) or high EGF dose (30 ng/ml, bottom). Results are expressed as internalization rate constants (Ke or Ke obs, see Supplementary Experimental Procedures) and are the mean of triplicate experiments. (B) Dose–response curves of EGFR-NCE and EGFR ubiquitination (measured by ELISA, forward approach) in HeLa cells. (B) Dose–response curves of 125I-EGF internalization in HeLa cells. Total internalization, CME and NCE are shown, determined as explained in Supplementary data. (C) EGF dose–response curves of EGFR-NCE and EGFR ubiquitination (measured by ELISA, forward approach) in NR6 cells stably expressing EGFR-WT or the indicated add-back mutants. Symbols and error bars are not shown to avoid overcrowding of the figure; actual data are from Figures 8C (for EGFR-Ub) and Figure 9E (for EGFR-NCE). (D) Dose–response curves of 125I-EGF internalization in NR6 cells expressing EGFR-WT or the indicated add-back mutants. Total internalization, CME and NCE are shown, determined as explained in Supplementary Experimental Procedures.
Having established that Cbl is absolutely required for NCE, we proceeded to compare the EGF dose–response curves of EGFR-NCE and EGFR ubiquitination in HeLa cells. As shown in Figure 9B, the two curves were almost superimposable. In addition, the dose–response curve of EGFR-NCE was the only one displaying a threshold-controlled behaviour, since both EGFR-CME and EGFR-total internalization showed completely different behaviours that did not match that of EGFR ubiquitination (Figure 9C).
Since the above result establishes a stringent correlation between EGFR ubiquitination and EGFR-NCE, we exploited the add-back mutants to investigate whether they are also mechanistically linked. We analysed the EGF dose–response curves for EGFR internalization (assessing the CME and NCE component separately) and for EGFR ubiquitination of the WT receptor versus the add-back mutants. In Figure 9D, we show a graphical summary of the results (see also Supplementary Figure 12 for a number of controls pertinent to these experiments). The 1045+ mutant displayed both reduction and lack of a clear threshold effect for NCE, with respect to EGFR-WT. In addition, the profile of the NCE curve of this mutant was practically superimposable with that of its ubiquitination (Figure 9D, actual measurements are in Figure 9E-right for NCE and Figure 8C for Ub, see also Supplementary Figure 12B for additional comparisons of internalization and Ub curves in the 1045+ mutant). Conversely, in the 1045/1068/1086+ mutant, we observed restoration of the NCE threshold effect and of the magnitude of internalization through this pathway, with an EGF dose–response curve superimposable to that of EGFR-WT. Also in this case, the NCE curves were very similar to the EGFR-Ub curves (Figure 9D, actual measurements are in Figure 9E-right for NCE and Figure 8C for Ub). Importantly, the correlation between EGFR ubiquitination and internalization held true only for NCE and not for CME, since the EGF dose–response curve of CME did not display any threshold behaviour, for EGFR-WT and for the 1045/1068/1086+ mutant (Figure 9E-centre). Finally, the presence of the double-threshold effect (for EGFR-NCE and EGFR ubiquitination) in the 1045/1068/1086+ mutant was clearly based on cooperativity between the 1045 and 1068/1086 phosphosites, since the 1068/1086+ mutant displayed negligible ubiquitination (Figure 7E) and NCE (Supplementary Figure 12A).
The sum of the above results shows that a naïve EGFR backbone can be rendered competent for both NCE and ubiquitination, and for their threshold behaviours, by the same combination of re-engineered pY sites. Thus, the ubiquitination threshold is mechanistically linked to the NCE internalization threshold of the EGFR.
Discussion
In this study, we demonstrate that ubiquitination of the EGFR at the PM is threshold controlled. EGFR-NCE is also threshold controlled, and the EGF dose–response curves of the two events correlate stringently. Indeed, we show that EGFR-NCE is mechanistically linked to EGFR ubiquitination. Thus, data strongly argue that ubiquitination acts as a molecular switch, which allows the cell to convert a linear EGF signal (a gradient of ligand concentration) into an on–off switch for the activation of NCE, ultimately regulating EGFR fate.
A mechanism of conversion of a graded signal into a threshold-controlled response for the EGFR
We have uncovered here a novel mode of EGFR-dependent signal transduction, which does not follow a simple linear input->output relationship. We provided a mechanistic explanation for how the ubiquitination threshold is generated as a function of ligand concentration. This is achieved through a pY-based mechanism, relying on EGFR-pY1045 and EGFR-pY1068/1086, which controls the recruitment of the Cbl:Grb2 complex to the EGFR. The phosphorylation of individual Tyr followed a gradual, hyperbolic increase, which translates in an almost linear dose–response curve when a log scale is used (Figures 1B and D and Supplementary Figure 1B). This is consistent with the possibility that each phosphorylation event is independent of the others (as shown in Figure 7C and Supplementary Figure 7), and that therefore the probability of having two given sites (in our case, Y1045 and either one of Y1068 or Y1086) phosphorylated on the same EGFR molecule increases nonlinearly as a function of ligand concentration, and becomes significant only when a critical EGF concentration is reached. Indeed, we obtained direct experimental proof that the concomitant presence of pY1045 and pY1068 on the same receptor moiety increases sharply and non-gradually as a function of ligand (Figure 7A). A scenario can, therefore, be envisioned under which—at high doses of ligand—the simultaneous presence of the two binding sites (pY1045 and pY1068/pY1086) allows for efficient recruitment of the Cbl:Grb2 complex. In addition, a bidented interaction might also be required to properly position Cbl, with respect to the receptor, for efficient catalysis.
We note that while we demonstrated that the simultaneous phosphorylation of pY1045 and pY1068/pY1086 is necessary for the threshold effect, this does not mean that it is also sufficient, as other events might concur to its determination. In particular, we note that the cooperative binding of the Cbl/Grb2 complex to EGFR is also, most likely, required. In this scenario, the Cbl:Grb2 complex would function as an avidity-driven coincidence detector of the double pY-based signal generated nonlinearly on an individual EGFR moiety. In addition, other sources of nonlinearity, such as effects of phosphatases and de-ubiquitinases (Ostman et al, 2006; Avraham and Yarden, 2011; Clague et al, 2012), might contribute to the magnitude and/or to the temporal dimension of the observed phenotypes in vivo. Finally, additional Cbl regulatory loops likely have a role in the control of EGFR ubiquitination. Indeed, Cbl is subjected to multiple regulations within the cell (Ryan et al, 2006), including dimerization (which might in principle act both as positive or negative regulator, (Kozlov et al, 2007; Peschard et al, 2007)), direct competition with its binding partners and/or enzymatic activity (e.g., Sprouty, β-PIX, (Wu et al, 2003; Haglund et al, 2005; Schmidt et al, 2006; Kim et al, 2007)), and signalling-dependent degradation (e.g., mediated by Src and HECT-family ligases, (Yokouchi et al, 2001; Bao et al, 2003; Magnifico et al, 2003)). Thus, our proposed mechanism of ‘cooperative regulation’ should be considered as a minimal explanation or, in other words, as representative of a fundamental layer of regulation on which other layers can add, either at the PM or—as endocytosis proceeds—in other subcellular compartments.
One interesting question is whether other receptor systems are similarly regulated. The Met receptor might be one such candidate, since Cbl can also be recruited to this receptor either through direct interaction with phosphotyrosine, or indirectly through Grb2 (Peschard et al, 2001; Peschard and Park, 2007). Since Met is ubiquitinated by Cbl (Peschard et al, 2001), it will be interesting to analyse whether Met ubiquitination is also a threshold-controlled process.
The ubiquitination threshold controls the activation of the NCE mode of EGFR internalization
We have previously shown that EGFR-NCE is switched on only at relatively high ligand doses (Sigismund et al, 2005, 2008). In this study, we refine these observations by demonstrating that EGFR-NCE is also threshold controlled. The notion of EGFR-NCE has generated a degree of controversy, as two studies have failed to detect a NCE pathway for the EGFR (Kazazic et al, 2006; Rappoport and Simon, 2009). By analysing a panel of cell lines, we found that the majority of them, but not all, displayed the EGFR-NCE pathway (Table I). This result has two implications: i) it shows that, at least in culture, the pathway is context dependent, thus resolving the discrepancies in the literature, ii) it shows that EGFR-NCE is a frequent occurrence and not limited to a single-cell system. One puzzling discrepancy between our previous studies (Sigismund et al, 2005, 2008) and another published one (Kazazic et al, 2006) is that HeLa cells were used in both studies, with rather different results. We compared the two HeLa isolates in question under the same experimental conditions and confirmed both sets of published results. Our HeLa (HeLa Milan) displayed EGFR-NCE, while the other isolate (HeLa Oslo, (Kazazic et al, 2006)) did not (Table I). Importantly, both HeLa isolates display threshold-controlled EGFR ubiquitination (our unpublished results). Other mechanisms, likely downstream of receptor ubiquitination, are therefore responsible for the observed differences in NCE in the two HeLa isolates. We are currently investigating the molecular determinants of the NCE pathway, to clarify this issue.
Since EGFR ubiquitination and EGFR-NCE are both threshold controlled, an obvious question is whether they are mechanistically linked. We provide several lines of evidence in this direction: i) the ubiquitination threshold effect occurred at the PM, and it is thus compatible with its involvement in the internalization step (Figure 3); ii) both the ubiquitination and the NCE thresholds occurred within identical ranges of EGF concentrations (Figures 9B and D); iii) Cbl was shown to be absolutely required for EGFR-NCE (Figure 9A); iv) the significant reduction in EGFR ubiquitination, achieved in EGFR mutants defective in Cbl recruitment (EGFR-Y1045/68/86F, Supplementary Figure 6F) was associated to abrogation of EGFR-NCE; v) by exploiting an add-back strategy, we could precisely reconstruct, on a ubiquitination-defective/NCE-defective EGFR backbone, the molecular determinants (pY1045 and pY1068/1086) that cause the simultaneous acquisition of both ubiquitination and internalization by NCE (Figures 8 and 9D); vi) in this latter series of experiments, the cooperative behaviour between pY1045 and pY1068/1086 was responsible for the re-creation of threshold behaviour for both EGFR ubiquitination and EGFR-NCE.
The mechanism through which EGFR-Ub is coupled to NCE remains to be established. An ultrasensitive sorting mechanism has previously been proposed for the recruitment of EGFR to NCE, in which saturation of the dominant CME pathway accounted for the sorting of EGFR into the alternative NCE pathway at high ligand concentrations (Schmidt-Glenewinkel et al, 2008). In this ‘sorting’ model, different endocytic routes ‘consume’ the same form of the receptor. Our present results, while not excluding that some form of saturation of the clathrin pathway might concur, are more readily compatible with a model in which EGFR ubiquitination is a ‘functional’ signal that diverts activated tyrosine phosphorylated EGFR from the CME to the NCE pathway. This is also consistent with our previous findings that Ub receptors, such as Eps15/Eps15R and Epsin1, are indispensable for NCE, while being dispensable for CME in the EGFR system (Sigismund et al, 2005).
Multiple levels of involvement of Cbl in EGFR internalization
Our present results reinforce the idea that EGFR ubiquitination is indispensable for NCE; however, the situation is less clear for CME. We and others favour the notion that EGFR ubiquitination is dispensable for CME (Jiang and Sorkin, 2003; Sigismund et al, 2005; Huang et al, 2007; Sigismund et al, 2008); however, the issue remains controversial (Madshus and Stang, 2009), and it has been proposed that ubiquitin might have a non-essential and redundant role in CME (Goh et al, 2011). In this study, we provide evidence that a triple mutant (Y1045/1068/1086F) that cannot bind to Cbl or Grb2, and displays severely reduced ubiquitination (maximum possible is <3% of WT, Supplementary Figure 6), showed only a modest reduction in CME, while being completely defective in NCE (Supplementary Figure 6), further arguing for the dispensability of EGFR ubiquitination for EGFR-CME.
Interestingly, the data generated with the 1045+ mutant point to a role of Cbl in CME that is independent of its ability to ubiquitinate the EGFR, as also previously proposed (Jiang and Sorkin, 2003; Huang et al, 2007; Sorkin and Goh, 2009). Indeed, the re-introduction of the single Y1045 phosphosite in an otherwise pY-null EGFR backbone was capable of partially restoring both CME and NCE (Figure 9E and Supplementary Figure 12A). However, it is unlikely that the restoration of Cbl binding in the Y1045+ mutant caused the partial rescue of CME through EGFR ubiquitination, since the EGF dose–response of CME of this mutant was rather different from that of its ubiquitination, while the dose–response of its NCE was congruent with it (Supplementary Figure 12B). We note, instead, that our results are in agreement with the extant body of knowledge that indicates that Cbl is directly involved in CME through its role as an adaptor or as an E3 ligase for proteins other than the EGFR (Dikic and Schmidt, 2007; Sorkin and Goh, 2009). Indeed, we know of ∼150 proteins that bind to, or are regulated by, Cbl (for a review, see (Schmidt and Dikic, 2005)), many of which are involved in CME of RTKs. It must be acknowledged that pY1045 might bind to proteins other than Cbl, although no evidence in this direction is present in the literature.
The sum of our results, therefore, argues that cells have evolved distinct mechanisms of internalization, by diversifying the functions of the same (at least in part) molecular machinery. Cbl exemplifies this concept by possibly functioning in CME as an adaptor or E3 ligase for proteins other than EGFR, and in NCE as an EGFR-E3 ligase responsible for threshold-activated ubiquitination of the receptor.
Biological implications
In our previous work, we have shown that NCE-internalized EGFRs are destined to degradation, while the majority of CME endocytic events lead to recycling to the PM (Sigismund et al, 2008). We proposed that this mechanism might have evolved to protect the cell from overstimulation, since a sizable EGFR fraction would be directed to NCE-mediated degradation, in the presence of high EGF (Sigismund et al, 2008). The identification of threshold control in the activation of EGFR-NCE allows us now to propose a homoeostatic mechanism, which controls the number of EGFRs on the PM, that can help us to understand how the interplay between endocytic routes determines biological outcome.
Several reactions are needed to induce the phosphorylation of EGFR: ligand binding, conformational changes of the EGFR, EGFR dimerization, kinase activation. The dimerization step is obviously highly dependent on the levels of EGFR at the PM. We propose that when EGF exceeds a critical concentration threshold ubiquitination is triggered, which leads to a sharp activation of the major degradative route, NCE. This causes a decrease in the surface levels of EGFR. Under these conditions, fewer EGFR dimers can form; EGFR phosphorylation would decrease and all the threshold effects herein described (phosphorylation, Cbl recruitment, ubiquitination) would cease, determining a sharp decrease of NCE. This would direct an increasing proportion of EGFRs to CME, thereby salvaging them from degradation, through recycling, a process that in the long term would ensure the recovery of EGFR at the PM. The final balance would be the preservation of enough receptor on the PM (and in signalling-competent endocytic compartments) to guarantee the persistence of signalling necessary for biological output. Under this scenario, the Cbl-centred threshold signal conversion herein described permits proper signal maintenance, with tolerance for a wide range of ligand concentrations. We are presently testing ad hoc mathematical models to verify this hypothesis.
Materials and methods
Reagents and antibodies
EGF was from PeproTech; rhodamine-EGF from Molecular Probes; 125I-EGF and 125I-Tf were from PerkinElmer; AG1478 was from Calbiochem. Antibodies were: a polyclonal anti-EGFR (made in house, directed against aa 1172–1186 of human EGFR), two monoclonal anti-EGFR antibodies directed against the extracellular domain of human EGFR (m108 hybridoma, American Type Culture Collection (ATCC), (Aboud-Pirak et al, 1988) and Ab-1, Calbiochem), anti-EGFR phospho-specific antibodies (Cell Signaling), anti-pY (4G10, Upstate), anti-Ub P4D1 (Santa Cruz, used in all anti-Ub IBs, unless otherwise specified), anti-Ub FK2 (BIOMOL, used in all ELISAs, see Supplementary Experimental Procedures, and in some control experiments, as indicated in the figures), anti-Ub ZTA10 (made in house, monoclonal; used in some control experiments, as indicated in the figures), anti-tubulin (Santa Cruz), anti-vinculin (Sigma), anti-dynamin (Santa Cruz), anti-Grb2 (Santa Cruz and BD), anti-c-Cbl (Santa Cruz and BD), anti-Cbl-b (BD), anti-Shc (BD), anti-GST (in-house polyclonal).
Cell lines and constructs
HeLa, NR6 and CHO cells were cultured as previously described (Haglund et al, 2003; Sigismund et al, 2005). NR6 are fibroblasts devoid of endogenous EGFR (Pruss and Herschman, 1977). HeLa Oslo cells were kindly provided by IH Madshus (University of Oslo, Norway). All other cell lines were obtained from ATCC. The EGFR mutants were generated by site-directed mutagenesis of the human EGFR cDNA and expressed in the pBABE-puro retroviral vector; their stable expression in NR6 was obtained by infection followed by puromycin selection. GST-Cbl was engineered starting from a Cbl cDNA kindly provided by Y Yarden (Weizmann Institute, Israel). All clones were sequence-verified; details are available upon request.
RNA interference experiments
Silencing of the clathrin heavy chain, dynamin 2, c-Cbl/Cbl-b or Grb2 in HeLa cells was by transient transfection of siRNA oligos (from Dharmacon or Invitrogen) using Lipofectamine RNAiMAX (Invitrogen), following the manufacturer’s instructions. Cells were subjected to double transfection, ‘reverse’ (cells in suspension) on day 1 and ‘forward’ (adherent cells) on day 2. Cells were then processed and analysed 48–72 h after second transfection.
Two different RNAi oligos were used to target the clathrin heavy chain in HeLa cells:
Oligo 1: 5′-CCTGCGGTCTGGAGTCAAC-3′, from Dharmacon (Hinrichsen et al, 2003);
Oligo 2: 5′-GAAGAACTCTTTGCCCGGAAATTTA-3′, from Invitrogen (Sigismund et al, 2008).
In all of the reported assays, the two targeting oligos yielded comparable results. Results obtained with Oligo 1 are shown. For each oligo, a mismatched control was designed by introducing at least four mutations in the sequence, and was used in all experiments. The sequences of the mismatched control oligos are:
Oligo 1 control: 5′-TCGAATACGAACACCTAT-3′
Oligo 2 control: 5′-GAATCATTCCGTGCCAAGTAGATTA-3′
To silence the clathrin heavy chain in NR6 cells, Oligo 2 was used, since the human and mouse sequences are identical in that region (purchased form Invitrogen).
Two different RNAi oligos were used to target dynamin 2 (Dharmacon, (Huang et al, 2004)):
Oligo 2: 5′-GACATGATCCTGCAGTTCA-3′;
Oligo 3: 5′-GAGCGAATCGTCACCACTT-3′.
In all assays, the two targeting oligos yielded comparable results. Results obtained with Oligo 3 only are shown in Figure 3 of the main text. A mismatched sequence of Oligo 3 was used as control.
Oligo 3 control: 5′-GACGGATACGTACCCCATT-3′.
To silence c-Cbl and Cbl-b, two different oligos for each family member were used, targeting the 3′ untranslated region.
c-Cbl UTR1: 5′-AUGAGAAGCUGCCUGGUCUAUUACU-3′
c-Cbl UTR2: 5′-CCGAUUUGAGAUAGAGGCCUUUAAA-3′
Cbl-b UTR1: 5′-GAGAGAAGUGUCUCCUCCUCGUGUA-3′
Cbl-b UTR2: 5′-UAAACAAGGUAAAGCAUUUCACAGG-3′
The two targeting oligos yielded comparable results. Results obtained with UTR1 (for both c-Cbl and Cbl-b) are shown in Figures 4B and C of the main text. In this set of experiments, non-targeting oligo control was purchased from Qiagen (#1027281).
The oligo to silence Grb2 was purchased from Dharmacon.
Grb2: 5′-CAUGUUUCCCCGCAAUUAU-3′
Grb2 control: 5′-CAUUGUCUCCGCCAUAUAU-3′
Q-PCR analysis
c-Cbl, Cbl-b and Cbl-c mRNA levels were determined through the TaqMAN assays Hs00231981_m1, Hs00180288_m1 and Hs00201650_m1, respectively.
Biochemical assays
Cell lysis was performed in denaturing conditions in RIPA buffer (50 mM Tris–HCl, 150 mM NaCl, 1 mM EDTA, 1% Triton X-100, 1% Sodium deoxycholate, 0.1% SDS). For co-IP experiments, lysis was in non-denaturing conditions in JS buffer (50 mM HEPES pH 7.5, 50 mM NaCl, 1% glycerol, 1% Triton X-100, 1.5 mM MgCl, 25 mM EGTA). To exclude the presence of co-immunoprecipitating proteins, for the ELISAs and for the IP in Figure 7A, lysis was performed in RIPA buffer containing 1% SDS, followed by clarification for 1 h at 120 000 g and dilution to a final SDS concentration of 0.2%. This same lysis condition was also used to repeat some of the critical IP experiments to analyse EGFR-Ub and pY curves, with results indistinguishable from those obtained by lysing cells in RIPA buffer (Supplementary Figure 1D). All buffers were supplemented with a protease inhibitor cocktail (Calbiochem) and phosphatase inhibitors (20 mM Na-pyrophosphate pH 7.5, 50 mM NaF, 10 mM Na3VO4 pH 7.5). IP and co-IP assay were performed using 500 μg or 1 mg of lysate, respectively. IB was performed as described previously (Polo et al, 2002; Penengo et al, 2006).
Co-IP assays between Cbl and EGFR mutants in NR6 cells (Figure 8A) were performed starting from 1 mg (for EGFR WT and Y1045/68/86+) or 2 mg of lysate (for the 1045+ mutant), for each condition. Washes were then performed in JS buffer (for EGFR WT and the 1045/68/86+ mutant) or in JS buffer containing a five-fold reduced amount of Triton X-100 (0.2%) for the 1045+ mutant.
For the GST pull-down assays of Figure 6D, 10 μg of GST-Cbl were incubated in the presence or absence of a ten-fold molar excess of bacterially produced purified Grb2 for 30 min at 4°C in JS buffer, and then challenged with 500 μg of lysate from EGF-stimulated HeLa cells. Beads were washed thrice with JS buffer plus 0.05% SDS plus proteases and phosphatases inhibitors.
Signal quantification and normalization
Quantification of IBs was performed using the Photoshop Extended Measurement function of Photoshop and measuring the mean grey value. In all experiments, densitometry was performed on different exposures of the blots and results were obtained in the linear phase of the exposure. Signals were corrected for the amounts of loaded proteins (typically by correcting for the amount of immunoprecipitated proteins, determined in parallel gels, always shown in the various Figures).
In general, results were expressed as ‘% of max’, which means that they were normalized to the maximal numerical value obtained in the curve (typically at 100 ng/ml of EGF). When multiple curves are shown in the same graph and are expressed as ‘% of max’, therefore, each curve is normalized to its own maximal level. In some case, however, it was more appropriate to express values such as to allow a direct quantitative comparison, as for instance when the effects of different mutant EGFRs were compared. In these cases, results are expressed as ‘arbitrary units’ (a.u.) on a scale 0–100 in which 100 represents the maximal numeric value obtained with EGFR-WT (typically at 100 ng/ml of EGF).
Results obtained in ELISAs are similarly expressed either as ‘% of max’ or as ‘a.u.’ (100=max EGFR-WT).
Results of all IB or ELISAs are average (±s.d.) of at least three independent experiments.
ELISAs for EGFR ubiquitination and phosphorylation
For the ELISA-based, we used the DELFIA (Dissociation Enhanced Lanthanide Fluoroimmunoassay) technology from PerkinElmer. It is based on sandwich recognition of a target protein by a capture antibody and a detection antibody. The capture antibody is immobilized on a solid surface (microwells) directly through non-covalent bonds. After the addition of the analyte (appropriate cellular lysate), the detection of signals relies on a lanthanide (Europium)-conjugated antibody that is able to produce a fluorescent signal upon enhancement with acidic enhancement buffer. Lanthanide ions are released in solution at low pH and they rapidly form new, highly stable fluorescent chelates. The fluorescence of the lanthanide chelate is amplified 1–10 million times by this enhancement step and it develops a signal in 5 min that is stable for up to 8 h (additional details of the experimental protocol are in the legend to Supplementary Figures 2A and B). Plate preparation, analyte incubation and antibody detection were according to the manufacturer’s instruction. Briefly, microwells plates were coated with the capturing antibody (see below). Blocking was performed for 2 h with BSA 2% in PBS. 25–50 μg of lysates from HeLa or NR6 cells, stimulated with the indicated concentration of EGF, were incubated overnight at 4°C. Lysates were prepared in RIPA/1% SDS buffer and diluted to 0.2% SDS before incubation step. After three washes, wells were incubated with primary antibodies, diluted at 1 μg/ml in assay buffer, for 1 h at RT. After three washes, anti-mouse or rabbit Europium-labeled secondary antibodies (1 μg/ml in assay buffer) were added for an additional hour. After three washes and treatment with enhancement solution, fluorescence was measured with EnVision instrument (excitation at 340 nm and emission at 615 nm).
Capturing and detecting antibodies differed depending on whether a forward or reverse approach was performed (see Supplementary Figures 2A and B for a scheme of the two procedures):
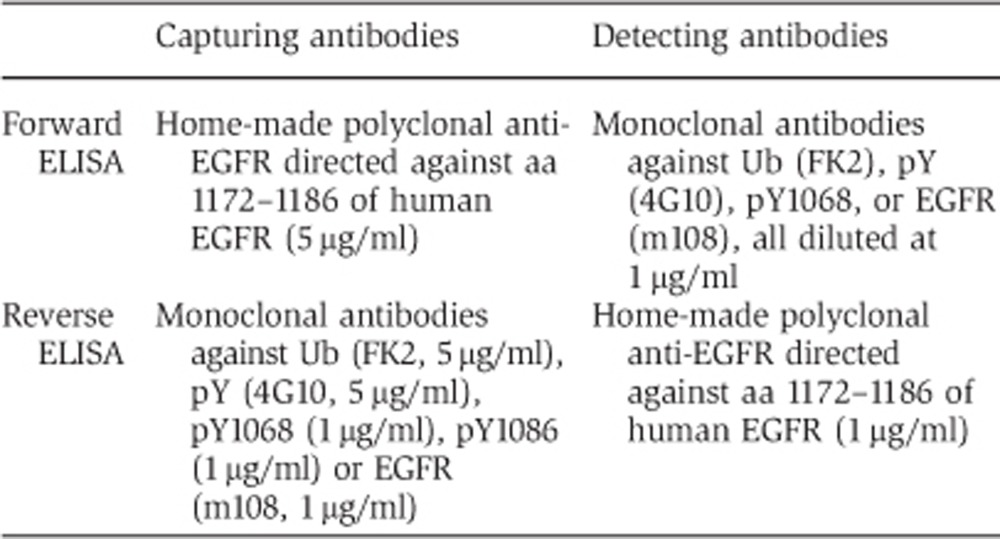
Sample preparation for MS analysis
Immunopurified EGFR samples were acetone precipitated. Protein pellets were suspended in 30 μl Laemmli buffer. Proteins were resolved by SDS–PAGE on a gradient gel (4–12% Tris–HCl Precast Gel, Invitrogen) and stained with Colloidal Coomassie. Enzymatic in-gel digestion was performed essentially as previously described (Shevchenko et al, 2006). Briefly, samples were subjected to reduction in 10 mM DTT for 1 h at 56°C, followed by alkylation with 55 mM iodoacetamide for 45 min at RT, in the dark. Digestion was carried out saturating the gel with 12.5 ng/μl sequencing grade-modified trypsin (Promega) in 50 mM ammonium bicarbonate, o/n. Peptide mixtures were acidified with tri-fluoro acetic acid (TFA, final concentration 3%), extracted from gel slices with two rounds of washes (in 30% acetonitrile (ACN)/ 3% TFA and then in 100% ACN, respectively) and concentrated to 100 μl in a vacuum concentrator (Eppendorf). About 70% of each sample was loaded onto home-made C18-Stage Tips, for concentration and desalting prior LC-MS/MS analysis (Rappsilber et al, 2007). The remaining 30% was subjected to titanium sphere-chromatography (TiO2), for phosphopeptide enrichment and analysis (Supplementary Experimental Procedures).
For comparative MS analysis, we employed SILAC (stable isotope labelling with amino acids in cell culture), as detailed in Supplementary data.
EGFR in vitro ubiquitination assay
A baculovirus-produced GST-EGFR cytoplasmic tail (aa 696–end, Millipore, 250 ng) was subjected to in vitro autophosphorylation for 1.5 h at 30°C in kinase buffer (2 mM ATP, 10 mM MnCl2, 0.8 M (NH4)2SO4). Phosphorylated GST-EGFR tail was then bound to Glutathione Sepharose 4B (GE Healthcare), washed thrice in YY buffer (50 mM HEPES, pH 7.5, 10% glycerol, 150 mM NaCl, 1% Triton, 1 mM EDTA, 1 mM EGTA plus protease/phosphatase inhibitors) and subjected to an in vitro ubiquitination reaction for 1 h at 30°C in Ub buffer (250 mM Tris-HCl pH 7.6, 50 mM MgCl2, 1 M NaCl, 1 mM DTT, 2 mM ATP, plus ATP regeneration system, Sigma), with the following amount of purified enzymes: 100 ng of E1 (purified from baculovirus), 500 ng of E2 (His-tagged UbcH5c/Ube2D3, purified from bacteria), 500 ng of Cbl as E3 (purified from bacteria), 1 μg of Ub (Sigma), with or without Grb2 (purified from bacteria). Beads were then washed four times in YY buffer and eluted in Laemmli buffer. Enzymes were purified as described (Maspero et al, 2011).
Internalization assays
Internalization of 125I-EGF was performed as described (Haglund et al, 2003; Tosoni et al, 2005). In filipin experiments, cells were pre-incubated for 30 min with 0.5–1 μg/ml of filipin (Sigma), before performing internalization assays in the presence of high concentrations of 125I-EGF; internalization at low concentrations of 125I-EGF and 125I-Tf was also measured in the presence of filipin (data not shown), to exclude non-specific effects (see also Sigismund et al, 2008). Note that, both at high and low EGF concentrations, ∼20–25% of the internalization events were insensitive to the combined clathrin-KD and filipin treatment, both in HeLa and NR6 cells (see for instance, Table I and Supplementary Figures 8A and B). We refer to this component operationally as ‘background endocytosis’ (BE). In Figures 9B–E and in Supplementary Figure 12B, this background (that was experimentally measured in each experiment) was subtracted, to obtain parameters unequivocally ascribable to CME and NCE. Additional details and analyses of the various EGF internalization pathways are in Supplementary data (section—Definition of EGFR-NCE and experimental determination of CME and NCE of the EGFR –) and in the legend to Supplementary Figure 8.
Measurement of surface EGFRs
Surface EGFRs (Table I, Figure 7B and Supplementary Figure 6B) were measured by 125I-EGF saturation binding assay. Serum-starved HeLa or NR6 cells were incubated on ice for 6 h in the presence of EGF (100 ng/ml, spiked with 125I-EGF, typically in a 1:20 hot/cold ratio) in serum-medium supplemented with 0.1% BSA and 20 mM HEPES pH 7.4. Cells were then washed three times with ice-cold PBS and solubilized in 1 M NaOH. After correction for the hot/cold dilution, the number of EGFRs/cell was deduced from the total recovered counts, corrected for the specific activity of the radioligand and divided for the number of cells in the plate. Non-specific binding was measured in the presence of a 200-fold excess of cold ligands and subtracted from the total counts. Non-specific binding was never >3–10% of the total counts.
Statistical analysis
All statistical analyses were performed using GraphPad Prism 4.0c for Mac. Two-way ANOVA with Bonferroni post-tests was used to analyse the variance in the different treatment conditions (i.e., EGF concentration) and experimental conditions (i.e., Ub and/or pY modification; EGFR mutants), and the relative statistical significance of their differences. Pearson correlation metric was used to measure similarity among different experimental conditions.
Supplementary Material
Acknowledgments
This work was supported by grants from the Associazione Italiana per la Ricerca sul Cancro and the European Community (FP7) to TB, SP and PPDF; from the Italian Ministries of Education-University-Research (MIUR) and of Health, the Monzino Foundation and the European Research Council to PPDF, from the Giovanni Armenise-Harvard Foundation Career Development Program to TB, the Association of International Cancer Research to TB, the CARIPLO Foundation to SP, A Ciliberto, TB and PPDF.
Author contributions: SS performed internalization and biochemical studies of HeLa cells and NR6 cells reconstituted with add-back mutants. VA performed the biochemical purifications for MS analysis and some internalization experiments. GN performed the internalization assays in the different cell lines. A Conte performed ELISA-base assays and Grb2-KD experiments. RP performed c-Cbl/Cbl-b KD and the in the in vitro ubiquitination assay. A Cuomo and TB performed the mass spectrometry analysis. LGGCV set up the ELISA. EA performed the dynamin-KD experiments. EM provided support to set up the in vitro ubiquitination assay. FB performed the statistical analysis on mass spectrometry data. FC and A Ciliberto participated in the experimental design. SP participated in experimental design and data analysis. PPDF designed the experiments, analysed the data and wrote the paper.
Footnotes
The authors declare that they have no conflict of interest.
References
- Aboud-Pirak E, Hurwitz E, Pirak ME, Bellot F, Schlessinger J, Sela M (1988) Efficacy of antibodies to epidermal growth factor receptor against KB carcinoma in vitro and in nude mice. J Natl Cancer Inst 80: 1605–1611 [DOI] [PubMed] [Google Scholar]
- Ashe HL, Briscoe J (2006) The interpretation of morphogen gradients. Development 133: 385–394 [DOI] [PubMed] [Google Scholar]
- Avraham R, Yarden Y (2011) Feedback regulation of EGFR signalling: decision making by early and delayed loops. Nat Rev Mol Cell Biol 12: 104–117 [DOI] [PubMed] [Google Scholar]
- Bao J, Gur G, Yarden Y (2003) Src promotes destruction of c-Cbl: implications for oncogenic synergy between Src and growth factor receptors. Proc Natl Acad Sci USA 100: 2438–2443 [DOI] [PMC free article] [PubMed] [Google Scholar]
- Barkai N, Shilo BZ (2009) Robust generation and decoding of morphogen gradients. Cold Spring Harb Perspect Biol 1: a001990. [DOI] [PMC free article] [PubMed] [Google Scholar]
- Bertelsen V, Sak MM, Breen K, Rodland MS, Johannessen LE, Traub LM, Stang E, Madshus IH (2011) A chimeric pre-ubiquitinated EGF receptor is constitutively endocytosed in a clathrin-dependent, but kinase-independent manner. Traffic 12: 507–520 [DOI] [PubMed] [Google Scholar]
- Clague MJ, Liu H, Urbe S (2012) Governance of endocytic trafficking and signaling by reversible ubiquitylation. Dev Cell 23: 457–467 [DOI] [PubMed] [Google Scholar]
- Dikic I, Schmidt MH (2007) Malfunctions within the Cbl interactome uncouple receptor tyrosine kinases from destructive transport. Eur J Cell Biol 86: 505–512 [DOI] [PubMed] [Google Scholar]
- Dou H, Buetow L, Hock A, Sibbet GJ, Vousden KH, Huang DT (2012) Structural basis for autoinhibition and phosphorylation-dependent activation of c-Cbl. Nat Struct Mol Biol 19: 184–192 [DOI] [PMC free article] [PubMed] [Google Scholar]
- Goh LK, Huang F, Kim W, Gygi S, Sorkin A (2011) Multiple mechanisms collectively regulate clathrin-mediated endocytosis of the epidermal growth factor receptor. J Cell Biol 189: 871–883 [DOI] [PMC free article] [PubMed] [Google Scholar]
- Haglund K, Schmidt MH, Wong ES, Guy GR, Dikic I (2005) Sprouty2 acts at the Cbl/CIN85 interface to inhibit epidermal growth factor receptor downregulation. EMBO Rep 6: 635–641 [DOI] [PMC free article] [PubMed] [Google Scholar]
- Haglund K, Sigismund S, Polo S, Szymkiewicz I, Di Fiore PP, Dikic I (2003) Multiple monoubiquitination of RTKs is sufficient for their endocytosis and degradation. Nat Cell Biol 5: 461–466 [DOI] [PubMed] [Google Scholar]
- Hinrichsen L, Harborth J, Andrees L, Weber K, Ungewickell EJ (2003) Effect of clathrin heavy chain- and alpha-adaptin-specific small inhibitory RNAs on endocytic accessory proteins and receptor trafficking in HeLa cells. J Biol Chem 278: 45160–45170 [DOI] [PubMed] [Google Scholar]
- Huang F, Goh LK, Sorkin A (2007) EGF receptor ubiquitination is not necessary for its internalization. Proc Natl Acad Sci USA 104: 16904–16909 [DOI] [PMC free article] [PubMed] [Google Scholar]
- Huang F, Khvorova A, Marshall W, Sorkin A (2004) Analysis of clathrin-mediated endocytosis of epidermal growth factor receptor by RNA interference. J Biol Chem 279: 16657–16661 [DOI] [PubMed] [Google Scholar]
- Huang F, Kirkpatrick D, Jiang X, Gygi S, Sorkin A (2006) Differential regulation of EGF receptor internalization and degradation by multiubiquitination within the kinase domain. Mol Cell 21: 737–748 [DOI] [PubMed] [Google Scholar]
- Jiang X, Huang F, Marusyk A, Sorkin A (2003) Grb2 regulates internalization of EGF receptors through clathrin-coated pits. Mol Biol Cell 14: 858–870 [DOI] [PMC free article] [PubMed] [Google Scholar]
- Jiang X, Sorkin A (2003) Epidermal growth factor receptor internalization through clathrin-coated pits requires Cbl RING finger and proline-rich domains but not receptor polyubiquitylation. Traffic 4: 529–543 [DOI] [PubMed] [Google Scholar]
- Kassenbrock CK, Anderson SM (2004) Regulation of ubiquitin protein ligase activity in c-Cbl by phosphorylation-induced conformational change and constitutive activation by tyrosine to glutamate point mutations. J Biol Chem 279: 28017–28027 [DOI] [PubMed] [Google Scholar]
- Kazazic M, Roepstorff K, Johannessen LE, Pedersen NM, van Deurs B, Stang E, Madshus IH (2006) EGF-induced activation of the EGF receptor does not trigger mobilization of caveolae. Traffic 7: 1518–1527 [DOI] [PubMed] [Google Scholar]
- Kim HJ, Taylor LJ, Bar-Sagi D (2007) Spatial regulation of EGFR signaling by Sprouty2. Curr Biol 17: 455–461 [DOI] [PubMed] [Google Scholar]
- Kozlov G, Peschard P, Zimmerman B, Lin T, Moldoveanu T, Mansur-Azzam N, Gehring K, Park M (2007) Structural basis for UBA-mediated dimerization of c-Cbl ubiquitin ligase. J Biol Chem 282: 27547–27555 [DOI] [PubMed] [Google Scholar]
- Lander AD (2007) Morpheus unbound: reimagining the morphogen gradient. Cell 128: 245–256 [DOI] [PubMed] [Google Scholar]
- Levkowitz G, Waterman H, Ettenberg SA, Katz M, Tsygankov AY, Alroy I, Lavi S, Iwai K, Reiss Y, Ciechanover A, Lipkowitz S, Yarden Y (1999) Ubiquitin ligase activity and tyrosine phosphorylation underlie suppression of growth factor signaling by c-Cbl/Sli-1. Mol Cell 4: 1029–1040 [DOI] [PubMed] [Google Scholar]
- Levkowitz G, Waterman H, Zamir E, Kam Z, Oved S, Langdon WY, Beguinot L, Geiger B, Yarden Y (1998) c-Cbl/Sli-1 regulates endocytic sorting and ubiquitination of the epidermal growth factor receptor. Genes Dev 12: 3663–3674 [DOI] [PMC free article] [PubMed] [Google Scholar]
- Lipkowitz S, Weissman AM (2011) RINGs of good and evil: RING finger ubiquitin ligases at the crossroads of tumour suppression and oncogenesis. Nat Rev Cancer 11: 629–643 [DOI] [PMC free article] [PubMed] [Google Scholar]
- Lund KA, Opresko LK, Starbuck C, Walsh BJ, Wiley HS (1990) Quantitative analysis of the endocytic system involved in hormone-induced receptor internalization. J Biol Chem 265: 15713–15723 [PubMed] [Google Scholar]
- Madshus IH, Stang E (2009) Internalization and intracellular sorting of the EGF receptor: a model for understanding the mechanisms of receptor trafficking. J Cell Sci 122: Pt 193433–3439 [DOI] [PubMed] [Google Scholar]
- Magnifico A, Ettenberg S, Yang C, Mariano J, Tiwari S, Fang S, Lipkowitz S, Weissman AM (2003) WW domain HECT E3s target Cbl RING finger E3s for proteasomal degradation. J Biol Chem 278: 43169–43177 [DOI] [PubMed] [Google Scholar]
- Maspero E, Mari S, Valentini E, Musacchio A, Fish A, Pasqualato S, Polo S (2011) Structure of the HECT:ubiquitin complex and its role in ubiquitin chain elongation. EMBO Rep 12: 342–349 [DOI] [PMC free article] [PubMed] [Google Scholar]
- Orth JD, Krueger EW, Weller SG, McNiven MA (2006) A novel endocytic mechanism of epidermal growth factor receptor sequestration and internalization. Cancer Res 66: 3603–3610 [DOI] [PubMed] [Google Scholar]
- Ostman A, Hellberg C, Bohmer FD (2006) Protein-tyrosine phosphatases and cancer. Nat Rev Cancer 6: 307–320 [DOI] [PubMed] [Google Scholar]
- Penengo L, Mapelli M, Murachelli AG, Confalonieri S, Magri L, Musacchio A, Di Fiore PP, Polo S, Schneider TR (2006) Crystal structure of the ubiquitin binding domains of rabex-5 reveals two modes of interaction with ubiquitin. Cell 124: 1183–1195 [DOI] [PubMed] [Google Scholar]
- Peschard P, Fournier TM, Lamorte L, Naujokas MA, Band H, Langdon WY, Park M (2001) Mutation of the c-Cbl TKB domain binding site on the Met receptor tyrosine kinase converts it into a transforming protein. Mol Cell 8: 995–1004 [DOI] [PubMed] [Google Scholar]
- Peschard P, Kozlov G, Lin T, Mirza IA, Berghuis AM, Lipkowitz S, Park M, Gehring K (2007) Structural basis for ubiquitin-mediated dimerization and activation of the ubiquitin protein ligase Cbl-b. Mol Cell 27: 474–485 [DOI] [PubMed] [Google Scholar]
- Peschard P, Park M (2007) From Tpr-Met to Met, tumorigenesis and tubes. Oncogene 26: 1276–1285 [DOI] [PubMed] [Google Scholar]
- Polo S, Sigismund S, Faretta M, Guidi M, Capua MR, Bossi G, Chen H, De Camilli P, Di Fiore PP (2002) A single motif responsible for ubiquitin recognition and monoubiquitination in endocytic proteins. Nature 416: 451–455 [DOI] [PubMed] [Google Scholar]
- Pruss RM, Herschman HR (1977) Variants of 3T3 cells lacking mitogenic response to epidermal growth factor. Proc Natl Acad Sci USA 74: 3918–3921 [DOI] [PMC free article] [PubMed] [Google Scholar]
- Rappoport JZ, Simon SM (2009) Endocytic trafficking of activated EGFR is AP-2 dependent and occurs through preformed clathrin spots. J Cell Sci 122: Pt 91301–1305 [DOI] [PMC free article] [PubMed] [Google Scholar]
- Rappsilber J, Mann M, Ishihama Y (2007) Protocol for micro-purification, enrichment, pre-fractionation and storage of peptides for proteomics using StageTips. Nat Protoc 2: 1896–1906 [DOI] [PubMed] [Google Scholar]
- Ryan PE, Davies GC, Nau MM, Lipkowitz S (2006) Regulating the regulator: negative regulation of Cbl ubiquitin ligases. Trends Biochem Sci 31: 79–88 [DOI] [PubMed] [Google Scholar]
- Schmidt MH, Dikic I (2005) The Cbl interactome and its functions. Nat Rev Mol Cell Biol 6: 907–918 [DOI] [PubMed] [Google Scholar]
- Schmidt MH, Husnjak K, Szymkiewicz I, Haglund K, Dikic I (2006) Cbl escapes Cdc42-mediated inhibition by downregulation of the adaptor molecule betaPix. Oncogene 25: 3071–3078 [DOI] [PubMed] [Google Scholar]
- Schmidt-Glenewinkel H, Vacheva I, Hoeller D, Dikic I, Eils R (2008) An ultrasensitive sorting mechanism for EGF receptor endocytosis. BMC Syst Biol 2: 32. [DOI] [PMC free article] [PubMed] [Google Scholar]
- Shevchenko A, Tomas H, Havlis J, Olsen JV, Mann M (2006) In-gel digestion for mass spectrometric characterization of proteins and proteomes. Nat Protoc 1: 2856–2860 [DOI] [PubMed] [Google Scholar]
- Sigismund S, Argenzio E, Tosoni D, Cavallaro E, Polo S, Di Fiore PP (2008) Clathrin-mediated internalization is essential for sustained EGFR signaling but dispensable for degradation. Dev Cell 15: 209–219 [DOI] [PubMed] [Google Scholar]
- Sigismund S, Woelk T, Puri C, Maspero E, Tacchetti C, Transidico P, Di Fiore PP, Polo S (2005) Clathrin-independent endocytosis of ubiquitinated cargos. Proc Natl Acad Sci USA 102: 2760–2765 [DOI] [PMC free article] [PubMed] [Google Scholar]
- Sorkin A, Goh LK (2009) Endocytosis and intracellular trafficking of ErbBs. Exp Cell Res 315: 683–696 [DOI] [PubMed] [Google Scholar]
- Tosoni D, Puri C, Confalonieri S, Salcini AE, De Camilli P, Tacchetti C, Di Fiore PP (2005) TTP specifically regulates the internalization of the transferrin receptor. Cell 123: 875–888 [DOI] [PubMed] [Google Scholar]
- Umebayashi K, Stenmark H, Yoshimori T (2008) Ubc4/5 and c-Cbl continue to ubiquitinate EGF receptor after internalization to facilitate polyubiquitination and degradation. Mol Biol Cell 19: 3454–3462 [DOI] [PMC free article] [PubMed] [Google Scholar]
- Waterman H, Katz M, Rubin C, Shtiegman K, Lavi S, Elson A, Jovin T, Yarden Y (2002) A mutant EGF-receptor defective in ubiquitylation and endocytosis unveils a role for Grb2 in negative signaling. EMBO J 21: 303–313 [DOI] [PMC free article] [PubMed] [Google Scholar]
- Wu WJ, Tu S, Cerione RA (2003) Activated Cdc42 sequesters c-Cbl and prevents EGF receptor degradation. Cell 114: 715–725 [DOI] [PubMed] [Google Scholar]
- Yamazaki T, Zaal K, Hailey D, Presley J, Lippincott-Schwartz J, Samelson LE (2002) Role of Grb2 in EGF-stimulated EGFR internalization. J Cell Sci 115: Pt 91791–1802 [DOI] [PubMed] [Google Scholar]
- Yokouchi M, Kondo T, Sanjay A, Houghton A, Yoshimura A, Komiya S, Zhang H, Baron R (2001) Src-catalyzed phosphorylation of c-Cbl leads to the interdependent ubiquitination of both proteins. J Biol Chem 276: 35185–35193 [DOI] [PubMed] [Google Scholar]
Associated Data
This section collects any data citations, data availability statements, or supplementary materials included in this article.