

Nanoparticles have been extensively used as carriers to deliver theranostic agents into tumors through the enhanced permeation and retention (EPR) effect,[1] and to regulate the release of a chemical or biological effector in response to environmental stimuli such as temperature or pH change.[2] In these cases, cell uptake of nanoparticles has been studied to maximize their delivery into the target cells. Cell uptake of nanoparticles has also been extensively investigated in an effort to understand their cytotoxicity and potential societal impacts.[3] Many reports have demonstrated that the uptake of nanoparticles by cells depends on their sizes,[4] shapes,[5] and surface properties,[6] among others.[7] However, it has not received much attention to monitor the fate of nanoparticles in cells or tissues as a funtion of time, which should be of great importance in understanding the delivery efficiency and toxicity of nanoparticles. In a recent in vitro study, it was demonstrated using a statistical method that nanoparticles in cells were distributed unequally when the cells divided.[8] However, the conclusion was drawn from an analysis of a large number of cells rather than by tracking the nanoparticles in individual cells during their division. In addtion, no such study has been reported for cells under in vivo conditions.
Herein we demonstrate two methods for monitoring and quantitatively analyzing the fate of Au nanocages (AuNCs) in U87-MG glioblastoma (brain tumor) cells under both in vitro and in vivo conditions. Figure 1a shows a schematic depicting the objective of this study, that is, to quantitatively measure the distributions of AuNCs in, as well as their clearance from the cells during proliferation of the cells. As a new class of nanoparticles with hollow interiors and porous walls, AuNCs have been extensively explored for biomedical applications including imaging, diagnostics, controlled release, and therapeutics,[9] due to their surface plasmon resonance (SPR) properties.[10] In the present work, we used their two-photon luminescence properties[10] and strong optical absorption[11] to track and quantify the numbers of AuNCs in the target cells or a tumor.
Figure 1.
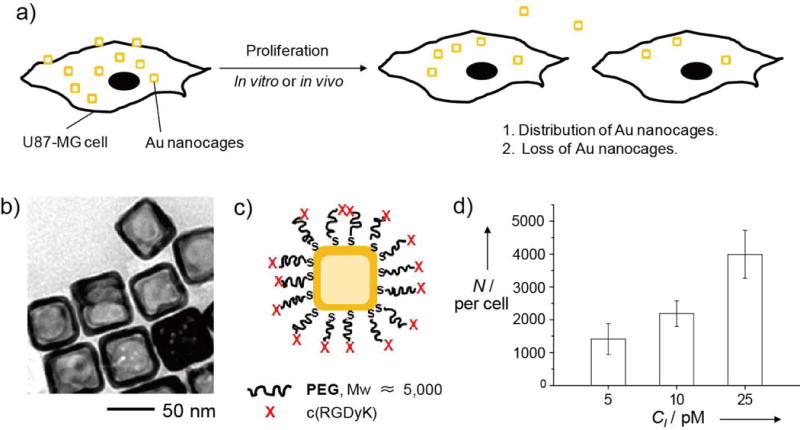
a) A schematic illustration of the major objective of this study: to quantitatively analyze the distributions of AuNCs in U87-MG brain tumor cells during their proliferation in vitro and in vivo. b) A typical TEM image of the AuNCs used for our experiments. c) A schematic of the c(RGDyK)-labeled AuNCs. Abbreviations: PEG, poly(ethylene glycol); X, cyclic RGD that can specifically bind to the integrin receptor on U87-MG cells. d) The number of AuNCs taken up by the U87-MG cells (N) as a function of the concentration of AuNCs (CI) incubated with the cells. The numbers were calculated from UV-vis spectra of the supernatants with reference to a calibration curve.
We used AuNCs with an outer edge length of ca. 50 nm for our study (Fig. 1b). They were prepared according to our previously published protocol.[12] Their surfaces were then functionalized with cyclic Arg-Gly-Asp-D-Tyr-Lys, or c(RGDyK), a peptide capable of specifically targeting the integrin receptors on U87-MG cells (Fig. 1c).[13]
We first quantified the cellular uptake of c(RGDyK)-covered AuNCs by incubating them at various particle concentrations with U87-MG cells at 37 °C for 24 h. The average number of AuNCs taken up by an individual cell was then determined using a UV-vis spectroscopic method (see Fig. S1 in the Supporting Information).[14] As shown in Figure 1d, the number of AuNCs taken up per cell monotonically increased when the particle concentration was increased.
We then used two-photon microscopy (TPM) to examine the fate of the uptaken AuNCs in vitro by calculating the number of AuNCs in each cell from the photoluminescence intensity. In this case, an incubation time of 24 h was used to ensure that each cell would contain ca. 4.0 × 10³ AuNCs. The cells were harvested by trypsin treatment and re-seeded in a culture plate at a density of ca. 20 cells per plate. The seeded cells, referred to as mother cells, were then imaged individually using TPM and the photoluminescence intensity from each cell was recorded and integrated. Since the doubling time for the U87-MG cells is approximately 48 h, we were able to observe the divided cells (i.e., daughter cells) after the same sample had been incubated for 2 days.
Figure 2a shows a typical TPM image of a U87-MG mother cell at the time of seeding and Figure 2b shows a pair of daughter cells derived from this mother cell 2 days post seeding. A total of 14 mother cells and their 28 corresponding daughter cells were monitored and their images are collected in Figure S2. It is clear that all the mother cells divided into two daughter cells within a period of 2 days. Although some pairs of daughter cells showed different degrees of stretching and thus different areas, we assume that they should have equal volumes because this is usually the case when mammalian cells divide. By comparing with the calibration curve shown in Figure 2c, the photoluminescence intensity from each cell was used to determine the number of AuNCs in the cell. Figure 2d compares the average numbers of AuNCs per cell for the 14 mother cells and their corresponding 28 daughter cells after division. It is worth noting that the daughter cells did not equally share the uptaken AuNCs (per volume) during the division of a mother cell (p=0.02). When we added up the numbers of AuNCs in all the daughter cells, the total was reduced by ca. 20 ± 8% relative to what was contained in their mother cells, suggesting that some of the AuNCs were cleared by the cells during the 2-day period of culture. The drop in Au content was further confirmed by analyzing the culture medium with inductively coupled mass spectrometry (ICP-MS). During the 2-day period of culture, ca. 8% of the AuNCs re-entered into the culture medium. The drop in the number of AuNCs per cell could be attributed to the exocytosis and/or desorption of AuNCs bound to the surface of the cells.
Figure 2.
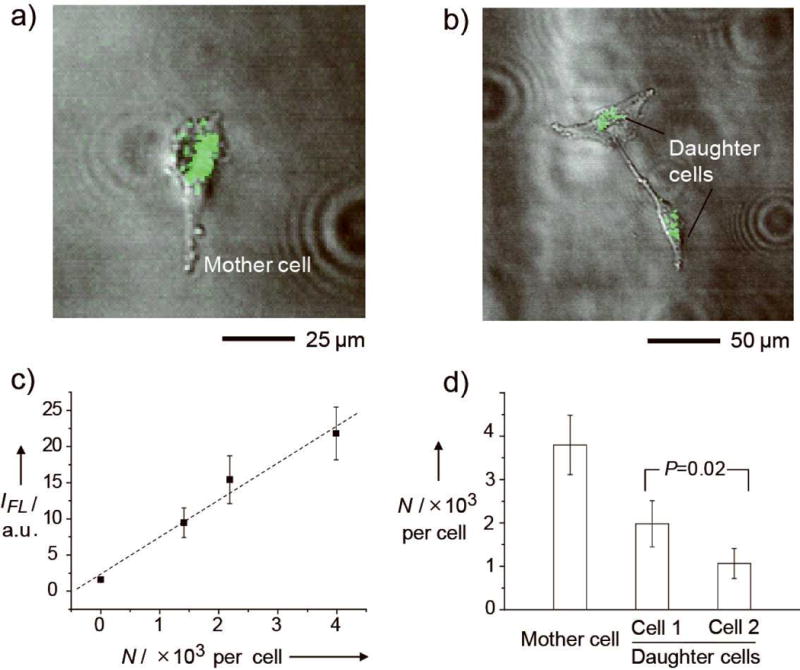
a, b) Superimposed two-photon and phase contrast images showing (a) a U87-MG mother cell and (b) its two daughter cells after 2 days of culture. The photoluminescence from the cyclic RGD-labeled AuNCs is shown in green. c) A calibration curve for the photoluminescence intensity (IFL) as a function of the number of AuNCs per cell (N) taken up by the cells as obtained from the TPM images. The photoluminescence intensity and N had a linear correlation. d) The N in mother cells and their corresponding daughter cells after division. The data was obtained by averaging the intensities of 14 mother cells and their corresponding daughter cells (see Figure S2), respectively, and the intensities were converted to the number of AuNCs according to the calibration curve. The p value was obtained from analysis of variance (ANOVA).
We also monitored the c(RGDyK)-covered AuNCs in vivo using photoacoustic microscopy (PAM).[15] In this case, U87-MG cells bearing ca. 4.0 × 10³ AuNCs per cell were harvested by trypsin treatment and re-suspended in a culture medium at a density of ca. 1 × 10⁷ cells/mL. Next, 20 μL of the cell suspension was injected subcutaneously at the dorsal side of a nude mouse. Immediately after the injection, a PAM image of the cells in the nude mouse was acquired at an excitation wavelength of 770 nm, and the growth of the tumor was monitored by PAM imaging every 2 days until 6 days post injection. Figure 3 shows time-lapse photographs of the tumor (indicated by the arrow) in the mouse (Fig. 3a–d) and the corresponding PAM maximum amplitude projection (MAP) images (Fig. 3e–h, X-Y plane; Fig. 3i–l, X-Z plane; and Movie S1–4, 3D reconstructions; the signals from blood vessels were removed). The photoacoustic amplitude for the tumor area gradually decreased over time. Meanwhile, the thickness of the tumor (in the depth direction from the surface of skin) greatly increased, leading to the growth of tumor volume from ca. 1.26 mm3 to ca. 6.28 mm3 in 6 days. By treating the explanted tumors (in parallel control groups) with a combination of collagenase and trypsin, it was found that the number of tumor cells increased from ca. 2.0 × 10⁵ to ca. 9.4 × 10⁵ in 6 days.
Figure 3.
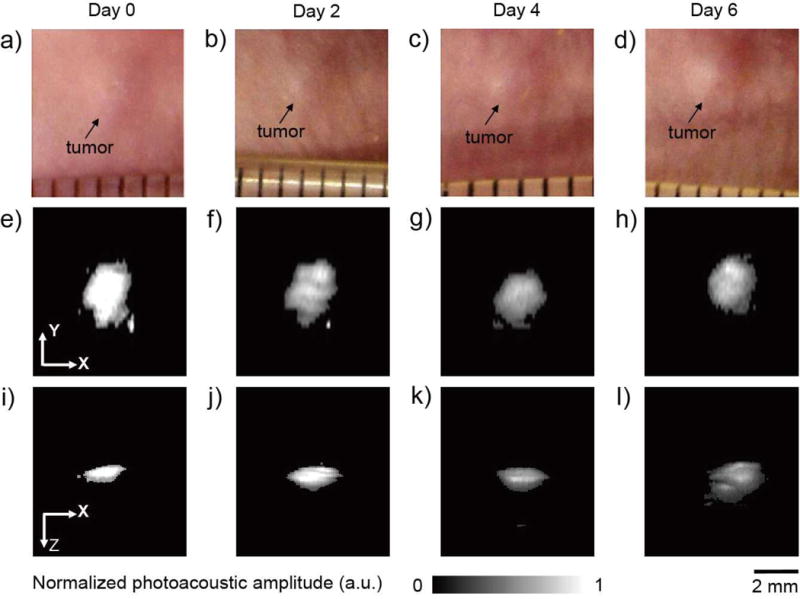
a–d) Time-lapse photographs showing a tumor growing on the dorsal side of a nude mouse after subcutaneous injection of U87-MG cells containing the AuNCs. The tumor was non-invasively monitored using PAM up to 6 days post injection. e–l) Time-lapse in vivo PAM MAP images of the tumor growing in the same nude mouse. The cells initially had ca. 4 × 10³ AuNCs per cell. MAP stands for “maximum amplitude projection”.
Based on the PAM images shown in Figure 3, we estimated the total number of AuNCs (Ntotal) within the tumor at each time point. In this case, we first obtained a calibration curve for in vivo use (Fig. 4a and Fig. S3). The photoacoustic amplitude averaged from the entire region of the proliferating tumor at each time point (Fig. 4b) was then converted to the number of AuNCs per cell based on the calibration curve. Multiplying the number of nanocages per cell by the number of tumor cells at each time point, we were able to estimate Ntotal in the tumor. As shown in Figure 4c, Ntotal decreased by ca. 12 ± 10% in 6 days, implying that the AuNCs were likely cleared from the cells and then carried away from the tumor site through blood flow. However, the decrease in Ntotal was not linearly correlated with time. Instead, Ntotal decreased rapidly in the first 2 days and then stabilized up to day 6.
Figure 4.
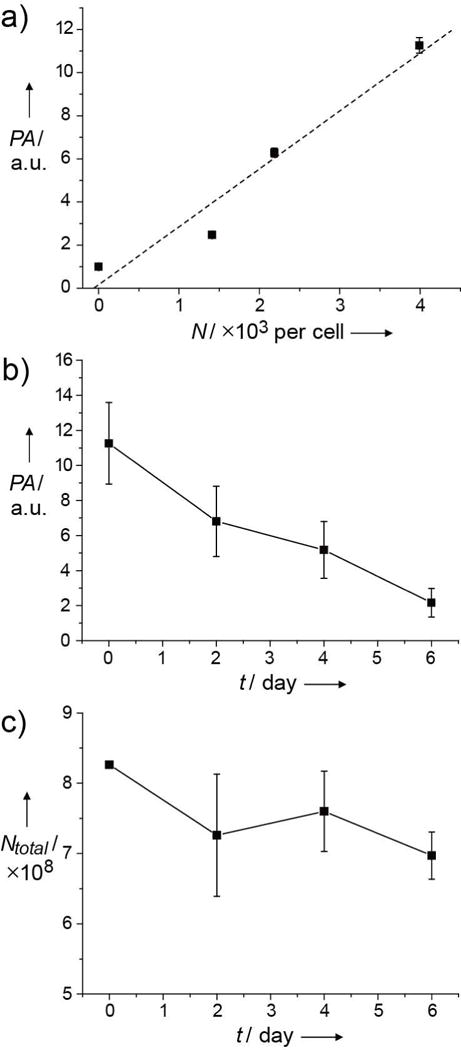
a) Calibration curve for photoacoustic amplitude (PA) as a function of the number of AuNCs in U87-MG cells. Four sets of cells bearing different numbers of nanocages per cell were injected subcutaneously into the dorsal side of a nude mouse, and the photoacoustic amplitudes were obtained in vivo immediately after injection of the cells. The amplitudes were linearly proportional to the number of nanocages in the cells. b) The change in photoacoustic amplitude of the tumor bearing AuNCs growing in a nude mouse over time (t). c) Total number of AuNCs (Ntotal) estimated from PAM data as a function of tumor growth time (t) by multiplying the number of AuNCs per cell (calculated from the calibration curve) and the number of cells at each time point.
The present study provides an important, quantitative understanding of the distribution and clearance of AuNCs in U87-MG tumor cells both in vitro and in vivo. A plot of Ntotal as a function of time indicates that some of the uptaken AuNCs were cleared by the cells over time (Table 1). We determined the percentage of reduction in Ntotal by ICP-MS, TPM, and PAM. In general, the cells or tumor lost ca. 10–20% of the initial AuNCs over a period of 2–6 days both in vitro and in vivo. This data suggests that the clearance of AuNCs from the tumor cells did not vary significantly whether the cells were grown in vitro or in vivo for the period of time tested (4–6 days).
Table 1.
Percentages of AuNCs cleared from the cells.a
| % cleared from cells
|
|||
|---|---|---|---|
| Day 2 | Day 4 | Day 6 | |
| ICP-MS (in vitro)b | 8 | –e | –e |
| TPM (in vitro)c | 20±8 | –e | –e |
| PAM (in vivo)d | 12± 10 | 8±6 | 16±4 |
At day 0, immediately after cell uptake, all the mother cells had roughly the same number of AuNCs, about 4 × 10³ per cell.
The number of mother cells used for the measurement was ca. 3×10⁵.
The number of mother cells used for the measurement was 20.
The number of cells used for the measurement was ca. 2×10⁵.
Not measured, since the in vitro studies were only conducted over a period of two days, during which the number of cells was doubled.
In addition, the standard deviation of the number of AuNCs per cell in the entire cell population over time represented the distribution of the AuNCs in the cells or the tumor during their proliferation. Table 2 shows the percentage standard deviation relative to the number of AuNCs per cell obtained from UV-vis, TPM, and PAM. On day 0, the percentages obtained from the three techniques agreed with each other reasonably well (with variations in the range of 18–20%). The percentages increased over time both in vitro and in vivo. The increasing value of standard deviation implies that the number of AuNCs in the cells or the tumor became increasingly different among the cells during their proliferation. In other words, this result suggests that the cells likely did not share the AuNCs equally when they divided.
Table 2.
Percentages of standard deviation (STD) for the average number of AuNCs per cell in the entire cell population.a
| % of STD
|
||||
|---|---|---|---|---|
| Day 0 | Day 2 | Day 4 | Day 6 | |
| UV-vis (in vitro)b | 18.3 | –e | –e | –e |
| TPM (in vitro)c | 18 | 42 | –e | –e |
| PAM (in vivo)d | 20 | 29 | 31 | 38 |
At day 0, immediately after cell uptake, all the mother cells had roughly the same number of AuNCs, about 4 × 10³ per cell.
The number of mother cells used for the measurement was ca. 3 × 10⁵.
The number of mother cells used for the measurement was 20.
The number of cells used for the measurement was ca.2 × 105.
Not detected.
Not measured, since the in vitro studies were only conducted over a period of two days, during which the number of cells was doubled.
In conclusion, we have quantitatively analyzed the fate of target-specific AuNCs in a brain tumor cell line both in vitro and in vivo. As a novel class of nanoparticles with hollow interiors and porous walls, AuNCs are finding wide use in drug delivery and cancer therapeutics.[9] The tunable scattering and absorption peaks of AuNCs in the near-infrared region also make them excellent contrast agents for a number of optical imaging modalities. All of these applications require a quantitative understanding of their fates once they have been delivered into cells. In the present study, by using TPM and PAM, it was found that the cells did not share the AuNCs equally during their division. We believe that a comparison of the fates of the AuNCs between in vitro and in vivo cases could also provide useful information on the biological activities of tumor cells under different physiological conditions. The present work is important to future studies involving nanoparticles for biomedicine and nanotoxicology, where it is critical to know the delivery efficiency and/or the fate of nanoparticles in the cells during prolonged periods of proliferation.
Supplementary Material
Footnotes
This work was supported in part by a grant from NIH (R01 CA138527) and startup funds from Washington University in St. Louis (to Y. X.), and NIH Grants R01 EB000712, R01 EB008085, R01 CA134539, U54 CA136398, and 5P60 DK02057933 (to L. V. W.). Part of the research was done at the Alafi Neuroimaging Laboratory, the Hope Center for Neurological Disorders (NIH Neuroscience Blueprint Center Core Grant P30 NS057105).
Supporting information for this article, including procedures for the synthesis of AuNCs, surface modification, and cell culture, two photon microscopy, and photoacoustic imaging, is available on the WWW under http://dx.doi.org/.
References
- [1].a) Ghosh P, Han G, De M, Kim CK, Rotello VM. Adv Drug Deliv Rev. 2008;60:1307–1315. doi: 10.1016/j.addr.2008.03.016. [DOI] [PubMed] [Google Scholar]; b) Maeda H, Wu J, Sawa T, Matsumura Y, Hori K. J Control Rel. 2000;65:271–284. doi: 10.1016/s0168-3659(99)00248-5. [DOI] [PubMed] [Google Scholar]
- [2].a) Sawant RM, Hurley JP, Salmaso S, Kale A, Tolcheva E, Levchenko TS, Torchilin VP. Bioconj Chem. 2006;17:943–949. doi: 10.1021/bc060080h. [DOI] [PMC free article] [PubMed] [Google Scholar]; b) Rosler A, Vandermeulen GWM, Klok HA. Adv Drug Deliv Rev. 2001;53:95–108. doi: 10.1016/s0169-409x(01)00222-8. [DOI] [PubMed] [Google Scholar]
- [3].a) Nel A, Xia T, Madler L, Li N. Science. 2006;311:622–627. doi: 10.1126/science.1114397. [DOI] [PubMed] [Google Scholar]; b) Teeguarden JG, Hinderliter PM, Orr G, Thrall BD, Pounds JG. Toxicol Sci. 2007;95:300–312. doi: 10.1093/toxsci/kfl165. [DOI] [PubMed] [Google Scholar]; c) Lison D, Thomassen LCJ, Rabolli V, Gonzalez L, Napierska D, Seo JW, Kirsch-Volders M, Hoet P, Kirschhock CEA, Martens JA. Toxicol Sci. 2008;104:155–162. doi: 10.1093/toxsci/kfn072. [DOI] [PubMed] [Google Scholar]
- [4].a) Jiang W, Kim BYS, Rutka JT, Chan WCW. Nat Nanotechnol. 2008;3:145–150. doi: 10.1038/nnano.2008.30. [DOI] [PubMed] [Google Scholar]; b) Alivisatos AP, Gu W, Larabell C. Annu Rev Biomed Eng. 2005;7:55–76. doi: 10.1146/annurev.bioeng.7.060804.100432. [DOI] [PubMed] [Google Scholar]; c) Rejman J, Oberle V, Zuhorn IS, Hoekstra D. Biochem J. 2004;377:159–169. doi: 10.1042/BJ20031253. [DOI] [PMC free article] [PubMed] [Google Scholar]; d) Panyam J, Labhasetwar V. Adv Drug Deliv Rev. 2003;55:329–347. doi: 10.1016/s0169-409x(02)00228-4. [DOI] [PubMed] [Google Scholar]; e) Prabha S, Zhou WZ, Panyam J, Labhasetwar V. Int J Pharm. 2002;244:105–115. doi: 10.1016/s0378-5173(02)00315-0. [DOI] [PubMed] [Google Scholar]
- [5].a) Cho EC, Au L, Zhang Q, Xia Y. Small. 2010;6:517–522. doi: 10.1002/smll.200901622. [DOI] [PMC free article] [PubMed] [Google Scholar]; b) Chithrani BD, Chan WCW. Nano Lett. 2007;7:1542–1550. doi: 10.1021/nl070363y. [DOI] [PubMed] [Google Scholar]
- [6].a) Verma A, Stellacci F. Small. 2010;6:12–21. doi: 10.1002/smll.200901158. [DOI] [PubMed] [Google Scholar]; b) Verma A, Uzun O, Hu Y, Hu Y, Han HS, Watson N, Chen S, Irvine DJ, Stellacci F. Nat Mater. 2008;7:588–595. doi: 10.1038/nmat2202. [DOI] [PMC free article] [PubMed] [Google Scholar]; c) Leroueil PR, Hong S, Mecke A, Baker JR, Jr, Orr BG, Holl MMB. Acc Chem Res. 2007;40:335–342. doi: 10.1021/ar600012y. [DOI] [PMC free article] [PubMed] [Google Scholar]; d) Cho EC, Xie J, Wurm PA, Xia Y. Nano Lett. 2009;9:1080–1084. doi: 10.1021/nl803487r. [DOI] [PubMed] [Google Scholar]; e) Zorko M, Langel U. Adv Drug Deliv Rev. 2005;57:529–545. doi: 10.1016/j.addr.2004.10.010. [DOI] [PubMed] [Google Scholar]; f) Sudimack J, Lee RJ. Adv Drug Deliv Rev. 2000;41:147–162. doi: 10.1016/s0169-409x(99)00062-9. [DOI] [PubMed] [Google Scholar]
- [7].a) Alexandre A, Chan WCW. ACS Nano. 2011;5:5478–5489. doi: 10.1021/nn2007496. [DOI] [PubMed] [Google Scholar]; b) Lin J, Zhang H, Chen Z, Zheng Y. ACS Nano. 2010;4:5421–5429. doi: 10.1021/nn1010792. [DOI] [PubMed] [Google Scholar]; c) Chakravarthy KV, Bonoiu AC, Davis WG, Ranjan P, Ding H, Hu R, Bowzard JB, Bergey EJ, Katz JM, Knight PR, Sambhara S, Prasad PN. Proc Natl Acad Sci. 2010;107:10172–10177. doi: 10.1073/pnas.0914561107. [DOI] [PMC free article] [PubMed] [Google Scholar]; d) Hutter E, Boridy S, Labrecque S, Lalancette-Hebert M, Kriz J, Winnik FM, Maysinger D. ACS Nano. 2010;4:2595–2606. doi: 10.1021/nn901869f. [DOI] [PubMed] [Google Scholar]
- [8].Summers HD, Rees P, Holton MD, Brown MR, Chappell SC, Smith PJ, Errington RJ. Nat Nanotechnol. 2011;6:170–174. doi: 10.1038/nnano.2010.277. [DOI] [PubMed] [Google Scholar]
- [9].Xia Y, Li W, Cobley CM, Chen J, Xia X, Zhang Q, Yang M, Cho EC, Brown PK. Acc Chem Res. 2011;44:914–924. doi: 10.1021/ar200061q. [DOI] [PMC free article] [PubMed] [Google Scholar]
- [10].Au L, Zhang Q, Cobley CM, Gidding M, Schwartz AG, Chen J, Xia Y. ACS Nano. 2010;4:35–42. doi: 10.1021/nn901392m. [DOI] [PMC free article] [PubMed] [Google Scholar]
- [11].a) Chen J, Wiley B, Li ZY, Campbell D, Saeki F, Cang H, Au L, Lee J, Li X, Xia Y. Adv Mater. 2005;17:2255–2261. [Google Scholar]; b) Cho EC, Kim C, Zou F, Cobley CM, Song KH, Chen J, Li ZY, Wang LV, Xia Y. J Phy Chem C. 2009;113:9023–9028. doi: 10.1021/jp903343p. [DOI] [PMC free article] [PubMed] [Google Scholar]
- [12].Skrabalak SE, Au L, Li X, Xia Y. Nat Protoc. 2007;2:2182–2190. doi: 10.1038/nprot.2007.326. [DOI] [PubMed] [Google Scholar]
- [13].Chen X, Park R, Tohme M, AHS. Bading JR, Conti PS. Bioconjugate Chem. 2004;15:41–49. doi: 10.1021/bc0300403. [DOI] [PubMed] [Google Scholar]
- [14].a) Cho EC, Liu Y, Xia Y. Angew Chem Int Ed. 2010;49:1976–1980. doi: 10.1002/anie.200906584. [DOI] [PMC free article] [PubMed] [Google Scholar]; b) Cho EC, Zhang Q, Xia Y. Nat Nanotechnol. 2011;6:385–391. doi: 10.1038/nnano.2011.58. [DOI] [PMC free article] [PubMed] [Google Scholar]
- [15].a) Zhang HF, Maslov K, Stoica G, Wang LV. Nat Biotechnol. 2006;24:848–851. doi: 10.1038/nbt1220. [DOI] [PubMed] [Google Scholar]; b) Kim C, Cho EC, Chen J, Song KH, Au L, Favazza C, Zhang Q, Cobley CM, Gao F, Xia Y, Wang LV. ACS Nano. 2010;4:4559–4564. doi: 10.1021/nn100736c. [DOI] [PMC free article] [PubMed] [Google Scholar]
Associated Data
This section collects any data citations, data availability statements, or supplementary materials included in this article.