

Abstract
Pleckstrin homology and leucine rich repeat protein phosphatases (PHLPPs) are a novel class of potent protein kinase B (AKT) inhibitors that have been intensely investigated in relation to AKT activity in cancer. Currently, our understanding of the role of PHLPP1α in the central nervous system is limited. In this study, we characterized PHLPP protein expression and target kinases in the adult hippocampus. We directly verify PHLPP1α inhibits AKT in hippocampal neurons and demonstrate a novel role for PHLPP1β/SCOP, to promote AKT activation. PHLPP1α expression changes dramatically in the hippocampus during development, constituting the most abundant PHLPP protein in adult neurons. Further, while all PHLPP proteins could be observed in the cytosolic fraction, only PHLPP1α could be localized to the nucleus. The results provide unique evidence for a divergence in the function of PHLPP1α and PHLPP1β/SCOP, and suggest that PHLPP1α plays a major role in regulating AKT signaling in neurons.
Keywords: AKT, FOXO3a, hippocampus, PHLPP1, PHLPP2, PKC
Protein kinase B (AKT) is a major downstream effector of survival and growth signaling cascades. A large body of evidence, spanning multiple disciplines, implicates dysregulation of AKT in an array of human diseases and includes diseases of the brain (Franke 2008). Indeed, dysregulation of AKT plays an important role in the development and/or progression of Huntington’s(Humbert et al. 2002; Gines et al. 2003; Colin et al. 2005), Parkinson’s (Xiromerisiou et al. 2008; Timmons et al. 2009), Alzheimer’s (Dickey et al. 2008; Lee et al. 2009), schizophrenia (Kalkman 2006; Thiselton et al. 2008), and bipolar depression (Yu et al. 2010), to name a few. Moreover, evidence suggests psychotropic drugs alter the activity of the AKT signaling pathway, which may partially explain the therapeutic benefit of these compounds (Beaulieu et al. 2009). A complete understanding of how endogenous AKT activity is regulated in the brain, and characterizing the biochemical mechanisms involved, will help in the development of novel CNS drugs able to alter AKT activity for the treatment of neurological diseases.
Pleckstrin homology and leucine rich repeat protein phosphatases (PHLPPs) are a recently identified group of proteins which inhibit several kinases including AKT (Gao et al. 2005), protein kinase C alpha (PKCα) (Gao et al. 2008), and MAPK (extracellular regulated kinase; ERK) (Shimizu et al. 2003). Two isoforms of PHLPP, PHLPP1 and PHLPP2, have been identified (Brognard et al. 2007). Further, PHLPP1 exists as two splice variants, PHLPP1α (Gao et al. 2005) and PHLPP1β/SCN circadian oscillatory protein (SCOP) (Shimizu et al. 1999). While the majority of studies have probed PHLPP function in cancer cells, PHLPP proteins in the brain have been comparatively uncharacterized. However, one recent study in PC12 cells found the PHLPP1β/SCOP splice variant inhibits ERK by binding to K-ras, an upstream activator of ERK signaling, and prevents ERK’s phosphorylation (Shimizu et al. 2003). The leucine rich repeat domain in PHLPP1β/SCOP is required for this inhibition, and deletion of the leucine rich repeat domain prevents PHLPP1β/SCOP’s association with K-ras. In addition, subsequent studies found PHLPP1β/SCOP regulates ERK signaling in the mouse hippocampus, and altering hippocampal PHLPP1β/SCOP levels affects learning and memory (Shimizu et al. 2007). Alternatively, studies in cancer cells show PHLPP1α and PHLPP2 inhibit AKT/PKCα by selectively dephosphorylating their Ser473 (pAKT473)/Ser657 (pPKCα657) site, respectively (Gao et al. 2005; Brognard et al. 2007; Hirano et al. 2009). Phosphorylation at pPKCα657 stabilizes PKCα and prevents its degradation (Gysin and Imber 1997). Therefore, dephosphorylation by PHLPP1α or PHLPP2, in addition to decreasing phosphorylated levels, also decreases total levels of PKCα. Although further characterization of PHLPP protein expression and function is needed, these studies indicate that they can inhibit multiple kinases and may provide a unique target for modulating several signaling pathways.
Previously, we found hippocampal regional differences in the level of AKT and PKCα signaling across the lifespan. When compared to the hippocampal Ammon’s horn (area CA3) subregion, the hippocampal Ammon’s horn (area CA1) subregion showed reduced levels of pAKT473 and pPKCα657. Further, regional differences in nuclear AKT inversely correlated with differences in the level of nuclear PHLPP1α but not other well known AKT regulators including phosphatase and tensin homolog or protein phosphatase 2, subunit A (Jackson et al. 2009). These studies suggest PHLPP1α plays an important role in reducing AKT and PKCα signaling in the CA1 hippocampal subregion. However, it has yet to be directly demonstrated in any neuronal model system that PHLPP1α inhibits AKT or PKCα. Therefore, the role of PHLPP1α in mediating the regional differences in AKT activity, remain speculative. In addition, because PHLPP1 knockdown studies to date have all targeted PHLPP1 (i.e. both splice variants are simultaneously knocked down) no study has investigated how PHLPP1β/SCOP selectively contributes to AKT or PKCα regulation.
The goals of this study were to (i) characterize the protein expression profile of all three PHLPP proteins in the hippocampus, and (ii) directly verify PHLPP1 proteins are regulators of AKT signaling in neurons. The work presented here is the first to show in a neuronal system, that inhibition of PHLPP1α increases AKT activity while inhibition of PHLPP1β/SCOP promotes AKT/PKCα activity. Thus, PHLPP1 splice variants are antagonistic regulators of critical signaling pathways. Further, by taking a broad approach and characterizing multiple facets of PHLPP regulation, we conclude PHLPP1α is a major contributor to AKT regulation in the adult rat brain, and specifically in neurons. Together our findings suggest PHLPP1α is a potential therapeutic target for future CNS drugs designed to regulate AKT signaling.
Materials and methods
Animals
All procedures involving animal subjects have been reviewed and approved by the Institutional Animal Care and Use Committee at the University of Florida and were in accordance with guidelines established by the US Public Health Service Policy on Humane Care and Use of Laboratory Animals. (i) For primary hippocampal cell culture experiments pregnant (E17 on arrival) Brown Norway (Charles River Laboratories Inc., Wilmington, MA, USA) rats were used. Animals were housed until E19. Hippocampi from E19 embryos were collected. Tissue including heart, liver, lung, kidney cortex, kidney medulla, cerebellum, frontal cortex, and hippocampus were collected from the 10-week-old mothers, flash frozen, and stored at −80°C until further processing. (ii) For analysis of CA1/CA3/dentate gyrus (DG) differences in PHLPP hippocampal proteins and immunofluorescence of total brain PHLPP1α, 4-month-old NIA Fischer 344-Brown Norway rats were used. (iii) For hippocampal subcellular fractionation studies 10-week-old male Brown Norway rats were used. All rats were kept in specific pathogen free housing and maintained on a 12 h light/dark cycle and fed a standard ad libitum diet. Animals were killed by sedation (xylene/ketamine) and decapitated. Whole hippocampi were removed and either immediately frozen or first separated into CA1, CA3, DG regions and then flash frozen in liquid nitrogen. Samples were stored at −80°C until further processing.
Hippocampal cell culture
Embryonic hippocampal cell culture studies were adapted from methods described by Brewer et al. (Brewer et al. 1993). Briefly, pregnant (E19) Brown Norway rats were anesthetized using xylene/ketamine. Embryos were collected, embryonic brains removed, and hippocampi dissected out in dissection media (Hanks’s Balanced Salt Solution supplemented with penicillin-streptomycin + Sodium Bicarbonate + HEPES). Hippocampi were placed in a 1.5 mL tube containing dissection media and chopped using curved scissors for 2 min. Cells were then transferred to a 15 mL tube, 7 mL of dissection media added to cell suspension, and spun for 5 min/200 g. Cells were resuspended in trypsinization solution and gently swirled in a 37°C water bath for 8 min. 10 mL of quenching media was quickly added and cells were again spun for 5 min/200 g. Cells were resuspended in trituration solution and passed through two fire-polished glass Pasteur pipettes, each of different widths, to further break up cells (10 strokes in total). 6 mL of dissection media was added and cells spun for 5 min/200 g. Cells were resuspended in 2 mL of prepared Neurobasal Media (Neurobasal Media + B27 supplement + L-Glutamine + penicillin/streptomycin), counted on a hemacytometer, and plated on 6-well plates coated with poly-D-lysine at the density ~1×10⁶ cells/well in 2 mL of prepared Neurobasal media. Cells were kept in a 37°C incubator supplemented with 5% CO2/95% O2. Three days after plating 1 mL of media was replaced with fresh prepared Neurobasal media (also containing 6 μM arabinofuranosyl cytidine to prevent glia proliferation). Cells were re-fed every 3 days until days in vitro (DIV) 10. Cells were stained for neuronal, astrocyte, oligodendrocyte, and microglia markers to ascertain culture purity (Figure S1), and found to be between 90% and 95% neurons. On days of experiments cells were washed twice with basal Neurobasal media (unprepared), and allowed to incubate for 2 h in 2 mL of basal Neurobasal media (i.e. 2-h starvation). Subsequently, 1 mL of media was replaced with basal media containing 200 ng/mL insulin-like growth factor 1 (IGF-1; Peprotech, Rocky Hill, NJ, USA) for a final concentration of 100 ng/mL IGF-1. After 20 min of IGF-1 stimulation cells were washed twice in ice cold phosphate-buffered saline (PBS), and collected in 65 μL ristocetin-induced platelet agglutination (RIPA) buffer (containing 1.5× protease inhibitors, 1× EDTA, and 2× phosphatase; Pierce, Rockford, IL, USA). Finally hippocampal neurons were gently sonicated for 20 s, spun at 16 000 g/4°C/10 min, and stored at −80°C until further analysis.
Cellular fractionation studies
Tissues were homogenized using NER nuclear separation kit (Pierce) according to the manufacturer’s instructions. Briefly, samples were placed in a 2 mL glass dounce homogenizer (Kimble-Kontes) containing 600 μL ice cold cytoplasmic extraction reagent 1 (CERI) buffer (cytoplasmic fraction). CERI buffer was prepared by adding 1.5× protease inhibitors, 1× EDTA, and 2× phosphatase inhibitors (Pierce). Samples were then homogenized using 11 strokes with pestle B and 10 strokes with pestle A. Homogenate was transferred to 1.5 mL tubes. After sitting on ice for 10 min, samples were vortexed and spun at 16 000 g/4°C/5 min. Samples were then placed on ice and supernatant collected and saved for cytoplasmic/plasma membrane protein analysis. Samples were then washed once in 200 μL CERI buffer (with inhibitors); briefly vortexed and spun at 16 000 g/4°C/5 min. The supernatant was discarded. Samples were resuspended in 100 μL nuclear extraction reagent 1 buffer (with inhibitors). Samples were vortexed every 10 min for 40 min and spun at 16 000 g/4°C/10 min. The supernatant (containing nucleoplasm enriched protein fraction) was collected and stored for later analysis. Samples were washed again in 200 μL CERI buffer (with inhibitors); briefly vortexed and spun at 16 000 g/4°C/5 min. The supernatant was discarded. Samples were resuspended in 100 μL RIPA buffer (with inhibitors), sonicated for 30 s, and set on ice for 30 min. Samples were spun at 16 000 g/4°C/10 min and nuclear membrane containing fraction collected. Fractions were analyzed for subcellular separation efficiency. Fractions were probe with antibodies against glyceraldehyde 3-phosphate dehydrogenase (Abcam, Cambridge, MA, USA), Neuroligin (Synaptic Systems, Goettingen, Germany), TATA box binding protein (TBP; Abcam) and Lamin B1 (Zymed Laboratories Inc., South San Francisco, CA, USA). The majority of glyceraldehyde 3-phosphate dehydrogenase Neuroligin was detected in the cytoplasmic/plasma membrane fraction, respectively. The nucleoplasmic fraction contains relatively high levels of TBP. TBP is abundant in the nucleoplasm and bound to DNA. As such TBP was also detected in the nuclear membrane fraction (i.e. DNA was spun down during final extraction) as well. However, only the nuclear membrane fraction contains Lamin B1 (a nuclear membrane only protein).
Western blot
Protein concentrations were determined using bovine serum albumin (BSA) method (Pierce). 15 μL Kaleidoscope protein standards (Bio-Rad Laboratories, Hercules, CA, USA) were loaded per gel, and 20 μg/lane of tissue samples were loaded on 7% gradient gels (Bio-Rad). Gels were run 10 min at 90 Vand subsequently 1 h at 120 V. Proteins were then transferred to polyvinylidene difluoride membranes (Amersham Pharmacia Biotech, Piscataway, NJ, USA) overnight at 50 V/4°C. Blots were stained with Ponceau S, washed once in Tris-buffered saline (TBS), and blocked in Tris buffered saline with tween-20 (7% milk) for 1 h. Primary antibodies (pAKT473, Cell Signaling Technology, Beverly, MA, USA; pAKT308, Cell Signaling; AKT total, Cell Signaling; pPKCα, Upstate Biotechnology, Lake Placid, NY, USA; PKCα total, Upstate Biotechnology; Forkhead box O3a transcription factor (FOXO3a) total, Affinity Bioreagents (Golden, CO, USA); pERK1/2, Cell Signaling; ERK1/2 total, Cell Signaling; PHLPP1, Bethyl Laboratories (Montgomery, TX, USA); PHLPP2, Bethyl Laboratories; AMP-kinase, Cell Signaling; FKBP51, Thermo Scientific (Rock-ford, IL, USA); α-Spectrin II, Santa Cruz Biotechnology, Santa Cruz, CA, USA) were applied at vendor recommended concentrations and allowed to incubate overnight at 4°C. Subsequently, blots were washed three times with TBS (5 min each wash), and secondary antibodies applied for 2 h at 25°C in Tris buffered saline with tween-20. Blots were again washed three times in TBS and developed using ECL Plus Western Blot Detection Kit (Amersham) on biomax film (Kodak, Rochester, NY, USA). Blots were scanned using 6500 scanner (Bio-Rad), and densitometry determined using UN-SCAN-IT software (Silk Scientific, Orem, UT, USA).
Whole brain immunofluorescence and immunocytochemistry
A 4-month-old Fisher 344/BN rat was anesthetized and perfused with 4% paraformaldehyde. The brain was removed, placed in paraformaldehyde for 1 h, and transferred to 30% sucrose solution for 72 h. Following fixation the brain was embedded in optimal cutting compound and 8 μm coronal sections were made using a cryostat. Slices were collected on Superfrost Plus glass slides (Fisher Scientific, Pittsburgh, PA, USA), and allowed to air dry for 1 h. Slides were allowed to rest in PBS for 20 min, and thereafter permeabilized in 1% TritonX-100/PBS for 15 min. Slides were washed again in PBS three times. Next slides were treated with 0.1% sodium dodecyl sulfate/PBS for 5 min (mild antigen retrieval). Sections were the washed in PBS a total of six times to remove all sodium dodecyl sulfate. Afterwards slides were blocked using 20% goat serum (in 1% BSA PBS) for 2 h and incubated overnight (at 4°C) in 3% goat serum PBS containing rabbit anti-PHLPP1 (Caymen Chemical, Ann Arbor, MI, USA) and cell specific markers (either mouse-anti neuronal beta tubulin III, Abcam; CNPase, Abcam; CD45, Abcam; or glial fibrillary acidic protein, Cell Signaling). Slides were then washed three times (10 min each wash) with PBS and incubated with secondary (Alexa Fluor goat anti-rabbit 594/goat anti-mouse 488; Invitrogen, Carlsbad, CA, USA) for 1.5 h. Three more washes in PBS were given and slides stained with 0.3% Sudan Black B in 70% ethanol for 10 min to remove lipofuscin autofluorescence. Finally slides were mounted (Prolong Gold Anti-Fade with 4′6-diamidino-2-phenylindole; Invitrogen) and images taken on an Axiovert 40 CFR fluorescent microscope (Zeiss, Thornwood, NY, USA) and images compiled in photoshop. For immunocytochemistry, 10 DIV hippocampal neurons were grown on 8-well slides coated with poly-D-lysine (BD Biosciences, San Jose, CA, USA). Cells were washed twice with PBS and incubated for 15 min in 4% paraformaldehyde in PBS. Cells were then permeabilized in 0.1% TritonX-100/PBS for 15 min, washed three times in PBS (5 min each), and blocked 45 min in 20% goat serum (in 1% BSA PBS). Primary antibodies for PHLPP1 (Caymen Chemical) were applied overnight (at 4°C) in 3% goat serum. Slides were then washed three times (10 min each wash) with PBS and incubated with secondary (Alexa Fluor goat anti-rabbit 594; Invitrogen) for 1.5 h. Slides were mounted (Prolong Gold Anti-Fade with 4′6-diamidino-2-phenylindole; Invitrogen) and images taken on an Axiovert 40 CFR fluorescent microscope (Zeiss).
Lentiviral packaging and PHLPP1α over-expression
The RNAi Consortium lentiviral vector pLKO.1 shRNA set containing five individual shRNA clones targeting PHLPP1 (Open-biosystems, Huntsville, AL, USA, catalog # RMM4534-XM_001475839) and a non-targeting shRNA pLKO.1 control vector (Sigma, St. Louis, MO, USA, catalog # SHC002) were purchased from the indicated providers. Using HEK293-FT cells, each of the PHLPP1 and non-targeting shRNA lentivectors were packaged into concentrated lentiviruses using a three plasmid transfection procedure (Semple-Rowland et al. 2007). Viral titers were estimated using a Lenti-X qRT-PCR kit (Chemicon, Billerica, MA, USA) and typically averaged 2 × 10¹² viral genomes per ml. (i) Primary rat hippocampal neurons were transduced both at the time of seeding and at DIV7 with shRNA lentivirus. In brief, approximately 1 × 10⁶ cells/well were plated on a 6-well plate dish in the presence of virus (approximate MOI of 20). The cells were fed every 3 days and on DIV7, the cells were exposed to equal amounts of virus. Each of the five PHLPP1 targeting shRNAs was evaluated for functionality via western blot analysis of steady-state PHLPP1 levels (as described above/below). To selectively knock-down PHLPP1b, the pLKO.1 clone ID TRCN0000081358 was used and to target both PHLPP1α and PHLPPβ the clones TRCN0000081362 and TRCN0000081359 were employed. (ii) In order to verify the specificity of the employed PHLPP1 antibody, HEK293-FT cells were transiently transfected with either pCMV6-Myc-DDK-PHLPP1 (encoding the PHLPP1α NM_194449.1 open reading frame obtained from Origene, Rockville, MD, USA, cat# RC203930) or pCMV6-green fluorescent protein plasmid. The cells were grown in 10% fetal bovine serum/Dulbecco’s modified Eagle’s medium and harvested 48 h post-transfection in RIPA buffer. Each transfection was performed in triplicate in order to obtain independent samples.
Statistical analysis
Western blots were analyzed using UN-SCAN-IT (Silk Scientific) densitometry software and NCSS Statistical Software (NCSS, Kaysville, UT, USA); data significant at *p < 0.05, **p < 0.001, ***p < 0.0001. Western blot data from shRNA knockdown studies was analyzed using an unpaired t-test. Data from developmental and hippocampal regional differences in PHLPP protein levels was analyzed using an ANOVA. Post-hoc analysis was performed using Fisher LSD test. All graphs were produced using GraphPad Prism software (GraphPad Software Inc., San Diego, CA, USA).
Results
Validation of PHLPP1 and PHLPP2 antibodies
Two independent laboratories have reported that human embryonic kidney (HEK293-T) cells express high levels of PHLPP1β/SCOP and PHLPP2, but relatively low levels of PHLPP1α (Kanan et al. 2010; Brognard et al. 2007). In order to assess the specificity of the PHLPP1 and PHLPP2 antibodies (Bethyl Laboratories) used in this study, and insure that our PHLPP1 antibody does not preferentially detect PHLPP1α or PHLPP1β/SCOP, we took advantage of the fact HEK293-FT cells express low levels of PHLPP1α to either (i) over-express human PHLPP1α splicoform or (ii) knock out the PHLPP1β/SCOP splicoform and determine if the PHLPP1 antibody recognizes each splicoform. As illustrated in Fig. 1(a), we confirmed an absence of PHLPP1α (~140 kDa) staining in HEK293-FT cells relative to PHLPP1β/SCOP (~190 kDa). Lentiviral delivery of a PHLPP1 specific shRNA in HEK293-FT cells resulted in complete loss of PHLPP1β/SCOP (~190 kDa), compared to cells treated with a non-targeting shRNA. PHLPP2 levels were unaffected by PHLPP1 knockdown (Fig. 1a). In the same way, knocking out PHLPP2 (~150 kDa) in HEK293-FT cells did not affect PHLPP1β/SCOP levels (Fig. 1b). Finally, transient over-expression of human recombinant PHLPP1α (~140 kDa) in HEK293-FT cells results in a strong band (Fig. 1c) identical to that seen in subsequent analysis of rat brain tissue. Of note, PHLPP1β/SCOP levels also increased when PHLPP1α was over-expressed. The cDNA used to over-express PHLPP1α is missing the 600 amino acid N-terminal extension within PHLPP1β/SCOP protein. Therefore, the increase in PHLPP1β/SCOP must be from endogenous sources. This result indicates there are, as of yet, unidentified mechanisms for cross-talk regulation of expression between the two splicoforms, and suggests that the PHLPP1 antibody used in our study does not preferentially detect one splicoform over another.
Fig. 1.
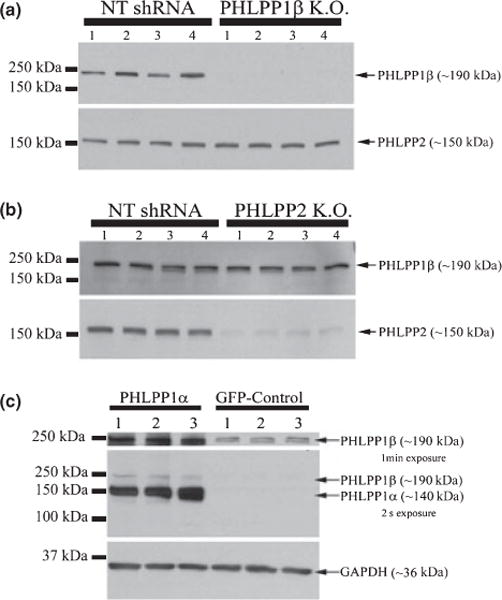
PHLPP1 antibody detects both splice variants. (a) Knockdown of PHLPP1β in HEK293-FT cells using a PHLPP1 targeting shRNA does not affect PHLPP2 levels. Note the absence of PHLPP1α (~ 140 kDa) staining. (b) Knockdown of PHLPP2 (~ 150 kDa) using a PHLPP2 targeting shRNA does not affect PHLPP1β/SCOP levels. (c) Transient over-expression of human PHLPP1α in HEK293-FT cells. PHLPP1 antibody (Bethyl Laboratories) detects a ~ 140 kDa protein corresponding to PHLPP1α and a ~ 190 kDa band corresponding to PHLPP1β/SCOP. Note different exposure times were employed to visualize PHLPP1α and PHLPP1β. In addition, over-expression of PHLPP1α also increased the expression of PHLPP1β.
The brain expresses high levels of PHLPP1α
In our previously published work, only hippocampal PHLPP1α was analyzed (Jackson et al. 2009). Therefore, we were interested to determine the relative protein abundance between different PHLPP isoforms/splicoforms in the rat brain and specifically the hippocampus. To determine the relative abundance of all PHLPP isoforms/splicoforms in the rat brain compared to peripheral organs we analyzed homogenates isolated from the cerebellum, hippocampus, and frontal cortex, and compared it to homogenates from heart, lung, kidney, and liver (Fig. 2a). All PHLPP proteins were highest in brain tissue homogenates. PHLPP1α appears to be the most abundant PHLPP protein in the hippocampus. However, because we were unable to detect PHLPP1α in other organs, for reference, we wanted to compare hippocampal lysates to cells which do express PHLPP proteins in abundance. We confirm that HEK293 cells have very low levels of PHLPP1α and relatively high levels of PHLPP1β/SCOP and PHLPP2. To determine the relative abundance of all PHLPP isoforms/splicoforms in the rat hippocampus, HEK293-FT cell homogenates were compared to hippocampal homogenates (Fig. 2b). We observed high levels of PHLPP1α in both embryonic hippocampal neurons and adult rat hippocampus, but relatively low levels of PHLPP1β/SCOP and PHLPP2, compared to HEK293-FT cells.
Fig. 2.
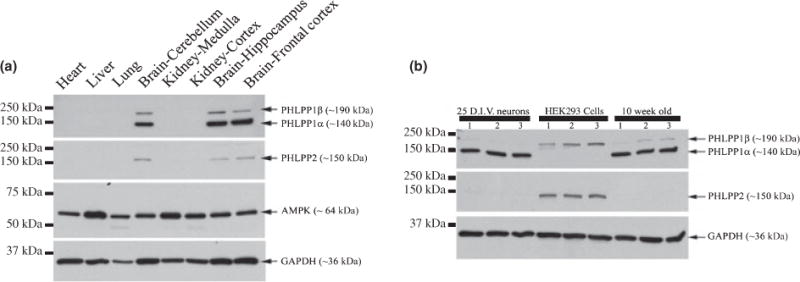
PHLPP proteins are abundant in brain tissue. (a) Western blots showing comparative analysis of PHLPP protein levels in heart, liver, lung, kidney, and brain tissue homogenates. GAPDH and AMP-kinase (AMPK) were used as controls as both proteins are highly expressed in all organs analyzed. (b) Western blots comparing PHLPP protein levels in HEK293-FT cells, in vitro hippocampal neurons, and hippocampi from 10-week-old adult male rats (n = 3/group).
PHLPP1α is abundant in neurons
Figure 2 indicates that PHLPP1α is highly abundant in brain tissue, and specifically the hippocampus. However, the CNS consists of many different cell types. Therefore, we were interested to learn what cell types in the brain express PHLPP1α. We used brain sections to co-localize PHLPP1α to cortical neurons (Fig. 3j–l), astrocytes (Fig. 3g–i), microglia (Fig. 3d–f), and oligodendrocytes (Fig. 3a–c). Images of glial cells were taken from the cortex of the rat brain. For these studies we used a PHLPP1 antibody (Caymen Chemicals) previously validated for use in immunofluorescence procedures. Western blots of hippocampal extracts show the Caymen antibody detects a single dominant band corresponding to 140 kDa PHLPP1α (see supplementary figures from previous work, Jackson et al. 2009). In addition, the antibody detects over-expressed human PHLPP1α in HEK293-FT cells but not in green fluorescent protein-controls cells (Figure S2). Intriguingly, for concentrated regions of PHLPP1α staining (Red Staining), the stain localized almost exclusively to neurons (Fig. 3j–o/White Arrows). Figure S3 shows an enlarged image of the white box in Panel (i), and clearly demonstrates lack of PHLPP1α staining in astrocytes. Moreover, marked PHLPP1α was observed in the CA1 pyramidal cell layer of the hippocampus (Fig. 3m–o); the exposure time was reduced in CA1 images because of signal saturation. The original exposure can be seen in Figure S4d–f and is the same exposure time used in Panels (a), (d), (g), and (j). No staining was observed in secondary only control images (Figure S4a–c). The results indicate neurons have an extremely high level of PHLPP1α compared to other cell types within the brain.
Fig. 3.
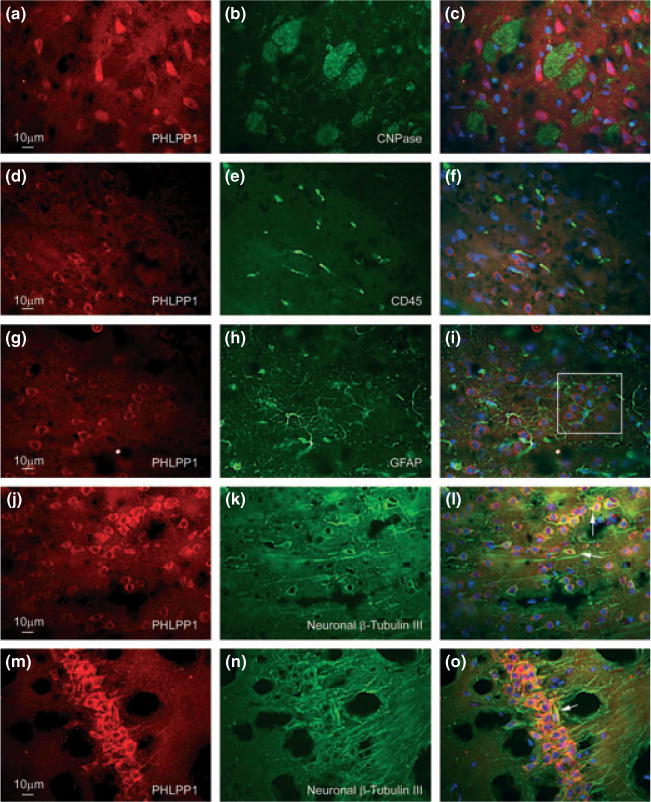
Localization of PHLPP1α to CNS cells. PHLPP1 antibody (Caymen Chemicals) was used to determine distribution and abundance of PHLPP1α (first column Panels a–m) in oligodendrocytes (Panel b), microglia (Panel e), astrocytes (Panel h), cortical neurons (Panel k), and hippocampal CA1 neurons (Panel n). The last column (Panels c–o) overlays the first and second columns and includes DAPI staining of nuclei (BLUE). The exposure time for PHLPP1 (Panels a, d, g, j) was 228 ms. For (Panel m) exposure time was reduced to 150 ms. Figure S2 (Panels d, e, f) shows original 228-ms exposure for CA1 neurons. White square (Panel i) shows astrocyte, unstained for PHLPP1, extending processes around a group of neurons stained for PHLPP1. Image is enhanced in Figure S3. White Arrows (Panels l and o) show intense yellow/orange staining indicating localization of PHLPP1α in neurons.
Regional and subcellular localization of hippocampal PHLPP proteins: PHLPP1α is the primary PHLPP protein in the nuclear compartment
Figure 3 indicates that the high level of PHLPP1α, found in the hippocampus, is primarily located in hippocampal neurons. To continue our characterization of hippocampal PHLPP proteins, we next examined each subregion of the hippocampus to determine if different isoforms/splicoforms prefer different hippocampal subfields. We previously reported PHLPP1α levels are elevated in the CA1 region of the hippocampus compared to region CA3. Here, we extend those findings by including analysis of the DG subregion, as well as, examine PHLPP1β/SCOP and PHLPP2 levels. Consistent with previous findings, PHLPP1α was significantly higher in CA1 compared to CA3, and expression in the DG was intermediate between CA1 and CA3 (Fig. 4a and b). PHLPP1β/SCOP was not significantly different between the regions; although, tended to be lower in the CA3 (p = 0.07) and DG (p = 0.06) compared to CA1 (Fig. 4a and c). Similar to PHLPP1α, PHLPP2 levels were also significantly lower in the CA3 compared to either CA1 or DG subregions (Fig. 4a and d). The data confirm our previous findings and suggest that all PHLPP proteins exhibit elevated expression in CA1 relative to CA3.
Fig. 4.
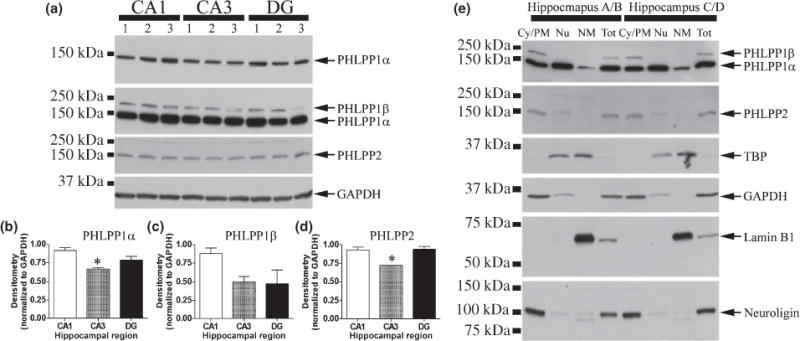
Regional and subcellular distribution of PHLPP proteins. (a) Cytoplasmic extracts from 4-month-old rats (n = 3), separated into CA1, CA3, and DG, and probed for PHLPP proteins. Densitometry measures showing regional distribution of (b) PHLPP1α (c) PHLPP1β and (d) PHLPP2. The asterisk indicates a significant difference (p < 0.05) relative to CA1. (e) Two 10-week-old male rats. One hippocampus from each rat was collected and fractionated into cytoplasmic/plasma membrane (Cy/PM), nucleoplasm (Nu), and nuclear membrane (NM) fractions. The other hippocampus from each rat was homogenized for whole cell extracts (Tot). 20 μg of protein from each fraction was used for western blot analysis and probed for PHLPP1, PHLPP2, TBP (nuclear protein), GAPDH (cytoplasmic protein), Lamin B1 (nuclear membrane protein), and Neuroligin (plasma membrane protein).
Thus far the data show: (i) Compared to other PHLPP proteins, PHLPP1α is the most abundant PHLPP protein in the brain; (ii) within the brain, PHLPP1α localizes to neurons (PHLPP2 and PHLPP1β/SCOP are also likely in neurons albeit at much lower levels); and (iii) within distinct neuron populations of the hippocampus, PHLPP proteins are especially abundant in CA1 neurons. We next determined where, within hippocampal neurons, PHLPP proteins localize. Hippocampi were collected from two 10-week-old male rats. One hippocampus from each rat was separated into cytoplasmic/plasma membrane (Cy/Pm), nucleoplasmic (Nu), and nuclear membrane (NM) fractions, while the other hippocampus was homogenized for total cell lysate. Control proteins were run to verify fraction purity. Intriguingly, PHLPP1β/SCOP and PHLPP2 localize predominantly to the cytoplasmic/plasma membrane fraction, while PHLPP1α was present in all fractions examined (Fig. 4e). Of note, PHLPP1α shows high abundance in the nucleoplasm, and was the only PHLPP protein associated with the nuclear membrane. We next examined whether PHLPP1 proteins inhibit AKT and PKCα phosphorylation in hippocampal neurons.
Protein expression of PHLPP1 in vitro
We were interested to study PHLPP1α and PHLPP1β/SCOP protein function using an in vitro embryonic hippocampal culture model. Primary neuron culture is a useful system to investigate cell signaling pathways without the complexity of glial-neuron interactions in vivo. However, there is debate whether embryonic neurons grown in culture accurately reflect adult neurons and are predictive of cell signaling mechanisms in the adult animal. Therefore, before executing PHLPP knockdown studies in vitro and examining changes in signaling mechanisms, we first defined the relationship between hippocampal PHLPP protein expression in the embryo, young postnatal, and adult animal.
We hypothesized, because AKT is involved in brain development and PHLPPs antagonize AKT signaling, that expression of PHLPP proteins could contribute to changes in AKT activity during maturation. Consistent with this idea, PHLPP1α expression robustly increased over development and maturation (Fig. 5a and b), during the time when total AKT levels markedly declined. PHLPP2, similar to AKT, steadily declined into adulthood (Fig. 5a and c) and PHLPP1β/SCOP exhibited a unique pattern of expression, starting low during embryonic stages, rising during postnatal development, and finally falling back to embryonic levels during adulthood. Intriguingly, pAKT473 levels appear to track the expression of PHLPP1β/SCOP (Fig. 5a, d and e), suggesting that PHLPP1β/SCOP may not antagonize AKT activity. Finally, the PHLPP/AKT regulator FKBP51, an immunophilin associated with multiple hormone receptor complexes, acts as an adapter protein to enhance the physical interaction between PHLPP and AKT(Pei et al. 2009) and was not detectable until adulthood (Fig. 5a).
Fig. 5.
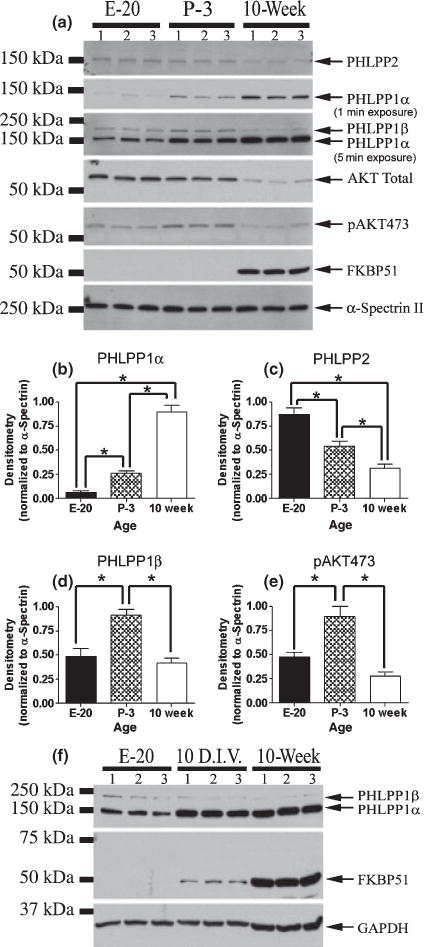
Developmental changes in PHLPP and AKT levels in the hippocampus. (a) Western blots showing protein changes in the level of PHLPP2, PHLPP1α, PHLPP1β, AKT total, pAKT473, FKBP51, and α-Spectrin II during early hippocampal development (E-20 = embryonic day 20; P-3 = postnatal day 3; 10-week = 10-week-old male adult hippocampal tissue; n = 3/age). α-Spectrin II levels did not vary across the developmental ages examined and therefore was used as a loading control. Densitometry measures for expression of (b) PHLPP1α (c) PHLPP2 (d) PHLPP1β, and (e) pAKT473 during development. (f) FKBP51 is a critical regulator of PHLPP/AKT interaction. Western blots show 10 DIV hippocampal neurons express FKBP51. Further, PHLPP1α levels are much higher, and PHLPP1β levels are lower, in 10 DIV neurons compared to embryonic tissue, consistent with cultured neurons showing an adult phenotype.
Lack of FKBP51 at embryonic and postnatal ages suggests PHLPP proteins, although present, may be far less capable of inhibiting AKT. If a similar finding is observed in cultured hippocampal neurons, then in vitro primary neuron culture models are not adequate system to study PHLPP1 signaling mechanisms. Therefore, it was critical to determine whether neurons grown in vitro show an adult phenotype for the expression of PHLPP1 proteins and critical regulators. Total protein was isolated from 10 DIV embryonic hippocampal neurons and compared to embryonic day 20- and 10-week-old adult hippocampi (Fig. 5f). Cultured hippocampal neurons expressed far higher levels of PHLPP1α and lower levels of PHLPP1β/SCOP compared to E20 hippocampi, consistent with adult PHLPP1 levels. In addition, FKPBP51 was clearly present in cultured neurons; although, the expression level was lower compared to adult tissue extracts. Higher levels of FKBP51protein in adult extracts may be because of increased FKBP51 expression and accumulation during maturation. Alternatively, glial cells may express high levels of FKBP51protien in the adult brain, explaining intense FKBP51 immunoreactivity in adult extracts. Together, the data demonstrate PHLPP proteins show a distinct pattern of protein expression at each stage of development, and suggest each PHLPP protein serves a unique function in the developing hippocampus. Moreover, our results confirm in vitro embryonic hippocampal neurons are representative of an adult phenotype, with respect to PHLPP protein levels, and express relevant PHLPP regulators. Therefore, in vitro neurons can be used to investigate neuronal PHLPP signaling mechanisms.
PHLPP1 inhibits AKT signaling in hippocampal neurons
To elucidate the function of PHLPP1 in hippocampal neurons, we selectively knocked down either PHLPP1β/SCOP alone or PHLPP1α and PHLPP1β/SCOP together, and examined the activity of key kinases following stimulation with IGF-1. Previous work indicates that acute application of brain-derived neurotrophic factor to hippocampal neurons caused rapid degradation and a reduction in the levels of PHLPP1β/SCOP(Shimizu et al. 2007). To insure that a decline in PHLPP1β/SCOP or PHLPP1α was because of our shRNA treatment, rather than IGF-1 application, we measured PHLPP1β/SCOP and PHLPP1α levels in neurons transduced with a non-targeting shRNA and treated for 20 min with 100 ng/mL IGF-1. While pAKT437 (p < 0.0001), pAKT308 (p < 0.0001), and pERK2 (p = 0.03) were all significantly increased (Fig. 6a), IGF-1 stimulation had no effect on PHLPP1α or PHLPP1β/SCOP levels (Fig. 6b and c). Therefore, decreased levels of PHLPP1α and PHLPP1β/SCOP in our paradigm are because of targeting shRNA’s and not proteolytic degradation induced by brief stimulation with IGF-1.
Fig. 6.
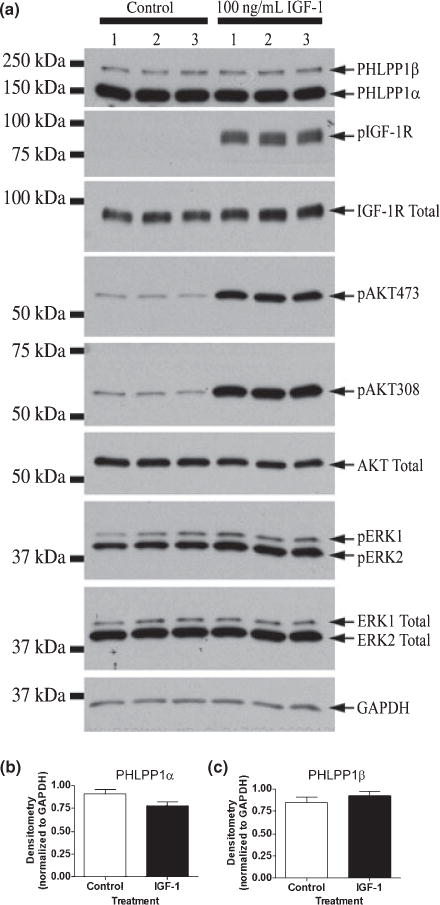
Acute treatment of IGF-1 does not alter PHLPP1 levels. Hippocampal neurons were transduced with lentivirus containing non-targeting shRNA and treated with or without 100 ng/mL IGF-1 for 20 min. (a) Western blots show increases in the level of pIGF-1R, pAKT473, pAKT308, and pERK. Stimulation of hippocampal neurons did not affect the level of either (b) PHLPP1α or (c) PHLPP1β (n = 3 for all graphs).
Pleckstrin homology and leucine rich repeat protein phosphatase 1β/SCOP was selectively knocked down by PHLPP1β/SCOP targeting shRNA, in 10 DIV hippocampal cultures (Fig. 7a–c). Cultures were transduced at both 0 DIV and 7 DIV with a non-targeting shRNA or selective PHLPP1β/SCOP targeting shRNA. At 10 DIV cultures were stimulated with 100 ng/mL IGF-1 for 20 min and subsequently analyzed for changes in the phosphorylation status of AKT, PKCα, and ERK. Loss of PHLPP1β/SCOP caused a dramatic increase in pERK levels (Fig. 8a–c), indicating PHLPP1β/SCOP negatively regulates Ras/MAP/ERK signaling. This finding is consistent with reports that overexpression of PHLPP1β/SCOP in hippocampal neurons robustly decreases ERK signaling. However, phosphorylated AKT (Fig. 9a, c and d) and PKCα (Fig. 10a and d) were significantly decreased; indicating PHLPP1β/SCOP positively regulates these signaling kinases. The shift in protein phosphorylation was also observed under steady state conditions. Examination of proteins after a 2-h serum starvation, in the absence of IGF-1 stimulation, confirmed decreased AKT/PKC phosphorylation and increased ERK phosphorylation in PHLPP1β/SCOP knockdown neurons (Figure S5). The results support the idea that PHLPP1β/SCOP alters the basal activity of AKT, PKC, and ERK kinases.
Fig. 7.
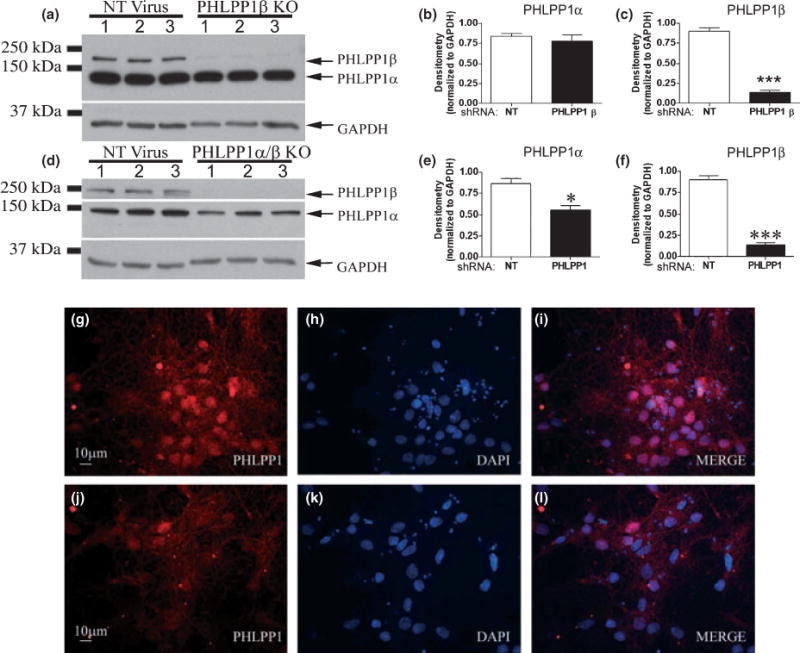
PHLPP1β and PHLPP1 knockdown in hippocampal neurons. Hippocampal neurons were transduced with lentivirus containing either a non-targeting shRNA (NT Virus), a shRNA virus targeting PHLPP1β (PHLPP1β KO), or shNRA’s targeting both PHLPP1α/β (PHLPP1 KO) and treated with 100 ng/mL IGF-1 for 20 min. (a) Representative western blots (n = 3) showing effect of shRNA on PHLPP1β levels. (b and c) Densitometry of western blots (n = 6) show protein levels of PHLPP1β, but not PHLPP1α, is significantly decreased. (d) Representative western blots (n = 3) showing effect of shRNA’s on PHLPP1 levels. (e and f) Densitometry of western blots (n = 6) show both PHLPP1β and PHLPP1α are significantly decreased. Knockdown of PHLPP1α was verified by immunofluorescence. (g–i) 10 DIV hippocampal neurons transduced with the non-targeting shRNA show a high level of PHLPP1 staining (RED) which predominantly localizes to the nucleus. (j–l) PHLPP1 staining is decreased in neurons transduced with PHLPP1α/β targeting shRNA’s. Data are significant at *p < 0.05, ***p < 0.0001.
Fig. 8.
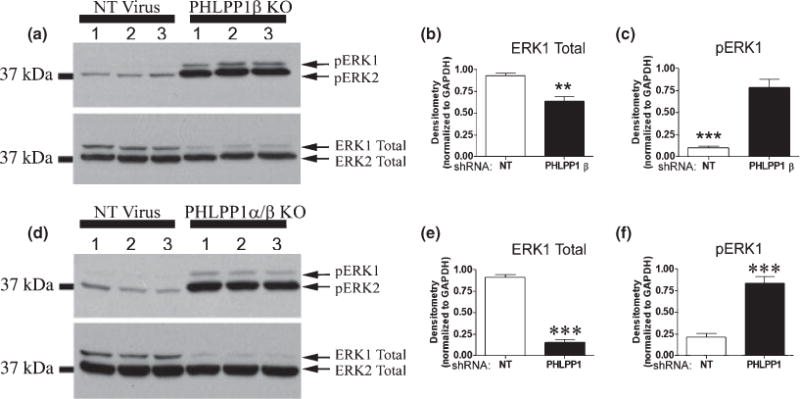
Effect of PHLPP1β and PHLPP1 knockdown on ERK phosphorylation. Hippocampal neurons transduced with lentivirus containing either a non-targeting shRNA (NT Virus), a shRNA virus targeting PHLPP1β (PHLPP1β KO), or shNRA’s targeting both PHLPP1α/β (PHLPP1 KO) and treated with 100 ng/mL IGF-1 for 20 min. (a and d) Representative western blots (n = 3) show the effect of knockdown on ERK phosphorylation. (b and c) Densitometry of western blots (n = 6) show PHLPP1β knockdown reduces ERK1 total levels but increases phosphorylated ERK levels. (e and f) Densitometry of western blots (n = 6) show knockdown of PHLPP1 also reduces ERK1 total levels and increases ERK1 phosphorylation. Data are significant at **p < 0.001, ***p < 0.0001.
Fig. 9.
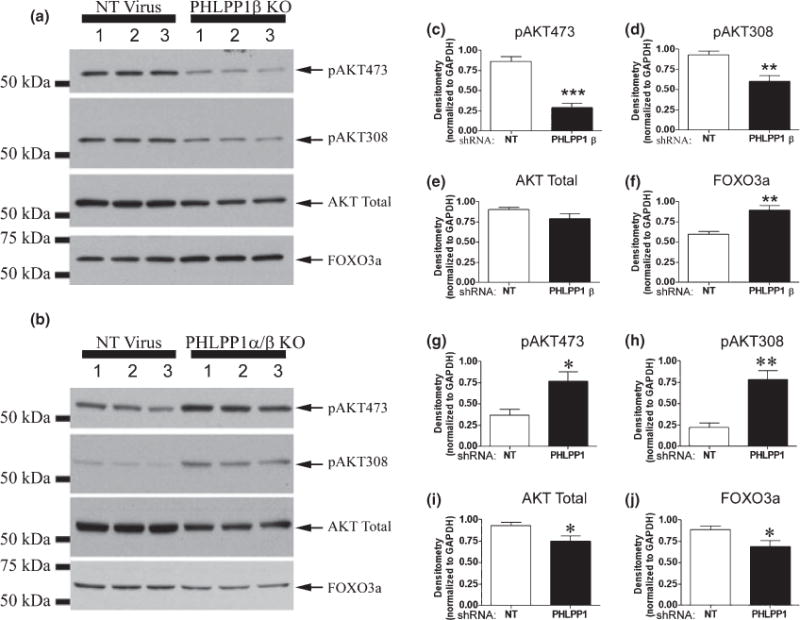
Effect of PHLPP1β and PHLPP1 knockdown on AKT signaling. Hippocampal neurons transduced with lentivirus containing either a non-targeting shRNA (NT Virus), a shRNA virus targeting PHLPP1β (PHLPP1β KO), or shNRA’s targeting both PHLPP1α/β (PHLPP1 KO) and treated with 100 ng/mL IGF-1 for 20 min. (a and b) Representative western blots (n = 3) show the effect of knockdown on AKT phosphorylation and the AKT target substrate FOXO3a. (c–e) Densitometry of western blots (n = 6) show PHLPP1β knockdown significantly reduces AKT phosphorylation at Ser473 and Thr308. No change in AKT total levels was observed. (f) Densitometry (n = 6) shows FOXO3a is significantly increased in PHLPP1β knockdown neurons, consistent with reduced AKT activity. (g–i) Densitometry of western blots (n = 6) show PHLPP1 knockdown significantly increases AKT phosphorylation at Ser473 and Thr308. In addition AKT total levels are significantly decreased. (j) Densitometry (n = 6) shows FOXO3a is significantly decreased in PHLPP1 knockdown neurons, consistent with increased AKT activity. Data are significant at *p < 0.05, **p < 0.001, ***p < 0.0001.
Fig. 10.
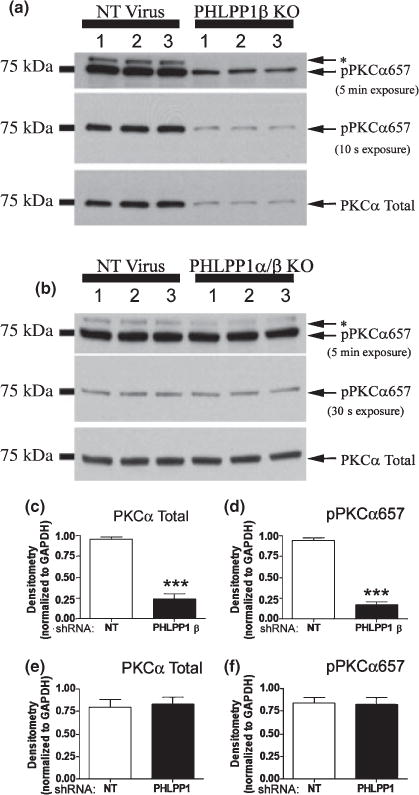
Effect of PHLPP1β and PHLPP1 knockdown on PKC phosphorylation. Hippocampal neurons transduced with lentivirus containing either a non-targeting shRNA (NT Virus), a shRNA virus targeting PHLPP1β (PHLPP1β KO), or shNRA’s targeting both PHLPP1α/β (PHLPP1 KO) and treated with 100 ng/mL IGF-1 for 20 min. (a and b) Representative western blots (n = 3) show the effect of knockdown on PKC phosphorylation. (c and d) Densitometry of western blots (n = 6) show PHLPP1β knockdown significantly reduces PKC total levels and phosphorylation at Ser657. (e and f) Densitometry of western blots (n = 6) show PHLPP1 knockdown does not alter PKC total levels or phosphorylation. Data are significant at ***p < 0.0001.
To verify that knock down of PHLPP1β/SCOP resulted in decreased activation of AKT and PKCα, we measured total levels of PKCα and FOXO3a. By inducing FOXO3a nuclear to cytoplasmic export and subsequent degradation (Plas and Thompson 2003), AKT negatively regulates the pro-death protein FOXO3a. Therefore, down-regulation of phosphorylated AKT would predict increased total levels of FOXO3a. Consistent with AKT’s inhibition of FOXO3a signaling, total levels of FOXO3a were significantly increased in PHLPP1β/SCOP knockout neurons (Fig. 9a and f). Phosphorylation at pPKCα657 stabilizes PKCα levels (Bornancin and Parker 1997). Therefore, our results on phosphorylated PKC would predict a robust decrease in total PKCα levels, which was found to be the case (Fig. 10a and c). Moreover, longer exposures of pPKCα657 blots indicate a higher migrating band similarly affected by knockdown of PHLPP1β/SCOP and not observed in PKCα total blots (asterisks in Fig. 10a and b). Given the homology of the Ser657 PKCα hydrophobic phosphorylation site on other PKCs, the upper band may be the pPKCα657 antibody cross-reacting with other PKC isoforms. Therefore, additional PKC proteins may also be regulated by PHLPP1 protein levels.
Because the mRNA sequence for PHLPP1α is also contained in the PHLPP1β/SCOP mRNA, targeting PHLPP1α through shRNA techniques also inhibits PHLPP1β/SCOP, resulting in a general PHLPP1 knockdown (designated PHLPP1α/β knockout (KO) samples). Hippocampal neurons were transduced at both 0 DIV and 7 DIV with a non-targeting shRNA or two shRNA’s targeting predicted coding regions within the middle of rat PHLPP1 mRNA. At 10 DIV, cultures were treated with 100 ng/mL IGF-1 for 20 min, and subsequently analyzed for changes in the phosphorylation status of AKT, PKCα, and ERK. We observed an approximately 90% knockdown of PHLPP1β/SCOP and 30–40% knockdown of PHLPP1α (Fig. 7d–f). To further verify knockdown, immunofluorescence of PHLPP1α was analyzed in 10 DIV neurons either transduced with a non-targeting shRNA (Fig. 7g–i) or the PHLPP1 targeting shRNA’s (Fig. 7j–l). Consistent with the western blot results, PHLPP1α signal (Red Staining) is dramatically reduced in neurons transduced with PHLPP1 targeting shRNA’s. Importantly, even moderate knockdown of PHLPP1 induced a robust increase in the phosphorylated levels of pAKT473 (~40% increase/Fig. 9b and g) and pAKT308 (~50% increase/Fig. 9b and h). On the other hand total AKT levels showed a mild decrease (Fig. 9b and i). Moreover, the results on pAKT are confirmed by changes in the level of FOXO3a total. FOXO3a was significantly decreased in PHLPP1 knockdown neurons (Fig. 9b and j). No significant differences in the level of pPKCα657 and PKCα total levels were observed following knockdown of PHLPP1 (Fig. 10b, e and f). In addition, decreasing PHLPP1 levels caused a robust increase in the levels of phosphorylated ERK1 but significantly decreased ERK1 total levels (Fig. 8d–f). Together, the data indicate that PHLPP1α inhibits the AKT pathway in hippocampal neurons.
Discussion
Pleckstrin homology and leucine rich repeat phosphatase proteins are novel regulators of multiple cell signaling pathways. Studies using non-neuronal culture models indicate PHLPP1 inhibits the kinases AKT and PKCα (Gao et al. 2005; Brognard et al. 2007; Hirano et al. 2009). However, it has not been directly shown PHLPP1 can inhibit AKT and PKCα in neurons. Multiple CNS diseases are linked to dysregulation of neuronal AKT. Validation that PHLPP proteins are in fact AKT regulators in the brain is an important advancement in our understanding of the underlying biochemical mechanisms controlling CNS AKTsignaling.
The results of the current study provide unique evidence for a divergence in the function of PHLPP1α and PHLPP1β/SCOP splice variants, and suggest that PHLPP1α plays a major role in regulating AKT signaling in neurons. As PHLPP1β/SCOP possesses some of the same regulatory domains as PHLPP1α, it is thought PHLPP1β/SCOP may regulate AKT and PKCα, in addition to ERK (Shimizu et al. 2010). Here, we report, for the first time, significant functional differences in the role of PHLPP1 splicoforms for regulating the AKT and PKC signaling pathways in neurons. The difference was revealed by comparing the effects of knockdown of both PHLPP1α and PHLPP1β/SCOP, relative to knockdown of PHLPP1β/SCOP alone (Figs 7–10). Knockdown of both phosphatases results in the expected increase in pAKT473, consistent with previous studies in cancer cells (Gao et al. 2005). Quite the opposite was observed following selective knockdown of PHLPP1β/SCOP, which significantly reduced pAKT473, pAKT308, and pPKCα657 in hippocampal neurons. Similarly, the decrease in pPKCα657 and total PKCα levels observed following knockdown of PHLPP1β/SCOP was not observed following knockdown of PHLPP1α/β, consistent with the idea that PHLPP1α and PHLPP1β/SCOP have opposing influences on some signaling pathways. In contrast, PHLPP1α/β KO, like PHLPP1β/SCOP KO, reduced total ERK1 and increased pERK expression. Together, the results suggest that PHLPP1α exhibits greater control over the AKT signaling pathway and PHLPP1β/SCOP has effects opposite PHLPP1α on AKT and PKCα, while acting as the primarily regulator of the Ras/MAP/ERK signaling pathway. Finally, the decreased AKT/PKC phosphorylation and increased ERK phosphorylation was observed under steady state conditions in PHLPP1β/SCOP knockdown neurons (Figure S5) indicating that PHLPP1β/SCOP contributes to the basal activation of AKT, PKC, and ERK kinases.
The fact PHLPP1α and PHLPP1β/SCOP have divergent effects on AKT and PKC signaling, may help explain why over-expressing PHLPP1α in HEK293-FT cells results in a massive increase in PHLPP1β/SCOP levels. That is, expression of PHLPP1β/SCOP may be altered in order to adjust PHLPP1α actions on AKT activity. This balance in PHLPP1 splice variants is reflected by hippocampal differences in the level of PHLPP proteins in region CA1 and CA3. Specifically, PHLPP1α is significantly lower in the CA3 and PHLPP1β/SCOP tends to be lower in this region as well. However, many signaling pathways are affected by selective PHLPP1β/SCOP knockdown, thus it is not certain which pathway mitigates this cross-talk. Moreover, because we over-expressed PHLPP1α and knocked down PHLPP1α/β in HEK293-FT cells to verify the quality of the antibodies used in our work, we had the opportunity to determine if PHLPP1 regulates AKT, PKC, and ERK in HEK293-FT cells in a manner similar to neurons. Intriguingly, we did not observe the same role of PHLPP1 proteins in regulating AKT, PKC, and ERK signaling in HEK293-FT cells, compared to hippocampal neurons (Figures S6 and S7). Knockdown of PHLPP1 had no effect on the phosphorylated levels of AKT or ERK; however, a mild (although significant) increase in pPKCα657 levels was observed. In addition, over-expression of PHLPP1α robustly increased pERK levels and tended to increase pAKT473 levels. While we cannot explain the differential regulation of PHLPP1 proteins on cell signaling pathways in HEK393-FT cells, our findings are in agreement with work by Qiao and colleagues. These authors recently examined PHLPP signaling in multiple cell types. In some cells, including those of a breast cancer lineage, AKT activation is inhibited by over-expression of PHLPP proteins. However, overexpression of PHLPP proteins in many other cell types, including HEK293-T cells, did not alter AKT phosphorylation (Qiao et al. 2010). It is conceivable that HEK293 cells do not express crucial adapter proteins required for PHLPP1 regulation of AKT.
In addition to knockdown experiments, characterization of PHLPP proteins in the brain reveal several significant findings which underscore the potential importance of the PHLPP1α splice variant in regulation of neuronal AKT. First, developmental studies reveal the PHLPP1α isoform accumulates over development and expression in the adult is greatly increased relative to PHLPP1β/SCOP and PHLPP2. Interestingly, the abrupt increase in PHLPP1α expression is associated with a decrease in AKT activity during development. A recent study found overactivation of AKT during development disrupts normal neuronal growth and may contribute to mental illness (Kim et al. 2009). Our results suggest that PHLPP1α contributes to the stringent regulation of AKT activity, which is critical for normal CNS growth during maturation. It would be interesting to learn if changes in PHLPP1α activity accompany changes in AKT activity in models of CNS disease.
In addition to developmental studies, subcellular fractionation experiments using adult hippocampal tissue reveal an important aspect of PHLPP1α regulation. While PHLPP1β/SCOP and PHLPP2 predominantly localize to the cytoplasmic/plasma membrane fraction, PHLPP1α is highly abundant in the nucleus and nuclear membrane. The latter finding is supported by intense nuclear and perinuclear immunofluorescent staining of PHLPP1α in cultured hippocampal neurons. The importance of this observation relates to AKT’s well elucidated mechanisms of action. Specifically, activation of AKT by phosphorylation at Thr308 and Ser473 elicits a rapid and robust translocation of AKT into the nucleus. Once in the nuclear compartment AKT targets multiple substrates for phosphorylation, including FOXO3a, and thereby promotes survival signaling mechanisms (Zheng et al. 2002). The finding that PHLPP1α is the primary PHLPP protein within the nuclear compartment, suggests that PHLPP1α alone is positioned to turn off AKT once activated. Therefore, nuclear PHLPP1α, rather than the predominately cytoplasmic PHLPP1β/SCOP or PHLPP2, is poised to regulate nuclear AKT activity in neurons.
Finally, our characterization of PHLPP proteins reveal among different CNS cell types, PHLPP1α is primarily confined to neurons (Fig. 3). This ostensibly trite finding, in fact, may be one of the more intriguing and important discoveries within this work. Searching for methods to selectively increase AKT activity in neurons but not the supporting glia has been a continuous yet unsuccessful enterprise. Increasing AKT globally is decidedly undesirable because of the increased risk for developing peripheral or CNS cancers. This concern was highlighted in a recent review suggesting the hypoactivity of the AKT signaling cascade contributes to the development of schizophrenia (Kalkman 2006). At the same time, decreased AKT activity might explain the reduced risk for developing cancer in the schizophrenic population (Barak et al. 2005; Levav et al. 2007). Therefore, the author predicts using pharmacological interventions to increase CNS AKT activity may be a good strategy to prevent or reduce mental illness but increases the risk of developing CNS tumors as a consequence to AKT mediated therapies (Kalkman 2006). Together our results show that (i) PHLPP1α is primarily present in neurons and (ii) a potent AKT inhibitor in neurons, it is possible that inhibition of PHLPP1α with small molecule inhibitors may be a useful strategy to increase neuronal AKT levels while side-stepping the associated risk of developing gliomas. In addition, the comparatively low levels of PHLPP1α in multiple organs outside the brain may also help to reduce other side effects potentially caused by increased AKT activity. As PHLPP research advances its likely selective agonists and antagonists will become available, allowing the hypothesis to be put to the test.
As interest in PHLPP proteins for treatment of human disease mounts, our results for a divergence in the function of PHLPP1α and PHLPP1β/SCOP provide insight into potential therapeutic strategies. In cancer therapy, where activated AKT needs to be reduced, enhancing PHLPP1α signaling while reducing PHLPP1β/SCOP signaling might be more effective. Alternatively, in neurodegenerative disease where increased AKT activity is desired, the opposite strategy could apply. Consistent with the idea that targeting PHLPP1 proteins may improve outcomes in neurodegenerative disease, recent work inversely correlates decreased PHLPP1α levels with increased pAKT473 levels and reduced cell death in the striatum in Huntington’s Disease mouse models (Saavedra et al. 2010). Moreover, decreased PHLPP1 levels in the putamen are observed in samples taken from Huntington’s Disease patients, suggesting the PHLPP1/AKT axis is important in human disease.
Our finding that different PHLPP1 splice variants serve different functions also dovetails well with recent advances in PHLPP research. The first published report of a PHLPP1 knockout animal was recently described (Masubuchi et al. 2010). In the context of this new animal model, our observations on PHLPP1 splice variants are particularly important because they highlight subtleties in the dual regulation and interaction between PHLPP1α and PHLPP1β/SCOP which may otherwise be overlooked. Complete PHLPP1 gene knockout may hide effects caused by loss of PHLPP1β/SCOP and preferentially reveal PHLPP1α’s influence on cell signaling. In our system, the effect of PHLPP1β/SCOP knockdown on AKT and PKCα was reversed and lost, respectively, when PHLPP1α was simultaneously knocked down; this finding indicates PHLPP1α’s effects on the AKT and PKCα pathways are dominant to PHLPP1β/SCOP’s when both our reduced; such is the case with the PHLPP1 KO mouse. Nevertheless, this animal model promises exciting new data and will help elucidate the roles PHLPP1 plays in the body, as well as, determine what consequences dysfunctional PHLPP1 signaling has on behavior.
In conclusion our results indicate PHLPP1α and PHLPP1β/SCOP do not serve the same function for regulation of AKT, PKC, or ERK signaling in hippocampal neurons. PHLPP1α inhibits AKT and PKC signaling in neurons. Alternatively, PHLPP1β/SCOP is important for the normal activation of AKT and PKC signaling but plays a dominant role in inhibiting the ERK pathway in neurons. The demonstration that PHLPP1α is highly abundant in neurons is a major advance in understanding potential strategies to increase neuronal AKT in diseased neurons. While work here points to PHLPP1α is a potent regulator of AKT in neurons, future studies will need to define PHLPP2’s contribution to AKT regulation in neurons. Although, PHLPP2 appears to be less abundant, no broad conclusions can be made as to the potential importance of PHLPP2 for AKT regulation. It is possible the phosphatase activity of PHLPP2 is differently regulated relative to PHLPP1α and could provide another level of cell signaling regulation. In agreement with this possibility, PHLPP1β/SCOP expression in neurons is far lower than PHLPP1α, and yet PHLPP1β/SCOP is a major regulator of ERK phosphorylation.
Supplementary Material
Figure S1. Validation of hippocampal cell culture.
Figure S2. Cayman PHLPP1 antibody detects PHLPP1α
Figure S3. Enhanced image of astrocyte & neurons.
Figure S4. PHLPP1 brain immunofluorescence control and CA1 228-ms exposure.
Figure S5. Neuronal PHLPP1β knockdown alters basal activation of AKT PKC and ERK kinases.
Figure S6. Effect of PHLPP1 knockdown to alter AKT PKC and ERK activation in HEK293-FT cells.
Figure S7. Effect of PHLPP1α over-expression to alter AKT PKC and ERK activation in HEK293-FT cells.
Acknowledgments
This research was supported by the NIH: (i) RO1-AG014979, (ii) RO1-MH059891 and (iii) Evelyn F. McKnight Brain Research Grant.
Abbreviations used
- AKT
protein kinase B
- BSA
bovine serum albumin
- CA1
Ammon’s horn (area CA1)
- CA3
Ammon’s horn (area CA3)
- CERI
cytoplasmic extraction reagent 1
- DG
dentate gyrus
- DIV
days in vitro
- ERK
extracellular regulated kinase
- FOXO3a
Forkhead box O3a transcription factor
- IGF-1
insulin-like growth factor 1
- KO
knockout
- PBS
phosphate-buffered saline
- PHLPP
Pleckstrin homology domain and leucine-rich repeat protein phosphatase
- PKC
protein kinase C
- RIPA
ristocetin-induced platelet agglutination
- SCOP
SCN circadian oscillatory protein
- TBP
TATA box binding protein
- TBS
Tris-buffered saline
Footnotes
Additional Supporting Information may be found in the online version of this article.
As a service to our authors and readers, this journal provides supporting information supplied by the authors. Such materials are peer-reviewed and may be re-organized for online delivery, but are not copy-edited or typeset. Technical support issues arising from supporting information (other than missing files) should be addressed to the authors.
The authors declare that they have no conflict of interest.
References
- Barak Y, Achiron A, Mandel M, Mirecki I, Aizenberg D. Reduced cancer incidence among patients with schizophrenia. Cancer. 2005;104:2817–2821. doi: 10.1002/cncr.21574. [DOI] [PubMed] [Google Scholar]
- Beaulieu JM, Gainetdinov RR, Caron MG. Akt/GSK3 signaling in the action of psychotropic drugs. Annu Rev Pharmacol Toxicol. 2009;49:327–347. doi: 10.1146/annurev.pharmtox.011008.145634. [DOI] [PubMed] [Google Scholar]
- Bornancin F, Parker PJ. Phosphorylation of protein kinase C-alpha on serine 657 controls the accumulation of active enzyme and contributes to its phosphatase-resistant state. J Biol Chem. 1997;272:3544–3549. doi: 10.1074/jbc.272.6.3544. [DOI] [PubMed] [Google Scholar]
- Brewer GJ, Torricelli JR, Evege EK, Price PJ. Optimized survival of hippocampal neurons in B27-supplemented Neurobasal, a new serum-free medium combination. J Neurosci Res. 1993;35:567–576. doi: 10.1002/jnr.490350513. [DOI] [PubMed] [Google Scholar]
- Brognard J, Sierecki E, Gao T, Newton AC. PHLPP and a second isoform, PHLPP2, differentially attenuate the amplitude of Akt signaling by regulating distinct Akt isoforms. Mol Cell. 2007;25:917–931. doi: 10.1016/j.molcel.2007.02.017. [DOI] [PubMed] [Google Scholar]
- Colin E, Regulier E, Perrin V, Durr A, Brice A, Aebischer P, Deglon N, Humbert S, Saudou F. Akt is altered in an animal model of Huntington’s disease and in patients. Eur J Neurosci. 2005;21:1478–1488. doi: 10.1111/j.1460-9568.2005.03985.x. [DOI] [PubMed] [Google Scholar]
- Dickey CA, Koren J, Zhang YJ, et al. Akt and CHIP core-gulate tau degradation through coordinated interactions. Proc Natl Acad Sci USA. 2008;105:3622–3627. doi: 10.1073/pnas.0709180105. [DOI] [PMC free article] [PubMed] [Google Scholar]
- Franke TF. PI3K/Akt: getting it right matters. Oncogene. 2008;27:6473–6488. doi: 10.1038/onc.2008.313. [DOI] [PubMed] [Google Scholar]
- Gao T, Furnari F, Newton AC. PHLPP: a phosphatase that directly dephosphorylates Akt, promotes apoptosis, and suppresses tumor growth. Mol Cell. 2005;18:13–24. doi: 10.1016/j.molcel.2005.03.008. [DOI] [PubMed] [Google Scholar]
- Gao T, Brognard J, Newton AC. The phosphatase PHLPP controls the cellular levels of protein kinase C. J Biol Chem. 2008;283:6300–6311. doi: 10.1074/jbc.M707319200. [DOI] [PubMed] [Google Scholar]
- Gines S, Ivanova E, Seong IS, Saura CA, MacDonald ME. Enhanced Akt signaling is an early pro-survival response that reflects N-methyl-D-aspartate receptor activation in Huntington’s disease knock-in striatal cells. J Biol Chem. 2003;278:50514–50522. doi: 10.1074/jbc.M309348200. [DOI] [PubMed] [Google Scholar]
- Gysin S, Imber R. Phorbol-ester-activated protein kinase C-alpha lacking phosphorylation at Ser657 is down-regulated by a mechanism involving dephosphorylation. Eur J Biochem. 1997;249:156–160. doi: 10.1111/j.1432-1033.1997.t01-2-00156.x. [DOI] [PubMed] [Google Scholar]
- Hirano I, Nakamura S, Yokota D, Ono T, Shigeno K, Fujisawa S, Shinjo K, Ohnishi K. Depletion of Pleckstrin homology domain leucine-rich repeat protein phosphatases 1 and 2 by Bcr-Abl promotes chronic myelogenous leukemia cell proliferation through continuous phosphorylation of Akt isoforms. J Biol Chem. 2009;284:22155–22165. doi: 10.1074/jbc.M808182200. [DOI] [PMC free article] [PubMed] [Google Scholar]
- Humbert S, Bryson EA, Cordelieres FP, Connors NC, Datta SR, Finkbeiner S, Greenberg ME, Saudou F. The IGF-1/Akt pathway is neuroprotective in Huntington’s disease and involves Huntingtin phosphorylation by Akt. Dev Cell. 2002;2:831–837. doi: 10.1016/s1534-5807(02)00188-0. [DOI] [PubMed] [Google Scholar]
- Jackson TC, Rani A, Kumar A, Foster TC. Regional hippocampal differences in AKT survival signaling across the lifespan: implications for CA1 vulnerability with aging. Cell Death Differ. 2009;16:439–448. doi: 10.1038/cdd.2008.171. [DOI] [PMC free article] [PubMed] [Google Scholar]
- Kalkman HO. The role of the phosphatidylinositide 3-kinase-protein kinase B pathway in schizophrenia. Pharmacol Ther. 2006;110:117–134. doi: 10.1016/j.pharmthera.2005.10.014. [DOI] [PubMed] [Google Scholar]
- Kanan Y, Matsumoto H, Song H, Sokolov M, Anderson RE, Rajala RV. Serine/threonine kinase akt activation regulates the activity of retinal serine/threonine phosphatases, PHLPP and PHLPPL. J Neurochem. 2010;113:477–488. doi: 10.1111/j.1471-4159.2010.06609.x. [DOI] [PMC free article] [PubMed] [Google Scholar]
- Kim JY, Duan X, Liu CY, Jang MH, Guo JU, Pow-anpongkul N, Kang E, Song H, Ming GL. DISC1 regulates new neuron development in the adult brain via modulation of AKT-mTOR signaling through KIAA1212. Neuron. 2009;63:761–773. doi: 10.1016/j.neuron.2009.08.008. [DOI] [PMC free article] [PubMed] [Google Scholar]
- Lee HK, Kumar P, Fu Q, Rosen KM, Querfurth HW. The insulin/Akt signaling pathway is targeted by intracellular beta-amyloid. Mol Biol Cell. 2009;20:1533–1544. doi: 10.1091/mbc.E08-07-0777. [DOI] [PMC free article] [PubMed] [Google Scholar]
- Levav I, Lipshitz I, Novikov I, Pugachova I, Kohn R, Barchana M, Ponizovsky A, Werner H. Cancer risk among parents and siblings of patients with schizophrenia. Br J Psychiatry. 2007;190:156–161. doi: 10.1192/bjp.bp.106.024943. [DOI] [PubMed] [Google Scholar]
- Masubuchi S, Gao T, O’Neill A, Eckel-Mahan K, Newton AC, Sassone-Corsi P. Protein phosphatase PHLPP1 controls the light-induced resetting of the circadian clock. Proc Natl Acad Sci USA. 2010;107:1642–1647. doi: 10.1073/pnas.0910292107. [DOI] [PMC free article] [PubMed] [Google Scholar]
- Pei H, Li L, Fridley BL, Jenkins GD, Kalari KR, Lingle W, Petersen G, Lou Z, Wang L. FKBP51 affects cancer cell response to chemotherapy by negatively regulating Akt. Cancer Cell. 2009;16:259–266. doi: 10.1016/j.ccr.2009.07.016. [DOI] [PMC free article] [PubMed] [Google Scholar]
- Plas DR, Thompson CB. Akt activation promotes degradation of tuberin and FOXO3a via the proteasome. J Biol Chem. 2003;278:12361–12366. doi: 10.1074/jbc.M213069200. [DOI] [PubMed] [Google Scholar]
- Qiao M, Wang Y, Xu X, et al. Mst1 is an interacting protein that mediates PHLPPs’ induced apoptosis. Mol Cell. 2010;38:512–523. doi: 10.1016/j.molcel.2010.03.017. [DOI] [PubMed] [Google Scholar]
- Saavedra A, Garcia-Martinez JM, Xifro X, Giralt A, Torres-Peraza JF, Canals JM, Diaz-Hernandez M, Lucas JJ, Alberch J, Perez-Navarro E. PH domain leucine-rich repeat protein phosphatase 1 contributes to maintain the activation of the PI3K/Akt pro-survival pathway in Huntington’s disease striatum. Cell Death Differ. 2010;17:324–335. doi: 10.1038/cdd.2009.127. [DOI] [PubMed] [Google Scholar]
- Semple-Rowland SL, Eccles KS, Humberstone EJ. Targeted expression of two proteins in neural retina using self-inactivating, insulated lentiviral vectors carrying two internal independent promoters. Mol Vis. 2007;13:2001–2011. [PubMed] [Google Scholar]
- Shimizu K, Mackenzie SM, Storm DR. SCOP/PHLPP and its functional role in the brain. Mol Biosyst. 2010;6:38–43. doi: 10.1039/b911410f. [DOI] [PMC free article] [PubMed] [Google Scholar]
- Shimizu K, Okada M, Takano A, Nagai K. SCOP, a novel gene product expressed in a circadian manner in rat suprachiasmatic nucleus. FEBS Lett. 1999;458:363–369. doi: 10.1016/s0014-5793(99)01190-4. [DOI] [PubMed] [Google Scholar]
- Shimizu K, Okada M, Nagai K, Fukada Y. Suprachiasmatic nucleus circadian oscillatory protein, a novel binding partner of K-Ras in the membrane rafts, negatively regulates MAPK pathway. J Biol Chem. 2003;278:14920–14925. doi: 10.1074/jbc.M213214200. [DOI] [PubMed] [Google Scholar]
- Shimizu K, Phan T, Mansuy IM, Storm DR. Proteolytic degradation of SCOP in the hippocampus contributes to activation of MAP kinase and memory. Cell. 2007;128:1219–1229. doi: 10.1016/j.cell.2006.12.047. [DOI] [PMC free article] [PubMed] [Google Scholar]
- Thiselton DL, Vladimirov VI, Kuo PH, et al. AKT1 is associated with schizophrenia across multiple symptom dimensions in the Irish study of high density schizophrenia families. Biol Psychiatry. 2008;63:449–457. doi: 10.1016/j.biopsych.2007.06.005. [DOI] [PMC free article] [PubMed] [Google Scholar]
- Timmons S, Coakley MF, Moloney AM, O’ Neill C. Akt signal transduction dysfunction in Parkinson’s disease. Neurosci Lett. 2009;467:30–35. doi: 10.1016/j.neulet.2009.09.055. [DOI] [PubMed] [Google Scholar]
- Xiromerisiou G, Hadjigeorgiou GM, Papadimitriou A, Katsarogiannis E, Gourbali V, Singleton AB. Association between AKT1 gene and Parkinson’s disease: a protective haplotype. Neurosci Lett. 2008;436:232–234. doi: 10.1016/j.neulet.2008.03.026. [DOI] [PMC free article] [PubMed] [Google Scholar]
- Yu HS, Kim SH, Park HG, Kim YS, Ahn YM. Activation of Akt signaling in rat brain by intracerebroventricular injection of ouabain: a rat model for mania. Prog Neuropsychopharmacol Biol Psychiatry. 2010;34:888–894. doi: 10.1016/j.pnpbp.2010.04.010. [DOI] [PubMed] [Google Scholar]
- Zheng WH, Kar S, Quirion R. Insulin-like growth factor-1-induced phosphorylation of transcription factor FKHRL1 is mediated by phosphatidylinositol 3-kinase/Akt kinase and role of this pathway in insulin-like growth factor-1-induced survival of cultured hippocampal neurons. Mol Pharmacol. 2002;62:225–233. doi: 10.1124/mol.62.2.225. [DOI] [PubMed] [Google Scholar]
Associated Data
This section collects any data citations, data availability statements, or supplementary materials included in this article.
Supplementary Materials
Figure S1. Validation of hippocampal cell culture.
Figure S2. Cayman PHLPP1 antibody detects PHLPP1α
Figure S3. Enhanced image of astrocyte & neurons.
Figure S4. PHLPP1 brain immunofluorescence control and CA1 228-ms exposure.
Figure S5. Neuronal PHLPP1β knockdown alters basal activation of AKT PKC and ERK kinases.
Figure S6. Effect of PHLPP1 knockdown to alter AKT PKC and ERK activation in HEK293-FT cells.
Figure S7. Effect of PHLPP1α over-expression to alter AKT PKC and ERK activation in HEK293-FT cells.