Abstract
Objective
To correlate meniscal T2* relaxation times using ultra-short echo time (UTE) magnetic resonance imaging (MRI) with quantitative microscopic methods, and to determine the effect of meniscal repair on post-operative cartilage T2 values.
Design
A medial meniscal tear was created and repaired in the anterior horn of one limb of 28 crossbred mature ewes. MR scans for morphological evaluation, meniscal T2* values, and cartilage T2 values were acquired at 0, 4 and 8 months post-operatively for the Tear and Non-Op limb. Samples of menisci from both limbs were analyzed using multiphoton microscopy (MPM) analysis and biomechanical testing.
Results
Significantly prolonged meniscal T2* values were found in repaired limbs than in control limbs, p<0.0001. No regional differences of T2* were detected for either the repaired or control limbs in the anterior horn. Repaired limbs had prolonged cartilage T2 values, primarily anteriorly, and tended to have lower biomechanical force to failure at 8 months than Non-Op limbs. MPM autofluorescence and second harmonic generation data correlated with T2* values at 8 months (ρ=−0.48, p=0.06).
Conclusions
T2* mapping is sensitive to detecting temporal and zonal differences of meniscal structure and composition. Meniscal MPM and cartilage T2 values indicate changes in tissue integrity in the presence of meniscal repair.
Keywords: MRI, meniscus, cartilage, UTE
INTRODUCTION
Magnetic resonance imaging (MRI) is commonly used for non-invasive evaluation of meniscal repairs, but meniscal visualization is difficult due to limited signal intensity, resulting from short transverse relaxation times (T2). Recent imaging investigations of the meniscus have utilized quantitative MRI (qMRI) as a means to extract biochemical composition of the tissue and relate it to joint function or osteoarthritis (OA) grade. Zarins et al. assessed meniscal T1ρ and T2 values and found correlations with joint pain, stiffness, and function (1). Similarly, Rauscher et al. found differences of meniscal T1ρ and T2 between control subjects and individuals with mild and severe OA (2). An additional qMRI technique for meniscal evaluation utilizes ultra-short echo (UTE) imaging.
UTE sequences acquire images at very short echo times (TE ≤ 0.3ms) and display image contrast within the highly ordered composition of the meniscus. Images from different echo times may also be combined for quantitative T2* calculation (3). UTE imaging has been performed for the native meniscus (4–8) and has delineated the vascular from the avascular zone (3). Recently, Williams et al. performed in vitro and in vivo meniscal UTE-T2* mapping and found elevated values in degenerated menisci, and in patients with anterior cruciate ligament injury who were also diagnosed with meniscal tears (9). A limitation of this study was the use of a qualitative ordinal histologic grading criteria, rather than quantitative, of the tissue samples.
A validated qMRI technique would allow physicians to objectively and quantitatively assess meniscal healing and to provide prognostic information for the patient since a meniscus which is only partially healed may be asymptomatic (10), and a patient may return prematurely to activities that can put the repair at risk. The current poor sensitivity and qualitative nature of meniscal healing evaluation limits the clinical decision about return to activities of daily living and sports.
Direct measures of meniscal healing may be assessed quantitatively by evaluating the mechanical failure strength of the repair site, and by performing microscopic imaging to quantify collagen cross concentration (11) and cross linking (12) at the repair site to for comparison to MRI data. Furthermore, it would be beneficial to evaluate changes of cartilage following meniscal repair in an animal model using MRI, as has been performed in humans (13), as baseline data for future studies. The objectives of this study were: 1) To estimate the correlation of meniscal T2* values with quantitative microscopic imaging and biomechanical testing methods; 2) Determine the effect of meniscal repair on post-operative articular cartilage T2 values. We hypothesized that meniscal T2* values and cartilage T2 values would be prolonged following repair and would approach normal values at an 8 month time point. The objectives were achieved by using an ovine model of meniscal repair since the meniscal collagen structure, cellularity and vascularity are similar to the human meniscus (14).
METHOD
Surgery
This study was approved by the animal care committee at each institution. Twenty eight skeletally mature, and lame free, crossbred mature ewes (mean ± SD weight: 64 ± 8 kg, 4.3±y.o.) were acquired from the Cornell Teaching and Research Center Sheep Farm (Ithaca, NY).
The sheep were tranquilized prior to induction with xylazine hycrocholoride (0.5 mg/kg) and epidural analgesia (0.02 mg/kg morphine and 0.02mg/kg detomidine)was administered. The sheep were also administed a peri-operative antimicrobial (2.2 mg/kg Ceftiofur) every 12 hours for 5 days. Post-operatively, the sheep were administered the analgesic phenylbutazone (4.4 mg/kg for 48 hours, then 2.2 mg/kg every 12 hours for 5 days.
Limbs were randomly assigned to either a meniscal tear and repair (Tear) or unoperated (Non-Op) group prior to surgery. A medial condylotomy procedure was performed to reveal the entire medial meniscus. A vertical, longitudinally oriented tear 15–20 mm in length through the vascular region in the anterior horn was created (Fig. 1). The tear was repaired using two divergent inside-out vertical mattress sutures with 2-0 fiberwire (Arthrex, Inc). The medial femoral condyle was then reduced, and fixation was maintained with cortical screws. A pilot evaluation was performed in 4 animals for the limb contralateral to the tear, in which no operation or a sham operation was performed to determine the effect on meniscal T2* values. Post-operative MRI evaluation at 6 weeks found no significant differences of meniscal T2* values between the limbs. A power calculation was performed using this preliminary data to determine a sample size to compare mean T2* values of non-operative meniscal and menisci with a tear present. The analysis indicated that n=8 samples would detect differences of 1.5 ms with a power of 0.80, with α=0.05.
Figure 1.
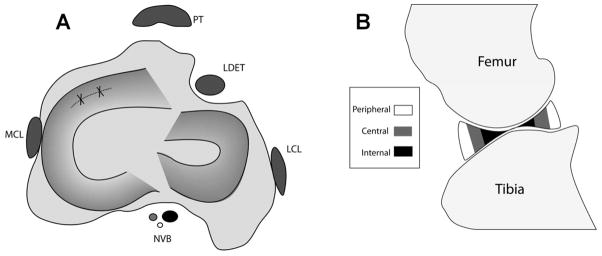
(A) Schematic diagram of the sheep knee in the transverse/axial plane. A tear was created in the anterior horn of the medial meniscus (dashed line), which was then immediately repaired (solid lines). PT – Patellar tendon, MCL – Medial collateral ligament, LCL – Lateral collateral ligament, NVB – Neurovascular bundle, LDET – Long digital extensor tendon. (B) Schematic diagram of the sheep knee in the sagittal plane, displaying sub-regions of analysis for meniscal T2* values. A semi-automated segmentation program divided each meniscal horn into thirds: peripheral (R1), central (R2), and internal (R3) zones for T2* analysis.
The animals were allowed ad lib activity post-operatively, but were initially housed in small pens for 4 months until the condylectomy was healed (15,16), and were then allowed free paddock exercise until euthanasia.
The animals were euthanized with an intravenous overdose of pentobarbital at different time points: immediately post-operative for baseline assessment (Time Zero, n=8), 4 months (n=7), and 8 months (n=8). One sheep at 4 months had significant osteolysis at the site of femoral reduction and was excluded from the study. The time points were chosen based on standard clinical post-surgical examination times for patients undergoing progressive rehabilitation for meniscal repair without a concomitant anterior cruciate ligament or articular cartilage repair procedure. The knee joints were isolated and transported at 4°C immediately prior to MR imaging.
MR Acquisition
Scanning was performed using a 3T clinical scanner and a transmit/receive 8-channel knee coil (GE Healthcare, Waukesha, WI). Two dimensional (2D) fast-spin-echo (FSE) proton-density (PD) scans were acquired in the coronal and sagittal planes to assess morphologic appearance of the knee and meniscus. Acquisition parameters were: echo time (TE) = 24 ms, repetition time (TR) = 4000 ms, echo train length (ETL) = 10–14, field-of-view (FOV)=12 cm, acquisition matrix (AM) = 512×480, receiver bandwidth (RBW) = ±62.5 kHz, number of excitations (NEX) = 2, slice thickness (ST) = 1.3 mm, slice spacing (SS) = 0.0 mm (17). A multi-slice multi-echo ultra-short echo (UTE) sequence was acquired axially and sagittally for meniscal T2* calculations: TEs = 0.3, 6.3, 12.5, 18.7 ms, TR = 350 ms, Flip Angle = 45°, ST = 2 mm, SS = 0.4 mm, FOV = 12 cm, RBW = ±100 kHz, AM = 512×1001, NEX = 2. A 3D CUBE scan (18) was acquired to generate a volumetric dataset for meniscal segmentation: TE = 38 ms, TR = 2000 ms, FOV = 12 cm, AM = 256×256, RBW = ±50 kHz, ST = 0.5 mm, NEX = 1. A multi-slice multi-echo fast spin echo (FSE) technique was acquired for articular cartilage T2 calculations in the sagittal plane: TE = 7.2 ms to 57.9 ms in 7.2 ms steps, TR = 800 ms, ST= 2 mm, SS = 0 mm, FOV = 12 cm, RBW = ±62.5 kHz, AM = 384×256, NEX=2 (19). A 3D T1-weighted fat-suppressed SPGR sequence was acquired to facilitate cartilage segmentation for cartilage T2 calculations: TE = 2.7ms, TR = 13.2ms, FOV = 12cm, flip angle = 10°, ST = 0.7mm, AM = 512×512, RBW = ±62.5kHz, NEX = 2. The total imaging time was 90 minutes per knee.
Microscopy
Following imaging and joint disarticulation, two 4 mm biopsy punches were taken at the edge of the repair site, adjacent to native tissue (Fig. 2). The biopsies were fixed in 4% neutral buffered paraformaldehyde. Multiphoton microscopy (MPM) analysis was performed on the samples (11,20), including second harmonic generation (SHG) and autofluorescence (AF) to evaluate meniscal healing (780 nm excitation with near UV and broad blue emission filters, respectively). The SHG and AF signals yield information about fibrillar collagen concentration (11) and collagen cross linking (12), respectively, and were calculated by normalizing by the squared input power. The SHG images underwent to 2D image autocorrelation to measure image heterogeneity, with high autocorrelation values (ACD) indicating a more heterogeneous structure. The numeric outputs of T2* mapping and multiphoton microscopy were used to provide quantitative validation to previously used subjective scoring systems for meniscal collagen content and orientation based on polarized light microscopy or electron microscopic evaluations (11,14,20).
Figure 2.

Immediately following MR imaging, the menisci were resected from the knees (A). The site of repair is indicated by the arrows which was identified by the location of the non-absorbable suture used in the reparative surgery. Two 4mm biopsy punches (solid circles, 2B) were taken at the edge of the repair site. The repair site (dashed lines, 2B) was isolated and meniscus was sutured to guide pins to facilitate attachment to a materials testing machine (C). A 6mm differential variable reluctance transducer was attached to either side of the tear with metallic barbs to measure displacement across the tear throughout testing.
Biomechanical Testing
A portion of the resected meniscus (Fig. 2) was sutured to 2 guide pins, augmented with cyanoacrylate glue, and attached to a materials testing machine (21). The upper guide pin was fixed to a pin mounted on a ball and socket joint attached to the material tester (Bose ElectroForce, Eden Prairie, MN), to orient the tear perpendicular to the loading direction. The lower pin was attached to the base of the material testing system. A 6 mm differential variable reluctance transducer (Microstrain, Burlington, VT) measured displacement across the tear throughout testing. Loading consisted of: 1) displacement at 10 mm/min to reach a pre-load of 5 N, and held for 5 seconds (preconditioning), 2) sinusoidal loading between 5N and 10N at 1 Hz for 10 cycles to evaluate gap formation at the repair site, 3) tensile test to failure at a displacement rate of 10 mm/min. The failure load was recorded. The tissue samples were kept hydrated during preparation and testing by application of normal saline solution.
MR Morphologic Evaluation
The knees were evaluated using a clinical scoring regimen utilized for meniscal repair (22), which was previously assessed for accuracy (23). Menisci were scored as healed (0 – no fluid signal in the repair, partially healed (1 – fluid signal extending into the repair site but not throughout its thickness), or not healed (2 – fluid signal extending into the repair site and through its thickness).
T2* and T2 Evaluation
The CUBE images were used to define regions of interest (ROIs) on anterior and posterior horns of the medial meniscus for T2* calculations using UTE images. T2* was calculated for each pixel using: SI(TE)=Mo· exp(−TE/T2*)+C, where SI(TE) is the signal intensity at echo time TE, Mo is proportional to proton density, T2* is the inherent time constant, and C is a constant which is proportional to the image noise floor. A semi-automated segmentation program divided each meniscal horn into equal length regions in the anterior/posterior direction: peripheral (R1), central (R2), and internal (R3) zones for sub-region T2* analysis.
The 3D SPGR images were used to define femoral and tibial cartilage ROIs for T2 calculations. The central load bearing region was defined as the area between the posterior edge of the anterior horn and the anterior edge of the posterior horn of the medial meniscus. Limiting the ROI to this area precluded magic angle effects from affecting T2 values, primarily in the distal femur due to its bony curvature. Tibial cartilage was further segmented into anterior and posterior regions. T2 was calculated for each pixel (24) as: SI(TE)=Mo·exp(−TE/T2), where SI(TE) is the signal intensity at echo time TE, Mo is proportional to proton density, T2 is the inherent time constant. Computations were performed using custom software (Mathworks, Natick, MA, USA). Masks used to define the meniscal and cartilage ROIs were evaluated in consensus by a musculoskeletal radiologist with 20 years experience with pre-clinical models, and two biomedical engineers with 13 and 5 years of qMRI analysis, respectively.
Statistical Analysis
Bulk Meniscal T2*
A Spearman rank correlation (ρ) assessed the relationship between the morphologic grading of the joint and the corresponding time point, and between the morphologic grade and corresponding T2* value.
Regional Meniscal T2*
A general estimating equations (GEE) analysis was performed with the factors of: Treatment – Non-Op or Tear Limb, Region – R1, R2, R3, and Time – Time Zero, 4 months, 8 months to detect differences of meniscal T2* across all factors for the anterior and posterior meniscal horns, separately. The means were compared in a pairwise fashion with Z-tests. Multiple comparison testing was accounted for by controlling the false discovery rate.
Cartilage T2
A GEE analyses were performed for femoral and tibial cartilages with the factors of Treatment, Time, and Region (Anterior and Posterior for the tibial cartilage only) to detect differences of calculated T2 values. The means were compared in a pairwise fashion with Z-tests. Multiple comparison testing was accounted for by controlling the false discovery rate.
Mechanical Testing
A non-parametric Wilcoxon rank sum test t-test was performed to detect differences of failure load, and formation of gap between the tear and non-operative limb. Spearman rank correlation assessed the relationship between anterior bulk T2* values and corresponding failure load. Statistical tests were performed as 2-sided evaluations.
Multiphoton Microscopy
A non-parametric Wilcoxon rank sum test was performed to detect differences of MPM variables (SHG, AF, ACD) between the Tear and Non-Op limbs. Spearman rank correlations were also performed between the different MPM variables and corresponding bulk average T2* value of the anterior horn. Statistical tests were performed as 2-sided evaluations.
Appropriate post-hoc Student-Neuman-Keuls (SNK) tests were performed when statistical significance was found. Significance was set at p< 0.05, with α = 0.05. Statistical tests were performed as 2-sided evaluations. Statistical analyses were performed using SAS 9.3 (Cary, NC, USA)
RESULTS
Results are presented as mean ± SD, and the 95% confidence interval of the mean. Two to three MRI slices for T2 and T2* calculation were available at each time point for each sheep. Twelve knees at 4 months and 16 knees at 8 months had mechanical testing data available.
MR Data
Bulk Meniscal T2* Data
A positive correlation was found between bulk anterior T2* values with the corresponding morphologic meniscal grade (ρ=0.63, 95% CI: 0.18 to 0.85, p=0.0085) at 8 months. A positive correlation was found between morphologic meniscal grade with the corresponding time point (ρ=0.31, 95% CI: 0.03 to 0.54, p=0.03).
Anterior Regional Meniscus T2*
A difference of T2* was found, p<0.0069, between Tear (3.7 ± 1.6 ms, 95%CI: 3.4 to 3.9 ms) and Non-Op limbs (2.9 ± 0.5 ms 95%CI: 2.8 to 3.0 ms, Fig 3). Tear limbs had prolonged T2* and greater T2* variability than the Non-Op limbs. Similar T2* values were found across all time points for the Tear limb. Shorter T2* values, p=0.0137, were found in the Non-Op limb at 4 months, 2.7 ± 0.5 ms (95%CI: 2.6 to 2.8 ms), as compared to 8 months, 3.0 ± 0.4 ms (95%CI: 2.9 to 3.1 ms). No regional differences of T2* were detected for either the Tear or Non-Op limbs.
Figure 3.
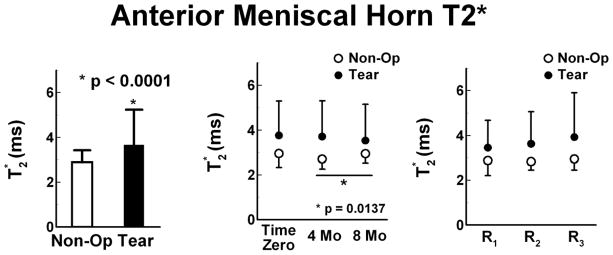
Anterior meniscal horn T2* values (mean ± SD) of the Non-Op and Tear limbs. Left – Tear limbs as compared to Non-Op limbs. Center - Similar T2* values were found across all time points for the Tear limb, but significantly shorter T2* values were found in the Non-Op limb at 4 months as compared to 8 months. Right - No regional differences of T2* were detected for either the Tear or Non-Op limbs in the anterior horn from the peripherally (R1) to the central (R2) or internal (R3) regions..
Posterior Regional Meniscus T2*
No difference of T2* was found between the Tear, 3.0 ± 0.9 ms (95%CI: 2.8 to 3.1 ms), and Non-Op limbs, 2.8 ± 0.8 ms (95%CI: 2.7 to 2.9 ms). T2* values of Tear limbs tended to reduce over time with 8 months, 2.6 ± 0.7 ms (95%CI: 2.4 to 2.8 ms), shorter than Time Zero, 3.3 ± 0.9 ms (95%CI: 3.1 to 3.5 ms), and 4 months, 3.1 ± 1.0 ms (95%CI: 2.8 to 3.3 ms). In the Non-Op limb, T2* at 4 months, 3.0 ± 1.3 ms (95%CI: 2.7 to 3.3 ms), tended to be longer than Time Zero, 2.7 ± 0.5 ms (95%CI: 2.6 to 2.8 ms), and 8 months, 2.7 ± 0.6 ms (95%CI: 2.6 to 2.9 ms). The peripheral region of the Tear and Non-Op limbs had T2* values ~17% and ~12% greater than the central and internal regions, respectively, p<0.02.
Femoral Cartilage T2
Overall differences of T2 were not found between Tear limbs and Non-Op limbs, 36.2 ± 8.8 ms (95%CI: 33.5 to 39.0 ms) and 32.8 ± 5.2 ms (95%CI: 31.5 to 34.2), respectively (Fig. 5). The Non-Op limbs maintained T2 at the different time points during the study. The Tear limbs had elevated T2 (p<0.0001) at 4 months, 45.3 ± 7.4 ms (95%CI: 40.6 to 49.9 ms), as compared to the Time Zero, 31.6 ± 5.9 ms (95%CI: 28.8 to 34.4 ms), and 8 months, 34.3 ± 7.2 ms (95%CI: 29.5 to 39.2). T2 at 8 months was similar to Time Zero.
Figure 5.
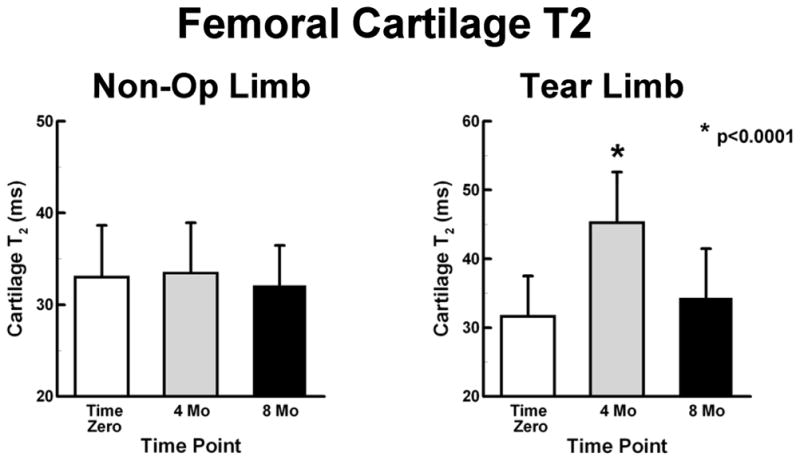
Femoral cartilage T2 values (mean ± SD) of the Non-Op and Tear limbs. Left - Non-Op limbs maintained T2 values at the different time points during the study. Right - Tear limbs had elevated T2 values at 4 months.
Tibial Cartilage T2
A difference in T2 was found between the Tear limbs and the Non-Op limbs, 37.9 ± 9.9 ms (95%CI: 35.7 to 40.0) and 33.2 ± 7.3 ms (95%CI: 31.9 to 34.5 ms) (p<0.0057, Fig. 6). The Non-Op limbs had prolonged T2 at Time Zero, 36.6 ± 7.9 ms (95%CI: 34.5 to 38.7 ms), as compared to T2 at 4 months, 31.2 ± 5.0 ms (95%CI: 29.3 to 33.2 ms), and 8 months, 28.8 ± 4.3 ms (95%CI: 27.3 to 30.4), p<0.0006. No differences were detected in T2 between the anterior and posterior ROIs. The Tear limbs had longer, p=0.005, T2 anteriorly, 41.5 ± 11.1 ms (95%CI: 38.1 to 44.9 ms), than posteriorly, 34.2 ± 7.0 ms (95%CI: 23.1 to 36.4). Anterior T2 values in Tear limbs tended to increase from time of surgery.
Figure 6.
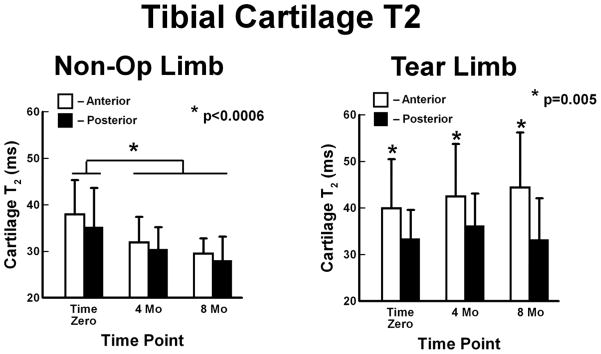
Tibial cartilage T2 values (mean ± SD) of the Non-Op and Tear limbs. Left - Non-Op limbs had prolonged T2 values at Time Zero. Right - Tear limbs had prolonged T2 values anteriorly which tended to increase over time.
Mechanical Data
There was no difference of the failure load between Tear and Non-Op groups at 4 months. Tear limbs tended to have lower load at failure at 8 months but was not significant. When samples were pooled together into Tear or Non-Op across the two time points, the failure load in the Tear group was lower than that in the Non-Op group, p=0.035 (Fig. 7). Similarly, no difference of tissue micromotion was found at 4 or 8 months, or when the time points were combined. Micromotion of Non-Op limbs (0.074 ± 0.067 μm, 95%CI: 0.029 to 0.118 μm) was less than that of Tear limbs (0.133 ± 0.076 μm, 95%CI: 0.079 to 0.188 μm). A correlation was detected between the bulk T2* value and the corresponding failure load only for the 4 month Non-Op limbs, ρ=−0.76 (95%CI: −0.95 to 0.04), p=0.045.
Figure 7.
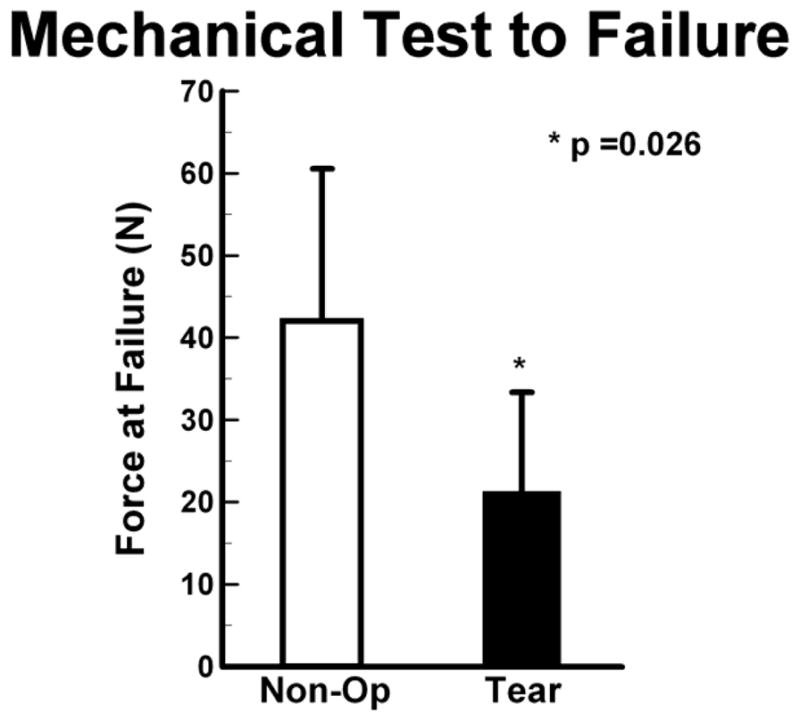
The maximum load at failure (mean ± SD) for Tear limbs was significantly less than Non- Op limbs when data from the 4Mo limbs were grouped with the 8Mo limbs.
Multiphoton Microscopy
AF was higher in Non-Op than Tear limbs, p<0.0001 (Fig. 8). In the Non-Op limbs, AF at 8 months was lower than at Time Zero and at 4 months, p<0.0001. Similarly in the Tear limbs, AF was the lowest at 8 months, p<0.0001. AF correlated moderately, but insignificantly, with anterior bulk T2* values at 8 months (ρ=−0.48, p=0.06).
Figure 8.
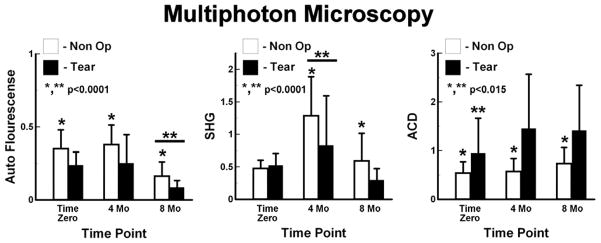
Quantitative multiphoton microscopy. Left – Autoflourescence was larger in Non-Op limbs than Tear Limbs, and was lowest at 8 Mo. Center – Second Harmonic Generation (SHG) was higher in Non-Op limbs than Tear limbs. The largest SHG was at 4 Mo. Right - Auto-Correlation (ACD) higher for Tear limbs than for Non-Op limbs. Tear limbs had the lowest ACD at Time Zero.
Overall, SHG was higher in Non-Op limbs than Tear limbs, p<0.0001. Non-Op limbs had largest SHG at 4 months, p<0.0001, and the SHG measurements at Time Zero and 8 months were similar. Tear limbs had the largest SHG measurements at 4 monthsthan at Time Zero, and Time Zero SHG measurements were larger than at 8 months, p<0.0001. SHG correlated moderately but insignificantly with anterior bulk T2* values at 8 months (ρ=−0.49, p=0.06).
ACD was higher for Tear limbs than for Non-Op limbs, p<0.0001. Non-Op limbs had larger ACD at 8 months than at Time Zero and 4 months, which were similar to each other, p=0.0042. Tear limbs had the lowest ACD at Time Zero, p=0.014, and ACD at 4 and 8 months were similar.
DISCUSSION
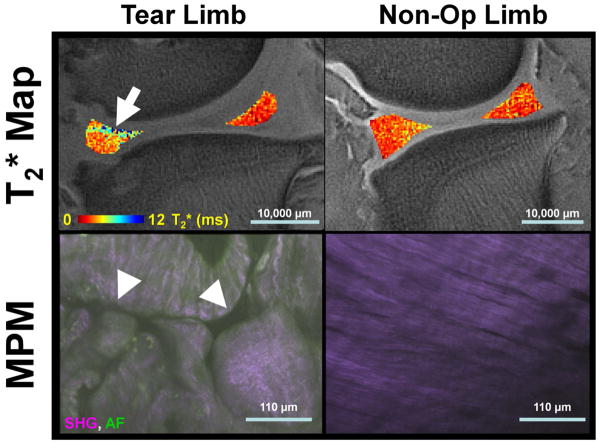
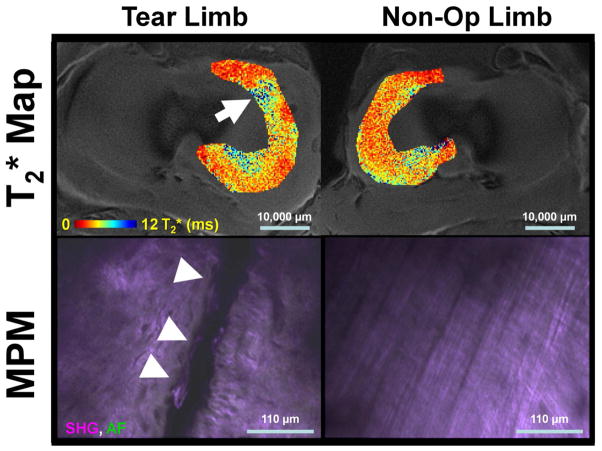
This study evaluated the qMRI technique of T2* mapping as a biomarker of meniscal integrity with corresponding quantitative histological measures of meniscal repair (Figs. 9 and 10).
Figure 9.
Representative sagittal medial meniscal T2* maps and corresponding fused second harmonic generation (SHG) and autofluorescence (AF) multiphoton microscopy (MPM) image data. Tear limbs had focal increases in T2* (arrow) and disrupted collagen fibers in MPM imaging (arrow heads). Non-Op limbs had reduced heterogeneity of T2* and highly ordered collagen structure in the MPM images. Scale bars are given for the T2* maps and MPM images.
Figure 10.
Representative axial medial meniscal T2* maps and corresponding fused second harmonic generation (SHG) and autofluorescence (AF) multiphoton microscopy (MPM) image data. Tear limbs had heterogeneous T2* maps (arrow) and frank tears on MPM (arrow heads). Non-Op limbs had T2* maps of lower magnitude and an overall ordered collagen structure in the MPM images. Scale bars are given for the T2* maps and MPM images.
T2* mapping detected temporal and zonal differences of meniscal repair. In the operative horn, prolonged T2* values indicated limited healing at 8 months, and T2* homogeneity found from the peripheral to internal zones, contrary to what is seen in the normal meniscus (3), further indicates limited healing at the repair site. Changes of T2* found in the posterior horns of both the Tear and Non-Op limbs may be attributed to an altered joint loading pattern resulting from the surgery performed on the contralateral limb. The elevation of posterior horn T2* values in the Non-Op limb at 4 months, indicates that changes occur within the meniscal matrix and that the limb may not be considered as a “normal” control for the operative limb. Even with the elevated T2* values, the vascular portion had the longest T2* values, similar to the human meniscus (3).
Mechanical testing indicated limited healing of tears at 8 months, and overall reduced failure load for the Tear limbs. In addition, the only correlation between meniscal T2* values and the corresponding mechanical testing data was found at 4 months. We attribute these counterintuitive findings to type of created tear and the required method of mechanical testing. The tear was created by incising the meniscus from the superior view point. When examining the meniscus ex vivo, it was determined that the full width of the tear was not evident on the inferior surface of 8 menisci, denoting the potential occurrence of tears with a non-uniform width through the tissue depth. Great care was taken during surgery to limit damage to the tibial cartilage since laceration injuries promote degeneration (25). Furthermore, the mechanical testing of a circumferential tear required a more complex testing procedure, one which differs from a traditional “dog bone” shaped sample (26,27). Therefore, while the tears resulted in prolongation of T2* values and reduction in the load at failure of the tissue, the variability of the tears and the complexity of the mechanical testing lead to a lack of consistent correlation from being found.
The MPM analysis provides a quantitative assessment of the collagen concentration (SHG), crosslinking (AF), and overall organization (ACD) of the limbs over the different time points. The AF measurement was minimal at 8 months, and the SHG measurement was maximal for the Non-Op and Tear limbs at 4 months. In addition, the Tear group tended to have reduced AF and SHG values when compared to the Non-Op group. These results indicate increased aligned collagen at the repair site at 4 months, which may have subsided at 8 months. The increase of aligned collagen in the Non-Op limbs indicates a modification of tissue as the result of potential altered gait due to the imposed tear. ACD values also demonstrated greater disorganization of the anterior horn in Tear limbs. Note that the MPM method interrogates specimens at the single fibril level. A direct comparison of MPM images with MRI images is difficult due to the size of the acquired images. The coverage of an entire MPM image was similar that of a single pixel in the MRI scans. Although the MPM images were acquired at numerous sampling locations and depths around the tear/repair site, and attempts were made to match the location of the UTE and MPM data, the difference in resolution between the two may introduce errors into the resulting correlation analysis. Additional data points may be necessary to detect significant correlations.
Changes of cartilage T2 were seen for both the femur and tibia. The T2 values of the tibial anterior and posterior ROIs in the Non-Op were similar and decreased over time, while differences of T2 were found between the regions at each time point for the Tear limb. The prolongation of T2 in the anterior portion of the joint indicates degeneration of the cartilage based on studies which have correlated increase of cartilage T2 values with greater disorganization of the collagen indicative of the onset of osteoarthritis (28). The prolongation of T2 in the anterior ROI corresponds well to the known anterior loading pattern in the sheep knee (29,30). The source of elevated femoral T2 values at 4 months in the Tear limb is unclear. Histological evaluation of the cartilage was not available in the current study to evaluate structural changes in the tissue. We speculate that the increase of T2 is due to the influx of water during the onset of OA, which then subsided, similar to previous reports of an increase of cartilage thickness during the onset of OA followed by reduction with the advance of OA (31,32).
This study had several limitations. First, we evaluated changes of T2* following repair of a circumferential tear. This type of tear was chosen to facilitate surgical repair and maximize the potential for healing. Second, 4 echo images were acquired to calculate T2* values. Previous investigators have acquired more echoes for analyzing short T2 tissues (9,33,34). The prolonged scan time prevented additional image datasets from being acquired. Third, this was a cross-sectional study with imaging data acquired post-mortem. The limbs were kept at 4°C prior to scanning to minimize degeneration of the soft tissues within the knee. Finally, it is unclear what the effect of the surgical technique of condylotomy may be on meniscal T2* and cartilage T2 values.
In conclusion, this study confirms that T2* mapping is sensitive to temporal and zonal differences of meniscal repair in the ovine model, and MPM and cartilage T2 values indicate changes of tissue integrity following meniscal repair. The changes of T2* and MPM values in the Non-Op limb indicate that the contralateral limb should not be considered a “normal” control. The correlation of MPM with T2* supports UTE as a non-invasive quantitative measure of meniscal integrity.
Figure 4.
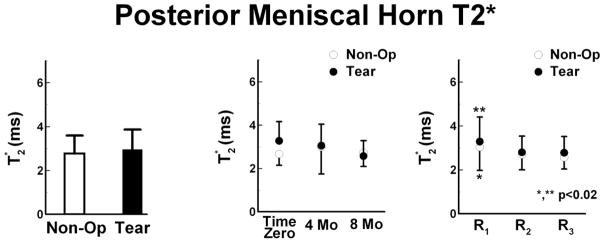
Posterior meniscal horn T2* values (mean ± SD) of the Non-Op and Tear limbs. Left – Tear limbs had similar T2* values as compared to Non-Op limbs. Center – T2* values of Tear limbs reduced over time, from Time Zero to 4 months to 8 months. For the Non-Op limb, the average T2* value at 4 Mo tended to be prolonged when compared to Time Zero and 8 Mo. Right - The peripheral region (R1) of Tear and Non-Op limbs had prolonged T2* values as compared to the central (R2) and internal (R3) regions.
Acknowledgments
Arthrex, Inc., Naples, FL, generously donated the fiberwire used in this study. The authors thank Kara Fields and Dr. Stephen Lyman for their assistance with the statistical analysis portion of this study.
ROLE OF THE FUNDING SOURCE
Research reported in this publication was supported by the National Institute of Arthritis and Musculoskeletal and Skin Diseases of the National Institutes of Health under Award Number RC1-AR058255. The content is solely the responsibility of the authors and does not necessarily represent the official views of the National Institutes of Health.
A research agreement is in place between the Hospital for Special Surgery and General Electric Healthcare. General Electric Healthcare had no role in the study design, collection, analysis and interpretation of data; in the writing of the manuscript; and in the decision to submit the manuscript for publication
Footnotes
COMPETING INTEREST STATEMENT
Matthew Koff, Parina Shah, Sarah Pownder, and Hollis Potter – Institutional research agreement is in place with General Electric Healthcare.
AUTHOR CONTRIBUTIONS
Matthew F. Koff - Conception and design, Analysis and interpretation of the data, Drafting of the article, Critical revision of the article for important intellectual content, Final approval of the article, Statistical expertise, Obtaining of funding, Administrative, technical, and logistic support, Collection and assembly of data.
Parina Shah - Analysis and interpretation of the data, Critical revision of the article for important intellectual content, Final approval of the article.
Sarah Pownder - Analysis and interpretation of the data, Critical revision of the article for important intellectual content, Final approval of the article.
Bethsabe Romero – Collection, analysis and interpretation of the data, Critical revision of the article for important intellectual content, Final approval of the article.
Rebecca Williams - Conception and design, Technical Support, Analysis and interpretation of the data, Critical revision of the article for important intellectual content, Final approval of the article.
Susannah Gilbert - Analysis and interpretation of the data, Critical revision of the article for important intellectual content, Final approval of the article.
Suzanne Maher - Conception and design, Analysis and interpretation of the data, Critical revision of the article for important intellectual content, Final approval of the article, Statistical expertise, Obtaining of funding, Administrative and technical support, Collection and assembly of data.
Lisa A. Fortier - Conception and design, Provision of study materials or patients, Analysis and interpretation of the data, Critical revision of the article for important intellectual content, Final approval of the article, Statistical expertise, Obtaining of funding, Administrative and technical support, Collection and assembly of data, Statistical Expertise.
Scott A. Rodeo - Conception and design, Analysis and interpretation of the data, Critical revision of the article for important intellectual content, Final approval of the article, Statistical expertise, Obtaining of funding, Administrative and technical support, Collection and assembly of data.
Hollis G. Potter – Conception and design, Analysis and interpretation of the data, Drafting of the article, Critical revision of the article for important intellectual content, Final approval of the article, Obtaining of funding, Administrative, technical, and logistic support.
Publisher's Disclaimer: This is a PDF file of an unedited manuscript that has been accepted for publication. As a service to our customers we are providing this early version of the manuscript. The manuscript will undergo copyediting, typesetting, and review of the resulting proof before it is published in its final citable form. Please note that during the production process errors may be discovered which could affect the content, and all legal disclaimers that apply to the journal pertain.
References
- 1.Zarins ZA, Bolbos RI, Pialat JB, Link TM, Li X, Souza RB, et al. Cartilage and meniscus assessment using T1rho and T2 measurements in healthy subjects and patients with osteoarthritis. Osteoarthritis Cartilage. 2010;1811:1408–1416. doi: 10.1016/j.joca.2010.07.012. [DOI] [PMC free article] [PubMed] [Google Scholar]
- 2.Rauscher I, Stahl R, Cheng J, Li X, Huber MB, Luke A, et al. Meniscal measurements of T1rho and T2 at MR imaging in healthy subjects and patients with osteoarthritis. Radiology. 2008;2492:591–600. doi: 10.1148/radiol.2492071870. [DOI] [PMC free article] [PubMed] [Google Scholar]
- 3.Gatehouse PD, He T, Puri BK, Thomas RD, Resnick D, Bydder GM. Contrast-enhanced MRI of the menisci of the knee using ultrashort echo time (UTE) pulse sequences: imaging of the red and white zones. Br J Radiol. 2004;77920:641–647. doi: 10.1259/bjr/31774546. [DOI] [PubMed] [Google Scholar]
- 4.Du J, Carl M, Diaz E, Takahashi A, Han E, Szeverenyi NM, et al. Ultrashort TE T1rho (UTE T1rho) imaging of the Achilles tendon and meniscus. Magn Reson Med. 2010;643:834–842. doi: 10.1002/mrm.22474. [DOI] [PubMed] [Google Scholar]
- 5.Robson MD, Bydder GM. Clinical ultrashort echo time imaging of bone and other connective tissues. NMR Biomed. 2006;197:765–780. doi: 10.1002/nbm.1100. [DOI] [PubMed] [Google Scholar]
- 6.Robson MD, Gatehouse PD, So PW, Bell JD, Bydder GM. Contrast enhancement of short T2 tissues using ultrashort TE (UTE) pulse sequences. Clin Radiol. 2004;598:720–726. doi: 10.1016/j.crad.2003.09.025. [DOI] [PubMed] [Google Scholar]
- 7.Gold GE, Pauly JM, Macovski A, Herfkens RJ. MR spectroscopic imaging of collagen: tendons and knee menisci. Magn Reson Med. 1995;345:647–654. doi: 10.1002/mrm.1910340502. [DOI] [PubMed] [Google Scholar]
- 8.Gatehouse PD, Thomas RW, Robson MD, Hamilton G, Herlihy AH, Bydder GM. Magnetic resonance imaging of the knee with ultrashort TE pulse sequences. Magn Reson Imaging. 2004;228:1061–1067. doi: 10.1016/j.mri.2004.08.018. [DOI] [PubMed] [Google Scholar]
- 9.Williams A, Qian Y, Golla S, Chu CR. UTE-T2 * mapping detects sub-clinical meniscus injury after anterior cruciate ligament tear. Osteoarthritis Cartilage. 2012;206:486–494. doi: 10.1016/j.joca.2012.01.009. [DOI] [PMC free article] [PubMed] [Google Scholar]
- 10.Steenbrugge F, Verstraete K, Verdonk R. Magnetic resonance imaging of the surgically repaired meniscus: a 13-year follow-up study of 13 knees. Acta Orthop Scand. 2004;753:323–327. doi: 10.1080/00016470410001268. [DOI] [PubMed] [Google Scholar]
- 11.Zipfel WR, Williams RM, Christie R, Nikitin AY, Hyman BT, Webb WW. Live tissue intrinsic emission microscopy using multiphoton-excited native fluorescence and second harmonic generation. Proc Natl Acad Sci U S A. 2003;10012:7075–7080. doi: 10.1073/pnas.0832308100. [DOI] [PMC free article] [PubMed] [Google Scholar]
- 12.Hwang YJ, Granelli J, Lyubovitsky JG. Multiphoton optical image guided spectroscopy method for characterization of collagen-based materials modified by glycation. Anal Chem. 2011;831:200–206. doi: 10.1021/ac102235g. [DOI] [PMC free article] [PubMed] [Google Scholar]
- 13.Friedrich KM, Shepard T, de Oliveira VS, Wang L, Babb JS, Schweitzer M, et al. T2 measurements of cartilage in osteoarthritis patients with meniscal tears. AJR Am J Roentgenol. 2009;1935:W411–415. doi: 10.2214/AJR.08.2256. [DOI] [PMC free article] [PubMed] [Google Scholar]
- 14.Chevrier A, Nelea M, Hurtig MB, Hoemann CD, Buschmann MD. Meniscus structure in human, sheep, and rabbit for animal models of meniscus repair. J Orthop Res. 2009 doi: 10.1002/jor.20869. [DOI] [PubMed] [Google Scholar]
- 15.Brindle T, Nyland J, Johnson DL. The Meniscus: Review of Basic Principles With Application to Surgery and Rehabilitation. J Athl Train. 2001;362:160–169. [PMC free article] [PubMed] [Google Scholar]
- 16.Turman KA, Diduch DR. Meniscal repair: indications and techniques. J Knee Surg. 2008;212:154–162. doi: 10.1055/s-0030-1247812. [DOI] [PubMed] [Google Scholar]
- 17.Kelly BT, Robertson W, Potter HG, Deng XH, Turner AS, Lyman S, et al. Hydrogel meniscal replacement in the sheep knee: preliminary evaluation of chondroprotective effects. Am J Sports Med. 2007;351:43–52. doi: 10.1177/0363546506292848. [DOI] [PubMed] [Google Scholar]
- 18.Gold GE, Busse RF, Beehler C, Han E, Brau AC, Beatty PJ, et al. Isotropic MRI of the knee with 3D fast spin-echo extended echo-train acquisition (XETA): initial experience. AJR Am J Roentgenol. 2007;1885:1287–1293. doi: 10.2214/AJR.06.1208. [DOI] [PubMed] [Google Scholar]
- 19.Maier CF, Tan SG, Hariharan H, Potter HG. T2 quantitation of articular cartilage at 1. 5 T. J Magn Reson Imaging. 2003;173:358–364. doi: 10.1002/jmri.10263. [DOI] [PubMed] [Google Scholar]
- 20.Williams RM, Zipfel WR, Webb WW. Multiphoton microscopy in biological research. Curr Opin Chem Biol. 2001;55:603–608. doi: 10.1016/s1367-5931(00)00241-6. [DOI] [PubMed] [Google Scholar]
- 21.McDermott ID, Richards SW, Hallam P, Tavares S, Lavelle JR, Amis AA. A biomechanical study of four different meniscal repair systems, comparing pull-out strengths and gapping under cyclic loading. Knee Surg Sports Traumatol Arthrosc. 2003;111:23–29. doi: 10.1007/s00167-002-0324-9. [DOI] [PubMed] [Google Scholar]
- 22.van Trommel MF, Simonian PT, Potter HG, Wickiewicz TL. Different regional healing rates with the outside-in technique for meniscal repair. Am J Sports Med. 1998;263:446–452. doi: 10.1177/03635465980260031901. [DOI] [PubMed] [Google Scholar]
- 23.van Trommel MF, Potter HG, Ernberg LA, Simonian PT, Wickiewicz TL. The use of noncontrast magnetic resonance imaging in evaluating meniscal repair: comparison with conventional arthrography. Arthroscopy. 1998;141:2–8. doi: 10.1016/s0749-8063(98)70113-6. [DOI] [PubMed] [Google Scholar]
- 24.Koff MF, Amrami KK, Felmlee JP, Kaufman KR. Bias of cartilage T(2) values related to method of calculation. Magn Reson Imaging. 2008;269:1236–1243. doi: 10.1016/j.mri.2008.03.002. [DOI] [PMC free article] [PubMed] [Google Scholar]
- 25.Palmoski MJ, Brandt KD. Proteoglycan aggregation in injured articular cartilage. A comparison of healing lacerated cartilage with osteoarthritic cartilage. J Rheumatol. 1982;92:189–197. [PubMed] [Google Scholar]
- 26.Huey DJ, Athanasiou KA. Tension-compression loading with chemical stimulation results in additive increases to functional properties of anatomic meniscal constructs. PLoS One. 2011;611:e27857. doi: 10.1371/journal.pone.0027857. [DOI] [PMC free article] [PubMed] [Google Scholar]
- 27.Bursac P, York A, Kuznia P, Brown LM, Arnoczky SP. Influence of donor age on the biomechanical and biochemical properties of human meniscal allografts. Am J Sports Med. 2009;375:884–889. doi: 10.1177/0363546508330140. [DOI] [PubMed] [Google Scholar]
- 28.Dunn TC, Lu Y, Jin H, Ries MD, Majumdar S. T2 relaxation time of cartilage at MR imaging: comparison with severity of knee osteoarthritis. Radiology. 2004;2322:592–598. doi: 10.1148/radiol.2322030976. [DOI] [PMC free article] [PubMed] [Google Scholar]
- 29.Taylor WR, Poepplau BM, Konig C, Ehrig RM, Zachow S, Duda GN, et al. The medial-lateral force distribution in the ovine stifle joint during walking. J Orthop Res. 2011;294:567–571. doi: 10.1002/jor.21254. [DOI] [PubMed] [Google Scholar]
- 30.Tapper JE, Fukushima S, Azuma H, Thornton GM, Ronsky JL, Shrive NG, et al. Dynamic in vivo kinematics of the intact ovine stifle joint. J Orthop Res. 2006;244:782–792. doi: 10.1002/jor.20051. [DOI] [PubMed] [Google Scholar]
- 31.Buck RJ, Wirth W, Dreher D, Nevitt M, Eckstein F. Frequency and spatial distribution of cartilage thickness change in knee osteoarthritis and its relation to clinical and radiographic covariates - data from the osteoarthritis initiative. Osteoarthritis Cartilage. 2013;211:102–109. doi: 10.1016/j.joca.2012.10.010. [DOI] [PubMed] [Google Scholar]
- 32.Frobell RB. Change in cartilage thickness, posttraumatic bone marrow lesions, and joint fluid volumes after acute ACL disruption: a two-year prospective MRI study of sixty-one subjects. J Bone Joint Surg Am. 2011;9312:1096–1103. doi: 10.2106/JBJS.J.00929. [DOI] [PubMed] [Google Scholar]
- 33.Pauli C, Bae WC, Lee M, Lotz M, Bydder GM, D’Lima DL, et al. Ultrashort-echo time MR imaging of the patella with bicomponent analysis: correlation with histopathologic and polarized light microscopic findings. Radiology. 2012;2642:484–493. doi: 10.1148/radiol.12111883. [DOI] [PMC free article] [PubMed] [Google Scholar]
- 34.Bae WC, Chen PC, Chung CB, Masuda K, D’Lima D, Du J. Quantitative ultrashort echo time (UTE) MRI of human cortical bone: correlation with porosity and biomechanical properties. J Bone Miner Res. 2012;274:848–857. doi: 10.1002/jbmr.1535. [DOI] [PMC free article] [PubMed] [Google Scholar]


