Abstract
The druggable subset of the human genome, termed the “druggable genome,” provides the pharmaceutical industry with a unique opportunity for the advancement of new therapeutic interventions for a multitude of diseases and disorders. To date, there is no systematic assessment of the evolutionary history and nature of the defined druggable proteins derived from the contemporary druggable genome (i.e., proteins that bind or are predicted to bind with high affinity to a biologic). An understanding of drug–protein target interactions in specific cellular compartments is crucial for the optimal therapeutic delivery of pharmaceutical agents, as well as for preclinical drug trials in model animals. This study applied the concept of pharmacophylogenomics, the study of genes, evolution, and drug targets, to conduct an evolutionary survey of drug targets with respect to their subcellular localizations. Using multiple models and modes of druggable genome comparison, the results concordantly indicated that orthologous drug targets with a nuclear localization in the human, macaque, mouse, and rat showed a higher trend for evolutionary conservation compared with drug targets in the cell membrane and the extracellular compartment. As such, this study provides important information regarding druggable protein targets and the druggable genome at the pharmacophylogenomics level.
Keywords: druggable genome, drug targets, Ka/Ks ratio, pharmacophylogenomics, subcellular localization
Introduction
Technical and conceptual advances in the genomic sciences, synthetic and combinatorial chemistry, high-throughput sequencing, virtual (computer-aided) screening, pharmacophore modeling, cell-based assays, and automated high-throughput RNA interference screening have all guided investigators toward a “new” ideology of drug and drug-target discovery (Steindl et al. 2006; Koppen 2009; Zuber et al. 2011). This has led to the emergence of the druggable genome (Hopkins and Groom 2002; Russ and Lampel 2005), where a subset of proteins and/or isoforms encoded from approximately 20,000 protein-coding genes in the human genome is targeted by drugs. Statistical analyses have indicated that druggable protein targets are mainly categorized into four groups according to their biochemical properties: enzymes, receptors, transporters, and ion channels, where enzymes and G-protein-coupled receptors (GPCRs) account for nearly 80% of all drug targets (Overington et al. 2006).
With respect to their therapeutic targets, drugs often bind to proteins that are highly expressed in or associated with disease states. For example, GPCRs currently make up the largest known family of drug-targeting proteins (Hopkins and Groom 2002), and the diverse members of the GPCR family are linked to a number of pathological disorders (Smit et al. 2007). Moreover, the minimum shortest distances between drug targets and disease-gene products were revealed from the aspect of disease network and drug targets (Yildirim et al. 2007).
Phylogenomics provides an evolutionary view of genomic data and has been widely and successfully used for the prediction of coding and noncoding elements in a variety of genes (Eisen and Fraser 2003; Delsuc et al. 2005; Rannala and Yang 2008). These predictions are primarily based on sequence homology and conservation across species (Delsuc et al. 2005). By analogy, pharmacophylogenomics (Searls 2003), or the study of the evolutionary history and nature of drug targets, views the druggable genome in terms of phylogeny. The subcellular targeting strategy for drug design and delivery suggests that the ideal drug-target interaction for maximal therapeutic efficacy should take place in specific subcellular sites (Rajendran et al. 2010). Therefore, we adopted the concept of pharmacophylogenomics (Searls 2003) to present a comprehensive evolutionary analysis of 1,362 orthologous drug targets with respect to their subcellular compartments in a variety of mammalian species: the human, macaque, mouse, and rat.
Materials and Methods
Data
All annotated coding sequences (CDSs) and their corresponding protein products were downloaded from the Ensembl (Release 56) database (Hubbard et al. 2009). To keep uniqueness, only those genes with the longest CDSs were retained and used for further study.
Drug-Target Orthologs
Druggable human protein target orthologs (1,632 in total) were downloaded from the DrugBank (v2.5) database (Wishart et al. 2008). Here, a similar method to that previously employed for the identification of macaque drug target orthologs (Fang et al. 2011) was used. Briefly, canonically reciprocal best-to-best hits (as implemented in the BlastP program with default parameters) were considered to be 1:1 orthologs (human:macaque, human:mouse, and human:rat). To reduce the false discovery rate resulting from incorrect and/or incomplete gene annotation, effective aligned lengths of less than 80% of the query length were filtered out. Finally, 1,362 genes in total belonging to an orthologous quartet (derived from the human, macaque, mouse, and rat genome) were identified.
Evolutionary Analysis of Druggable Target Orthologs
The phylogenetic analysis by maximum likelihood (PAML) toolkit software package (Zhang et al. 2005) was employed to analyze the evolution rate of druggable target orthologs. First, a multiple sequence alignment of both proteins and CDSs was carried out by using the MUSCLE program (Edgar 2004). Next, a custom Perl script was compiled to transform the data into the format required for application of the PAML software. To achieve an unbiased analysis, two models (a basic model and a branch model) were separately implemented in the codeml program of the PAML package. These models were used to compute the Ka/Ks ratio to determine the rate of evolution of the drug-target orthologs, where the parameters for the basic model and the branch model were as follows: model = 0, NSsites = 0, F3 × 4, runmode = −2, and model = 1, NSsites = 0, F3 × 4, respectively.
Based on gene ontology annotation (Ashburner et al. 2000), all 1,362 orthologous drug targets were classified into six categories according to subcellular localization (nucleus, cytoplasm, organelle, cell membrane, extracellular, and unknown). For each subcellular category, the mean Ka/Ks ratio was calculated and compared among categories. The statistical significance of the evolution rate between any two categories was tested by using the Kolmogorov–Smirnov (KS) test or the Wilcoxon rank-sum test. To test the significance, we conducted similar analysis from a total of 10,145 protein-coding orthologs to calculate the Ka/Ks ratio as genome-wide background and comparison with druggable target orthologs. Finally, akin to the above evolutionary analysis for human, macaque, mouse, and rat orthologs, a similar analysis was performed for primate orthologs (human, chimpanzee, and macaque).
Statistics
A series of in-house Perl scripts were compiled for data analysis. R programming language (version 2.11.1, http://www.R-project.org, last accessed June 20, 2013) was used to conduct statistical analyses and plotting.
Results
On the basis of a total of 1,632 human druggable protein targets (DrugBank, v2.5), we effectively identified 1,362 1:1:1:1 orthologs (human, macaque, mouse, and rat, supplementary table S1, Supplementary Material online), as shown in figure 1.
Fig. 1.—
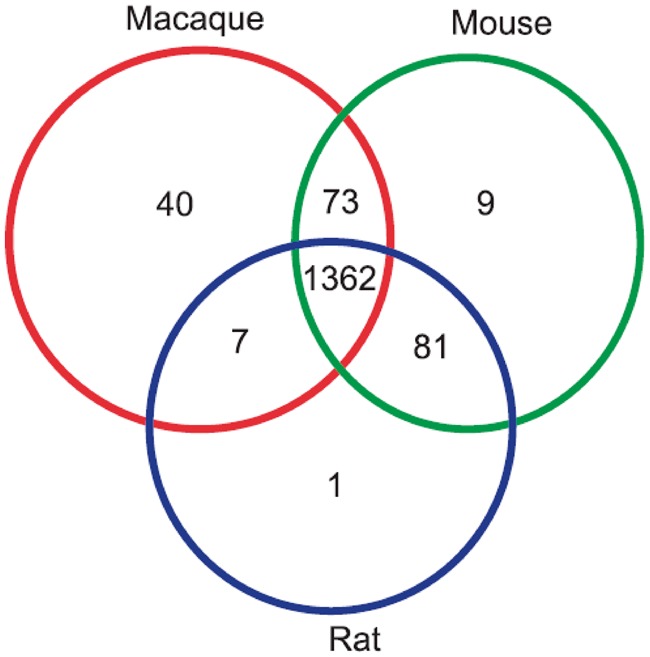
Venn diagram of 1,632 human druggable protein targets.
According to cellular component ontology, we first classified 1,362 orthologous quartet members into six categories (nucleus, cytoplasm, organelle, cell membrane, extracellular, and unknown) (fig. 2). Within these categories, the orthologous druggable protein targets associated with the cell membrane accounted for 32.9% of all targets, consistent with previous reports suggesting that membrane-embedded proteins are of principal therapeutic interest (Hopkins and Groom 2002; Rajendran et al. 2010). Of the 1,362 targets, approximately 5.5% were classified into the “unknown” category due to a lack of clear ontological properties.
Fig. 2.—
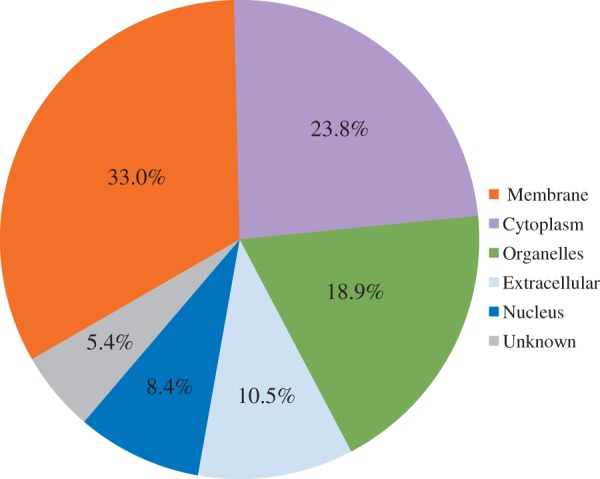
Subcellular fractionation of 1,362 druggable target orthologs among four mammalian species.
It is well known that knowing genetic relationship between human and nonhuman therapeutic drug targets is more predictive to translational research (Searls 2003; Yan et al. 2011). On the basis of the six subcellular categories described earlier, we compared the sequence identity of drug-target orthologs between human and nonhuman species at both the protein and the DNA level. The three nonhuman species used herein (macaque, mouse, and rat) were chosen because they are among the most representative animal models currently employed in pharmacology. Intriguingly, the sequence identity of drug-target orthologs with a nuclear localization was on average the highest compared with drug-target orthologs with the other subcellular localizations (table 1). In contrast, those drug targets with a cell membrane or extracellular localization had a relatively lower protein and DNA sequence identity (one-sided Wilcoxon rank-sum test, P < 0.05).
Table 1.
Comparison of Drug Target Identity with Respect to Subcellular Localization at Both the DNA and the Protein Level
| Group | Subcellular Localization | Mean Identity (%) | Nucleus | Cytoplasm | Membrane | Organelle | Extracellular |
|---|---|---|---|---|---|---|---|
| hum2mac | Nucleus | 93.83 | — | ||||
| Cytoplasm | 91.89 | 0.0457 | — | ||||
| Membrane | 91.40 | 0.0123 | 0.2474 | — | |||
| Organelle | 91.64 | 0.0057 | 0.0910 | 0.4642 | — | ||
| Extracellular | 91.87 | 0.0003 | 0.0008 | 0.0105 | 0.0687 | — | |
| Unknown | 90.55 | 0.0050 | 0.0612 | 0.1988 | 0.4877 | 0.4877 | |
| hum2mouse | Nucleus | 89.73 | — | ||||
| Cytoplasm | 88.02 | 0.0482 | — | ||||
| Membrane | 83.36 | 5.58E-06 | 0.0001 | — | |||
| Organelle | 85.55 | 2.79E-06 | 0.0002 | 0.8756 | — | ||
| Extracellular | 75.24 | 2.20E-16 | 2.20E-16 | 3.76E-12 | 2.38E-15 | — | |
| Unknown | 85.54 | 0.0046 | 0.1602 | 0.3405 | 0.2249 | 8.30E-10 | |
| hum2rat | Nucleus | 86.73 | — | ||||
| Cytoplasm | 85.54 | 0.1116 | — | ||||
| Membrane | 80.83 | 4.94E-05 | 0.0002 | — | |||
| Organelle | 82.79 | 2.38E-04 | 0.0024 | 0.5592 | — | ||
| Extracellular | 74.07 | 2.15E-14 | 2.20E-16 | 2.62E-09 | 3.46E-12 | — | |
| Unknown | 81.61 | 0.0090 | 0.0906 | 0.6320 | 0.8258 | 2.60E-06 | |
Note.—Pairwise P values among the subcellular categories are shown. P values were calculated by using the one-sided Wilcoxon rank-sum test.
We then sought to analyze drug orthologous targets with respect to their subcellular localization on the evolutionary scale. We mainly evaluated and compared the molecular evolution and phylogeny of the drug targets among the six subcellular categories. The most general method for analyzing the molecular evolution rate is to calculate the Ka/Ks ratio for the drug-target orthologs, where lower a Ka/Ks ratio corresponds to a more highly conserved evolutionary pattern. To investigate whether drug-target orthologs with a nuclear localization are more conserved relative to those with alternative subcellular localizations, two models implemented in the codeml program of the PAML package (the basic model and the branch model, see Materials and Methods) were employed to calculate the Ka/Ks ratio.
Of 1,362 drug-target orthologs, three were excluded due to ω = 99.0000 (ω = Ka/Ks) caused by Ks = 0. The remaining 1,359 targets were assigned to one of the six subcellular categories. The average pairwise Ka/Ks ratio (human–macaque, human–mouse, and human–rat) for each category was calculated and compared between any two of the six categories. The comparative results indicated that the average Ka/Ks ratio for the subset of orthologous targets with a nuclear localization was 0.1383, 0.0762, and 0.0756 (table 2) for the human–macaque (hum2mac), human–mouse (hum2mouse), and human–rat (hum2rat) comparisons, respectively. Therefore, the evolution rate of this group was the lowest compared with that of the other five categories (two-sided KS test, P < 10−5, fig. 3). In contrast, the highest evolution rate was observed for subsets of orthologous targets with cell membrane and extracellular localizations, further suggesting that drug targets in the cell core (i.e., the nucleus) are the most evolutionarily conserved.
Table 2.
Ka/Ks Ratios between Drug Targets with Respect to Subcellular Localization
| Subcellular category | Mean Ka/Ks |
P Values, hum2mac |
|||||||
|---|---|---|---|---|---|---|---|---|---|
| hum2mac | hum2mouse | hum2rat | Nucleus | Cytoplasm | Organelle | Membrane | Extracellular | Unknown | |
| Nucleus | 0.1383 | 0.0762 | 0.0756 | — | |||||
| Cytoplasm | 0.2145 | 0.0931 | 0.0997 | 9.70E-06 | — | ||||
| Organelle | 0.2633 | 0.1176 | 0.1205 | 4.59E-09 | 0.044 | — | |||
| Membrane | 0.2163 | 0.1293 | 0.1325 | 4.14E-05 | 0.533 | 0.007372 | — | ||
| Extracellular | 0.3183 | 0.2077 | 0.2086 | 5.32E-14 | 6.82E-09 | 9.08E-06 | 1.32E-09 | — | |
| Unknown | 0.1929 | 0.1036 | 0.1127 | 3.04E-05 | 0.4572 | 0.57 | 0.2371 | 3.47E-05 | — |
Note.—The left panel shows the mean Ka/Ks ratio for each subcellular category. The right panel shows the pairwise P values (hum2mac) among the subcellular categories. P values were calculated by using the two-sided KS test.
Fig. 3.—
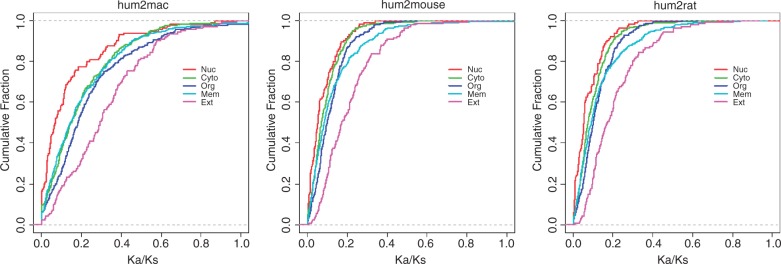
Empirical cumulative distribution of Ka/Ks ratios between human and nonhuman species (macaque, mouse, and rat) (left to right: hum2mac, hum2mouse, and hum2rat) for drug target orthologs with respect to five subcellular categories (Nuc, nucleus; Cyto, cytoplasm; Org, organelle; Mem, membrane; Ext, extracellular; and Sim, simulation).
The observed difference in evolution rate between extra- and intracellular proteins has been previously investigated (Julenius and Pedersen 2006; Kim et al. 2007). Additionally, such evolutionary patterns are also reasonably used for predicting protein subcellular localization (Nair and Rost 2002). Therefore, we further conducted comparison of observed evolutionary patterns for druggable targets with genome-wide patterns. Consistent with previously reported, similar pattern is also discovered at the genome level, whereas it is more conserved for druggable targets regarding to each subcellular category, and the tendency is more obvious of the low evolution rate in nucleus for druggable targets (fig. 4).
Fig. 4.—
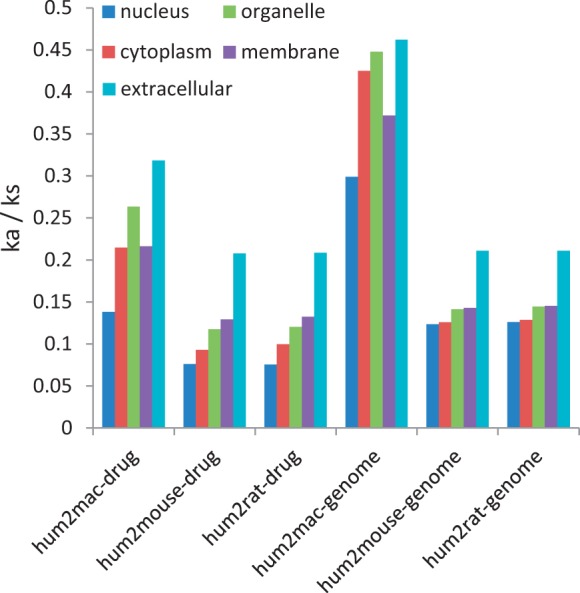
Comparison of observed evolutionary patterns for druggable targets with genome-wide patterns.
Previous molecular phylogeny analysis demonstrated that the entire data set of concatenated genes for eight yeast species yielded a fully resolved species tree (Rokas et al. 2003). This is indicative of robust concatenation of all related genes employed to compute the Ka/Ks ratio. Therefore, we also carried out a Ka/Ks calculation based on the concatenation of target ortholog sequences with respect to each of the six subcellular categories. Similar to the results described earlier, the concatenation-based results demonstrated that orthologous drug targets with a nuclear localization showed a higher trend for evolutionary conservation relative to those with a cell membrane or extracellular localization (fig. 5).
Fig. 5.—
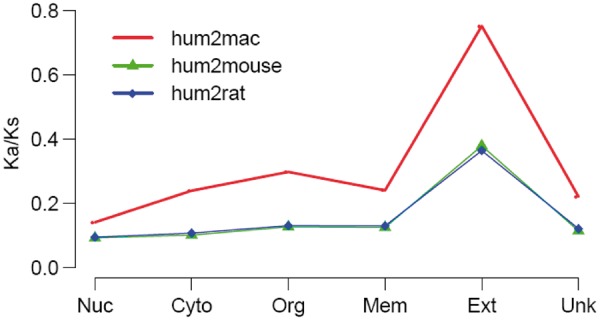
Concatenation-based Ka/Ks ratios for drug target orthologous with subcellular categories. Nuc, Cyto, Org, Mem, Ext, and Unk represent nucleus, cytoplasm, organelle, cell membrane, extracellular, and unknown localization, respectively.
We then used the branch model to conduct pairwise comparisons among any two subcellular categories. The branch model allows the ω ratio to vary among branches of the phylogenetic tree, so as to reflect the lineage evolution rate. Using rodents (mouse and rat) as a combined outgroup, the average ω ratio was found to be the lowest for target orthologs with a nuclear localization (two-sided KS test, P < 10−3) in the human lineage (fig. 6), as well as in the macaque, mouse, and rat lineages (supplementary table S2, Supplementary Material online). Use of mouse or rat alone as an outgroup did not appreciably affect the results (data not shown).
Fig. 6.—
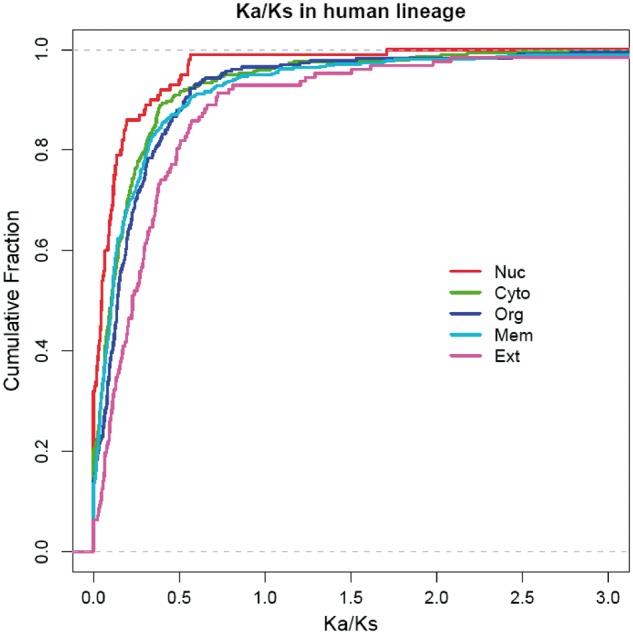
Empirical cumulative distribution of Ka/Ks ratios in the human lineage based on the branch model.
Finally, to test whether the Ka/Ks ratio for drug-target orthologs is also dependent on subcellular localization in primates, we conducted a similar evolutionary analysis in the human, chimpanzee, and macaque. By using the yn00 program implemented in the PAML package, we observed that drug-target orthologs with a nuclear localization were the most conserved in primates, whereas those with an extracellular localization were the least conserved (fig. 7, supplementary fig. S1 and table S3, Supplementary Material online).
Fig. 7.—
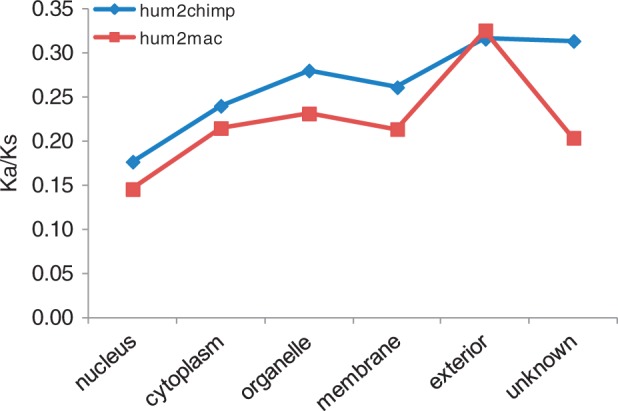
Ka/Ks ratios between druggable protein targets with respect to subcellular localization in primates based on the yn00 program.
If drugs have severely adverse or side effects, caused by off-target, multiple targets, and so on, meaning the failure of drugs, termed withdrawal drugs. According to document curated in the latest Drugbank database, we counted and summarized the orthologs targeted by these withdrawal drugs. Notably, the fraction of withdrawal druggable orthologs with membrane and extracellular localizations is two and five times higher than these with alternative subcellular localizations (supplementary table S4, Supplementary Material online).
Altogether, the results of this study indicate that orthologous drug targets with a nuclear localization are more highly conserved than those with alternative subcellular localizations. We conclude that the general order of evolutionary conservation in the druggable genome is as follows (from highest to lowest): nucleus > cytoplasm > organelle > membrane > extracellular.
Discussion
In this study, we performed an evolutionary survey of drug targets with respect to their subcellular localizations. Partitioning a total of 1,362 orthologous targets into six subcellular categories (nucleus, cytoplasm, organelle, membrane, extracellular, and unknown), we applied the Ka/Ks ratio to evaluate and compare the evolution rate of these druggable protein targets. Remarkably, our findings indicate a descending trend of evolutionary conservation for druggable orthologous targets, ranging from the most highly conserved targets in the nucleus, followed by the cytoplasm, and finally, the cell membrane and the extracellular compartments. To the best of our knowledge, such a survey has not been performed previously from the aspect of pharmacophylogenomics. Although the functional consequences of high versus low evolutionary conservation on drug-target interactions remains unclear, the phenomenon uncovered herein does provide a new reference point and novel suggestions for drug trials in model animals. As reflected by withdrawal drugs curated in the Drugbank database (supplementary table S4, Supplementary Material online), the rate of evolutionary change of drug targets necessitates that certain precautions be taken regarding the selection of appropriate animal models for preclinical drug or vaccine trials (Shedlock et al. 2009). For evolutionarily less conserved candidates, one successfully improved approach, humanized animal models, could be utilized for drug or immunotherapy agents development, as murine humanization model for hepatitis C virus infection (Dorner et al. 2011).
As conserved protein–protein interaction interfaces are biologically compelling targets for drug discovery (Kozakov et al. 2011), the higher conservation of targets localizing inner cellular compartments might be regarded as a clue for new drug binding. Therefore, besides targets themselves, the conserved interaction of targets with other proteins or ligands is also needed to investigation. Moreover, compared with cell surface, the whole process during drug delivery to its inner cell compartments is also required to determine the conservation.
From the viewpoint of the drug-target network (i.e., the global set of relationships between all drug–protein targets and disease-gene products), the largest category of approved drug targets corresponds to the group of membrane proteins (Yildirim et al. 2007). This is likely due to the fact that it is easier to target drugs to membrane versus intracellular proteins, because transporting most drugs across the plasma membrane is technically challenging. Currently, only a few drug delivery strategies have been successfully exploited to deliver pharmacological agents into intracellular compartments (Rajendran et al. 2010). In combination with knowledge of approved drug targets, we anticipate that the molecular evolutionary pattern for drug targets set forth in this study will provide fundamental information to aid in the interpretation of the druggable genome.
Supplementary Material
Supplementary tables S1–S4 and figure S1 are available at Genome Biology and Evolution online (http://www.gbe.oxfordjournals.org/).
Acknowledgments
The authors thank Shao-Bin Xu for his support on super computing service. They are also thankful to Yu-Qi Zhao for his helpful discussion. This work was supported by National Natural Science Foundation of China (grant no. 31272401 and U1036604).
Literature Cited
- Ashburner M, et al. Gene ontology: tool for the unification of biology. The Gene Ontology Consortium. Nat Genet. 2000;25:25–29. doi: 10.1038/75556. [DOI] [PMC free article] [PubMed] [Google Scholar]
- Delsuc F, Brinkmann H, Philippe H. Phylogenomics and the reconstruction of the tree of life. Nat Rev Genet. 2005;6:361–375. doi: 10.1038/nrg1603. [DOI] [PubMed] [Google Scholar]
- Dorner M, et al. A genetically humanized mouse model for hepatitis C virus infection. Nature. 2011;474:208–211. doi: 10.1038/nature10168. [DOI] [PMC free article] [PubMed] [Google Scholar]
- Edgar RC. MUSCLE: multiple sequence alignment with high accuracy and high throughput. Nucleic Acids Res. 2004;32:1792–1797. doi: 10.1093/nar/gkh340. [DOI] [PMC free article] [PubMed] [Google Scholar]
- Eisen JA, Fraser CM. Phylogenomics: intersection of evolution and genomics. Science. 2003;300:1706–1707. doi: 10.1126/science.1086292. [DOI] [PubMed] [Google Scholar]
- Fang X, et al. Genome sequence and global sequence variation map with 5.5 million SNPs in Chinese rhesus macaque. Genome Biol. 2011;12:R63. doi: 10.1186/gb-2011-12-7-r63. [DOI] [PMC free article] [PubMed] [Google Scholar]
- Hopkins AL, Groom CR. The druggable genome. Nat Rev Drug Discov. 2002;1:727–730. doi: 10.1038/nrd892. [DOI] [PubMed] [Google Scholar]
- Hubbard TJ, et al. Ensembl 2009. Nucleic Acids Res. 2009;37:D690–D697. doi: 10.1093/nar/gkn828. [DOI] [PMC free article] [PubMed] [Google Scholar]
- Julenius K, Pedersen AG. Protein evolution is faster outside the cell. Mol Biol Evol. 2006;23:2039–2048. doi: 10.1093/molbev/msl081. [DOI] [PubMed] [Google Scholar]
- Kim PM, Korbel JO, Gerstein MB. Positive selection at the protein network periphery: evaluation in terms of structural constraints and cellular context. Proc Natl Acad Sci U S A. 2007;104:20274–20279. doi: 10.1073/pnas.0710183104. [DOI] [PMC free article] [PubMed] [Google Scholar]
- Koppen H. Virtual screening—what does it give us? Curr Opin Drug Discov Dev. 2009;12:397–407. [PubMed] [Google Scholar]
- Kozakov D, et al. Structural conservation of druggable hot spots in protein–protein interfaces. Proc Natl Acad Sci U S A. 2011;108:13528–13533. doi: 10.1073/pnas.1101835108. [DOI] [PMC free article] [PubMed] [Google Scholar]
- Nair R, Rost B. Sequence conserved for subcellular localization. Protein Sci. 2002;11:2836–2847. doi: 10.1110/ps.0207402. [DOI] [PMC free article] [PubMed] [Google Scholar]
- Overington JP, Al-Lazikani B, Hopkins AL. How many drug targets are there? Nat Rev Drug Discov. 2006;5:993–996. doi: 10.1038/nrd2199. [DOI] [PubMed] [Google Scholar]
- Rajendran L, Knolker HJ, Simons K. Subcellular targeting strategies for drug design and delivery. Nat Rev Drug Discov. 2010;9:29–42. doi: 10.1038/nrd2897. [DOI] [PubMed] [Google Scholar]
- Rannala B, Yang Z. Phylogenetic Inference Using Whole Genomes. Annu Rev Genomics Hum Genet. 2008;9:217–231. doi: 10.1146/annurev.genom.9.081307.164407. [DOI] [PubMed] [Google Scholar]
- Rokas A, Williams BL, King N, Carroll SB. Genome-scale approaches to resolving incongruence in molecular phylogenies. Nature. 2003;425:798–804. doi: 10.1038/nature02053. [DOI] [PubMed] [Google Scholar]
- Russ AP, Lampel S. The druggable genome: an update. Drug Discov Today. 2005;10:1607–1610. doi: 10.1016/S1359-6446(05)03666-4. [DOI] [PubMed] [Google Scholar]
- Searls DB. Pharmacophylogenomics: genes, evolution and drug targets. Nat Rev Drug Discov. 2003;2:613–623. doi: 10.1038/nrd1152. [DOI] [PubMed] [Google Scholar]
- Shedlock DJ, Silvestri G, Weiner DB. Monkeying around with HIV vaccines: using rhesus macaques to define “gatekeepers” for clinical trials. Nat Rev Immunol. 2009;9:717–728. doi: 10.1038/nri2636. [DOI] [PMC free article] [PubMed] [Google Scholar]
- Smit MJ, et al. Pharmacogenomic and structural analysis of constitutive g protein-coupled receptor activity. Annu Rev Pharmacol Toxicol. 2007;47:53–87. doi: 10.1146/annurev.pharmtox.47.120505.105126. [DOI] [PubMed] [Google Scholar]
- Steindl TM, Schuster D, Laggner C, Langer T. Parallel screening: a novel concept in pharmacophore modeling and virtual screening. J Chem Inf Model. 2006;46:2146–2157. doi: 10.1021/ci6002043. [DOI] [PubMed] [Google Scholar]
- Wishart DS, et al. DrugBank:a knowledgebase for drugs, drug actions and drug targets. Nucleic Acids Res. 2008;36:D901–D906. doi: 10.1093/nar/gkm958. [DOI] [PMC free article] [PubMed] [Google Scholar]
- Yan G, et al. Genome sequencing and comparison of two nonhuman primate animal models, the cynomolgus and Chinese rhesus macaques. Nat Biotechnol. 2011;29:1019–1023. doi: 10.1038/nbt.1992. [DOI] [PubMed] [Google Scholar]
- Yildirim MA, Goh KI, Cusick ME, Barabasi AL, Vidal M. Drug-target network. Nat Biotechnol. 2007;25:1119–1126. doi: 10.1038/nbt1338. [DOI] [PubMed] [Google Scholar]
- Zhang J, Nielsen R, Yang Z. Evaluation of an improved branch-site likelihood method for detecting positive selection at the molecular level. Mol Biol Evol. 2005;22:2472–2479. doi: 10.1093/molbev/msi237. [DOI] [PubMed] [Google Scholar]
- Zuber J, et al. RNAi screen identifies Brd4 as a therapeutic target in acute myeloid leukaemia. Nature. 2011;478:524–528. doi: 10.1038/nature10334. [DOI] [PMC free article] [PubMed] [Google Scholar]
Associated Data
This section collects any data citations, data availability statements, or supplementary materials included in this article.


