Abstract
Purpose:
The purpose was to evaluate the sensitivity and specificity of measurements of central macular thickness (CMT) in diabetic macular edema using stratus time-domain and cirrus spectral-domain optical coherence tomography (OCT; Carl Zeiss Meditec, Dublin, CA).
Materials and Methods:
A total of 36 eyes from 19 patients with clinically significant diabetic macular edema (DME) were included. All participants underwent automated scanning patterns using cirrus HD-OCT and stratus OCT examinations on the same day. The sensitivity/specificity of retinal thickness measurements was calculated from published normative data. Agreement was calculated using Bland--Altman method. The receiver operating characteristic curves (ROC) and areas under the ROC were plotted.
Results:
The mean difference between the cirrus HD-OCT and stratus OCT in the central foveal zone was 49.89 μm. Bland--Altman analysis confirmed that the retinal thickness measurements had poor agreement in patients with DME. The areas under the ROC for retinal thickness measurements were 0.88 using cirrus HD-OCT and 0.94 with stratus.
Conclusions:
In patients with DME, the cirrus HD-OCT gives a higher reading than stratus OCT with poor agreement between the devices in most regions within the nine subfield zones. The sensitivity and specificity of the stratus OCT was comparable to the cirrus.
Keywords: Diabetic macular edema, optical coherence tomography, sensitivity, specificity
Ocular coherence tomography (OCT) is currently the most precise technique for the measurement of in vivo retinal thickness. It allows for morphological assessment by producing two- and three-dimensional images of the retina as well as producing quantitative measures, resulting in its routine use in clinical practice.[1,2] The macular thickness on OCT is important in the diagnosis and monitoring of treatment in patients with diabetic macular edema (DME). Several Fourier (spectral) domain OCT devices have become commercially available and these give improved resolution of the retinal structures compared to the stratus OCT machine (Carl Zeiss Meditec. Dublin, CA). Both of these devices in question employ intrinsic automated software algorithms to calculate retinal thicknesses averaged across standardized subfields in the macula. They use different anatomic landmarks in the specification of the outer retinal boundary and these may contribute to a different absolute value for thickness measurements affecting how retinal boundaries are reliably delineated.[3] The repeatability and reliability of measurements with previous OCT modalities has been demonstrated in several studies.[4,5] Some studies have attempted to compare data obtained using the stratus OCT and other Fourier domain OCT including the cirrus HD-OCT in both healthy normal and affected patients with diabetic macular edema and demonstrated that cirrus HD-OCT OCT measured retinal thickening was between 30 to 55 microns thicker compared to stratus OCT.[3,5,6]
The aims of this study were to evaluate the sensitivity and specificity of the cirrus OCT compared to the stratus OCT in eyes with DME and review published studies specifically looking at the reliability, repeatability, sensitivity, specificity and discriminatory power of the stratus OCT and cirrus HD-OCT devices.
Materials and Methods
All participants were patients from the retina clinic in the department of ophthalmology. The study was approved by the institutional review board/ ethics committee. The study adhered to tenets of the Declaration of Helsinki.
Patients with DME were dilated with tropicamide 1% and 2.5% phenylephrine and underwent consecutive OCT examination using the stratus OCT (version 3.0 software; Carl Zeiss Meditec) and spectral domain OCT (Cirrus HD-OCT, Zeiss Meditec). A maximum of 3 scans each was performed randomly on each patient by a single experienced operator who is certified for multicentre clinical trials. All the included scans were free of retinal boundary identification errors within the central zone. Automated measures were recorded by two independent readers on each device masked to the identity of the patients.
Time Domain OCT Imaging
Time domain OCT imaging was performed with the stratus OCT (Carl Zeiss Meditec Inc,Dublin, CA). A fast macular-thickness scan with six 6 mm linear scans oriented 30° apart in a radial spoke like pattern was acquired in a continuous automated sequence. Each of the six linear scans is composed of 128 equally spaced transverse axial scans per line, intersecting at the fovea (total of 768 sampled points) within a scan time of 1.9 seconds. The map is composed of nine sectorial thickness measurements in three concentric circles with diameters of 1, 3, and 6 mm. The area bounded by the outer (6 mm) and middle (3 mm) circles forms the outer ring while the area bounded by the middle (3 mm) and inner circles (1 mm) forms the inner ring. Each ring is divided into four quadrants, superior, nasal, inferior, and temporal. The central 1 mm circular region represents the foveal area.
Fourier Domain OCT Imaging
Scanning with the cirrus HD-OCT was performed with the 512 ×128 scan pattern where a 6× 6 mm area on the retina is scanned with 128 horizontal lines, each consisting of 512 A-scans per line (total of 65,536 sampled points) within a scan time of 2.4 seconds. High-quality scans were obtained with each instrument. These were defined as scans with a signal strength >6 that exhibit correct delineation of the retina layers as detected automatically by the intrinsic software segmentation algorithm and are without image artifacts caused by eye movement and pupillary shadowing. In the computational software, retinal thicknesses in both instruments are averaged within nine retinal subfields in a 6 mm diameter circle centered on the fovea. Each individual scan from both devices was evaluated for automated segmentation error and manually approximated to give the final thickness between the inner limiting membrane and retinal pigment epithelium layers.
Statistical Analysis
A minimal sample size of 33 eyes was necessary for detecting a 20% difference in macular thickness in a paired study design. Macular thickness readings for each of the retinal subfields were obtained for each patient on both OCT scanners, and Bland--Altman plots (Prism, ver. 4; Graph-Pad, San Diego, CA) were constructed to compare and assess agreement in macular measurements between the stratus OCT and cirrus HD-OCT systems. Results were expressed as means (±standard deviation [SD]). A Pearson coefficient test was used for the correlation studies and a paired student test for performed for analysis. Bonferroni correction was used for multiple comparisons. The coefficient of variation and intraclass correlation coefficient (ICC) were calculated for each scanner in a grouped fashion and evaluated with the Kruskal--Wallis test. Pearson correlation analysis was performed for the mean subfield measurements for each eye (Prism, ver. 4; Graph- Pad). The sensitivities and specificities were calculated for cirrus HD-OCT and stratus OCT in diabetic edema versus published normative datasets. The receiver operating characteristic (ROC) curves were used to determine the discriminatory capabilities between healthy and retinal edematous eyes in this study and from data from previously published studies. The area under receiver operating characteristic curve (AROC) was calculated to assess the ability of each device to differentiate DME from normal eyes. An AROC of 1.0 represents perfect discrimination, whereas AROC of 0.5 represents chance discrimination.
Results
A total of 36 out of 38 eyes from 19 patients that were confirmed to have clinically significant and angiographically confirmed DME were recruited for this study. Two eyes were excluded as a scan was not possible due to poor media clarity. Only scans with proper delineation of retinal layers on both systems were included.
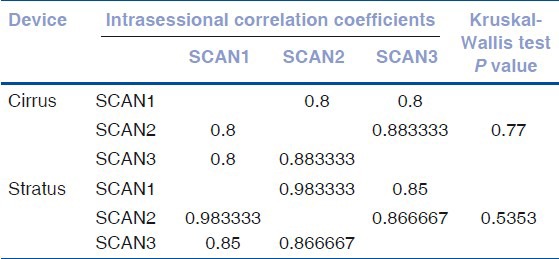
The mean age of patients was 58.81 ± 12.92 years with an equal male to female distribution. The signal strength in the cirrus HD-OCT and stratus OCT was 8.28 and 6.39 respectively. Mean measurements of macular thickness in each of the nine subfields as well as the total macular volume, manual measurements with Bland Altman agreement limits and Pearson correlation coefficient with P values are indicated in Table 1. Pairwise measurements of macular thickness measurements using both scanners showed agreement in some regions. The mean difference in this study between the cirrus HD-OCT and stratus OCT in the central foveal zone was 49.89 μm. There was a significant difference in the central, inner inferior, outer superior, outer temporal, outer inferior regions. Intrasessional correlation coefficient of data acquired from consecutive scans using a grouped analysis did not show a significant difference between the two devices, as shown in Table 2.
Table 1.
Comparison of retinal thickness measurements in the nine zones using stratus optical coherence tomography and cirrus optical coherence tomography
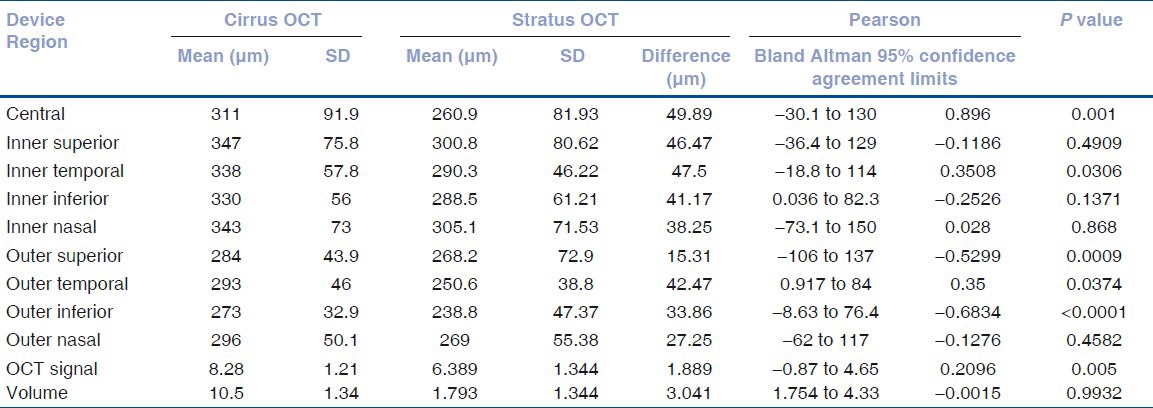
Table 2.
Grouped analysis of intrasessional repeated measures for macular subfield thicknesses
The retinal thickness sensitivity and specificity using the stratus OCT in relation to detection macular edema was equivalent to 88.9% [95% confidence Interval (CI), 51.75 to 99.2] compared to the cirrus HD-OCT that showed 77.8% [95% CI, 39.99 to 97.19]. Equivalent data from similar studies comparing the cirrus HD-OCT and stratus OCT in DME detection that have been published previously were also calculated and demonstrated in Table 3.
Table 3.
Sensitivity and specificity of the cirrus and stratus OCT devices from the current and other published studies measuring increased retinal thickness in diabetic macular edema including 95% confidence intervals and area under receiver operator curves
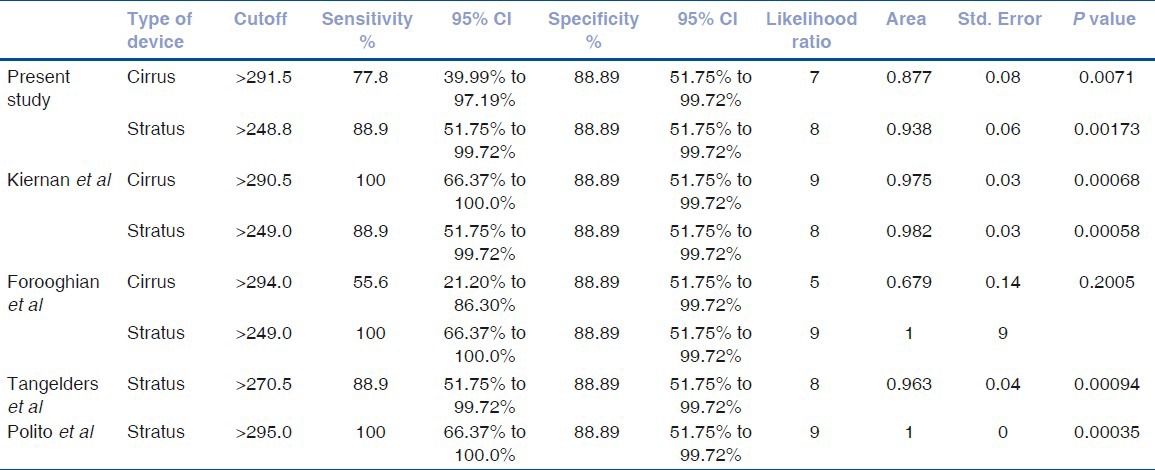
The cutoff value of the retinal thickness measurements using cirrus HD-OCT in this study that best discriminated significantly between normal and DME eyes was >291.5 μm and for stratus OCT was >248.8 μm (P < 0.05). Similar cutoff values from other studies using these two machines have been detected with equivalent specificity (88.89%). The sensitivity of detection of increased retinal thickness in other studies with these cutoffs using the cirrus HD-OCT ranged from 55.6 to 100%, whilst the stratus OCT ranged from 77.8 to 100%.
The area under receiver operating curve (AROC) for DME patients calculated in this study showed that the discriminating power of the cirrus HD-OCT (0.877) was similar to stratus OCT (0.938). Similar AROCs were noted on further analysis of published data from two other studies (Keirnan et al. and Foroorghian et al.) using these two devices when compared to normal patients.
In healthy normal patients, increased retinal thickness was defined as any measurement >250 μm with a specificity of 88.89% in all studies. The sensitivity however ranged from 44.44 to 66.67% as shown in Table 3. Analysis of AROCs comparing data from normal patients using stratus OCT showed a small range of discriminating power from 0.642 to 0.8395. The ROC curves of retinal thickness measurements in this and other studies using cirrus HD-OCT and stratus OCT are shown in Figs. 1-2.
Figure 1.
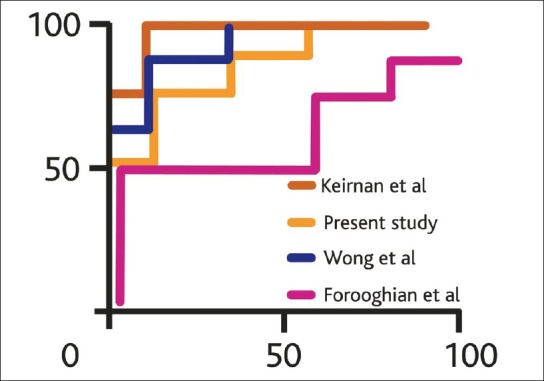
Receiver operating curves comparing sensitivity and specificity of measured retinal thickness in the present and previously published studies using the cirrus HD OCT in diabetic macular edema patients referenced to normative database
Figure 2.
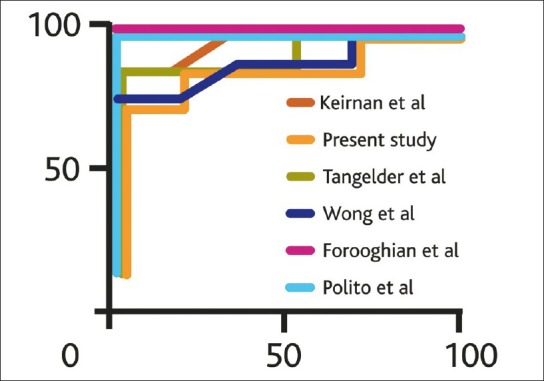
Receiver operating curves comparing sensitivity and specificity of measured retinal thickness in the present and previously published studies using the time domain stratus OCT in diabetic macular edema patients referenced to normative database
Discussion
This study of DME patients demonstrates the differences of automated retinal thickness measurements between the cirrus HD-OCT and stratus OCT devices. Cirrus HD-OCT generated significantly higher values in the central, inner temporal, outer superior, outer temporal, and outer inferior macular subfields. This is crucial as the central subfield mean thickness is the preferred OCT measurement for the central macula because of its higher reproducibility and correlation with other measurements of the central macula.[7] Interestingly, the OCT software systems that perform automated delineations of retinal boundaries uses different anatomic landmarks of the inner and outer retinal boundary. The cirrus HD-OCT segmentation algorithm identifies the thickness of the retina from the retinal pigment epithelium (RPE) to the inner limiting membrane (ILM), while the stratus OCT segmentation algorithm identifies the thickness of the retina based on the distance between the ILM and junction of the outer segments (OS) and inner segments (IS) of the photoreceptors. As a result, the cirrus HD-OCT system would be expected to give macular measurements that are larger than those obtained by the stratus OCT in this study ranging from 15.31 to 49.99 μm. The difference in thickness measurements between the cirrus HD-OCT and stratus OCT systems should correspond to the length of photoreceptor outer segments within the macula.[5]
The Bland Atlman 95% limits of agreement between devices in our study were large, with retinal thickness values particularly in the central zone, up to 160 μm indicating poor agreement. This is similar to recent work that has compared the cirrus HD-OCT and stratus OCT.[5]
The reproducibility of the stratus OCT in healthy normal eyes and in those with DME has been established previously,[4,6,8,9,10] although each study used a different method, the results are believed to be comparable. It is expected that the cirrus HD-OCT would perform better compared to the stratus OCT due to the greater sampling that occurs within the central cube; however our grouped results show no difference [Table 2].
This is the first study looking at the sensitivity and specificity of these two devices in measuring retinal thickness in the DME using data from our own work and from other published data. These findings are similar to other authors [Table 3] showing a sensitivity range of 66.7 to 100% with the cirrus HD-OCT (cutoff >290 μm) compared to 77.8 to 100% with the stratus OCT (cutoff >250 μm) in detection of DME. We can reliably infer from this study that a 43 μm difference has to be allowed if using stratus OCT and cirrus HD-OCT machines interchangeably for the accurate diagnosis of increased retinal thickening in DME using OCT, although the recommended preference is to use the same machine for each patient per visit.
The stratus OCT has showed the lowest thicknesses compared with those with the cirrus HD-OCT and Spectralis HRA + OCT in healthy normal eyes as these devices include the RPE layer in the retinal segmentation.[11,12] Recent work from data received for clinical trial research at a reading center has shown that among experienced operators, given the same operator, machine, and eye at the same sitting, stratus OCT retinal thickness maps appear to have a correlation that is likely to be less than the clinically important difference.[13] The stratus OCT has similar discriminating power to cirrus HD-OCT in the detection of DME.[14]
This study shows that stratus OCT show a moderately high sensitivity and specificity for detection of DME. The cirrus OCT sensitivity and specificity results and ROC curves obtained in the current study are quite comparable with those of stratus OCT. We conclude that cirrus OCT better delineates morphological characteristics compared to stratus OCT with good signal strength and remains a valuable device in discriminating DME.
Larger studies comparing stratus OCT and Fourier domain OCTs are necessary for confirmation in diseased eyes where segmentation errors remain a concern in patients with structurally complex retinal disease.[15]
Footnotes
Source of Support: Nil,
Conflict of Interest: None declared.
References
- 1.Knudsen S, Bek T, Poulsen P, Hove M, Rehling M, Mogensen C. Macular edema reflects generalized vascular hyperpermeability in type 2 diabetic patients with retinopathy. Diabetes Care. 2002;25:2328–34. doi: 10.2337/diacare.25.12.2328. [DOI] [PubMed] [Google Scholar]
- 2.Schaudig U, Scholz F, Lerche R, Richard G. Optical coherence tomography for macular edema. Classification, quantitative assessment, and rational usage in the clinical practice. Ophthalmologe. 2004;101:785–93. doi: 10.1007/s00347-004-1054-9. [DOI] [PubMed] [Google Scholar]
- 3.Kiernan D, Hariprasad S, Chin E, Kiernan C, Rago J, Mieler WF. Prospective comparison of cirrus and stratus optical coherence tomography for quantifying retinal thickness. Am J Ophthalmol. 2009;147:267–75. doi: 10.1016/j.ajo.2008.08.018. [DOI] [PubMed] [Google Scholar]
- 4.Polito A, Del Borrello M, Isola M, Zemella N, Bandello F. Repeatability and reproducibility of fast macular thickness mapping with stratus optical coherence tomography. Arch Ophthalmol. 2005;123:1330–7. doi: 10.1001/archopht.123.10.1330. [DOI] [PubMed] [Google Scholar]
- 5.Forooghian F, Cukras C, Meyerle C, Chew E, Wong T. Evaluation of time domain and spectral domain optical coherence tomography in the measurement of diabetic macular edema. Invest Ophthalmol Vis Sci. 2008;49:4290–6. doi: 10.1167/iovs.08-2113. [DOI] [PMC free article] [PubMed] [Google Scholar]
- 6.Leung C, Cheung C, Weinreb R, Lee G, Lin D. Comparison of macular thickness measurements between time domain and spectral domain optical coherence tomography. Invest Ophthalmol Vis Sci. 2008;49:4893–7. doi: 10.1167/iovs.07-1326. [DOI] [PubMed] [Google Scholar]
- 7.Browning D, Glassman A, Aiello L, Bressler N, Bressler S, Danis R, et al. Optical coherence tomography measurements and analysis methods in optical coherence tomography studies of diabetic macular edema. Ophthalmology. 2008;115:1366–71. doi: 10.1016/j.ophtha.2007.12.004. [DOI] [PMC free article] [PubMed] [Google Scholar]
- 8.Massin P, Vicaut E, Haouchine B, Erginay A, Paques M, Gaudric A. Reproducibility of retinal mapping using optical coherence tomography. Arch Ophthalmol. 2001;119:1135–42. doi: 10.1001/archopht.119.8.1135. [DOI] [PubMed] [Google Scholar]
- 9.Tangelder G, Van der Heijde R, Polak B, Ringens P. Precision and reliability of retinal thickness measurements in foveal and extrafoveal areas of healthy and diabetic eyes. Invest Ophthalmol Vis Sci. 2008;49:2627–34. doi: 10.1167/iovs.07-0820. [DOI] [PubMed] [Google Scholar]
- 10.Paunescu L, Schuman J, Price L, Stark P, Beaton S, Ishikawa H, et al. Reproducibility of nerve fiber thickness, macular thickness, and optic nerve head measurements using Stratus OCT. Invest Ophthalmol Vis Sci. 2004;45:1716–24. doi: 10.1167/iovs.03-0514. [DOI] [PMC free article] [PubMed] [Google Scholar]
- 11.Wolf-Schnurrbusch U, Ceklic L, Brinkmann C, Iliev M, Frey M, Rothenbuehler S, et al. Macular thickness measurements in healthy eyes using six different optical coherence tomography instruments. Invest Ophthalmol Vis Sci. 2009;50:3432–7. doi: 10.1167/iovs.08-2970. [DOI] [PubMed] [Google Scholar]
- 12.Menke M, Dabov S, Sturm V. Comparison of three different optical coherence tomography models for total macular thickness measurements in healthy controls. Ophthalmologica. 2009;223:352–6. doi: 10.1159/000226600. [DOI] [PubMed] [Google Scholar]
- 13.Danis R, Fisher M, Lambert E, Goulding A, Wu D, Lee L. Results and repeatability of retinal thickness measurements from certification submissions. Arch Ophthalmol. 2008;126:45–50. doi: 10.1001/archopht.126.1.45. [DOI] [PubMed] [Google Scholar]
- 14.Kakinoki M, Sawada O, Sawada T, Kawamura H, Ohji M. Comparison of macular thickness between cirrus HD-OCT and Stratus OCT. Ophthalmic Surg Lasers Imaging. 2009;40:135–40. doi: 10.3928/15428877-20090301-09. [DOI] [PubMed] [Google Scholar]
- 15.Keane P, Mand P, Liakopoulos S, Walsh A, Sadda S. Accuracy of retinal thickness measurements obtained with cirrus optical coherence tomography. Br J Ophthalmol. 2009;93:1461–7. doi: 10.1136/bjo.2008.155846. [DOI] [PubMed] [Google Scholar]


