Abstract
The cellular response to 100 ns pulsed electric fields (nsPEF) exposure includes the formation of transient nanopores in the plasma membrane and organelle membranes, an immediate increase in intracellular Ca2+, an increase in reactive oxygen species (ROS), DNA fragmentation and caspase activation. 100 ns, 30 kV/cm nsPEF stimulates an increase in ROS proportional to the pulse number. This increase is inhibited by the anti-oxidant, Trolox, as well as the presence of Ca2+ chelators in the intracellular and extracellular media. This suggests that the nsPEF-triggered Ca2+ increase is required for ROS generation.
Keywords: apoptosis, ablation, nanosecond pulses, ROS, nanoelectroablation
Introduction
Ultrashort, high voltage electric pulses in the nanosecond domain have been found to generate transient pores 1 nm in diameter in both the plasma membrane [6;13;19] and intracellular organelle membranes [1; 26] with a lifetime of several minutes. These nanopores lead to a rapid increase in intracellular Ca2+ ([Ca2+]i) from extracellular Ca2+ influx as well as Ca2+ release from the endoplasmic reticulum. In addition, water influx leads to swelling and bleb formation [21]. Downstream changes observed following nanosecond pulsed electric field (nsPEF) application include most of the events normally referred to as apoptosis, including reactive oxygen species (ROS) generation [20], caspase activation [4;8;22] and DNA fragmentation [14;27]. These observations have led to the use of nsPEF in cancer therapy to ablate tumors [2;7;11;14-18] which we have called “nanoelectroablation”.
We are very interested in the signal transduction pathway involved in nanoelectroablation. What are the critical steps leading to apoptosis following nsPEF exposure? The [Ca2+]i increase is probably a key step since this Ca2+ change is observed immediately after the pulse and a change in intracellular Ca2+ is known to influence so many cellular processes. We want to determine if the [Ca2+]i increase is required for any of the other downstream changes observed following nsPEF exposure. ROS generation begins within a minute after nsPEF exposure and continuously increases for over an hour [20]. This could be important for subsequent cellular changes since ROS is known to trigger DNA damage [29] and mitochondrial membrane permeabilization [10]. Here we present studies using both intracellular and extracellular Ca2+ chelators that suggest that the nsPEF-triggered increase in [Ca2+]i is required for ROS generation.
Materials and Methods
Cell lines
BxPC-3 cells were purchased from ATCC (Manassas, Virginia). Cells were maintained in exponential growth in RPMI-1640 medium supplemented with 10% fetal bovine serum and 5% penicillin-streptomycin. They were maintained in 37°C/5% CO2 incubator.
Detecting Reactive Oxygen Species
Reactive oxygen species generation was detected by using Image-iT™ LIVE Green Reactive Oxygen Species Detection Kit which was purchased from Invitrogen (Carlsbad, CA). Carboxy-H2DCFDA (carboxy-2′,7′–dichlorofluorescein diacetate), a fluorogenic marker, is cell-permeant and is trapped inside the cell when it is deacetylated by cellular esterases. The reduced form, carboxy-DCFH, is oxidized by any presence of ROS to form carboxy-DCF which is fluorescent. Some minor changes were made to the manufacture's protocol for optimal imaging. The cells were labeled with carboxy-H2DCFDA (25 μM) in HBSS/Ca2+/Mg2+ at 37°C in the dark for 1 hour. After being washed twice, the cells were resuspended in HBSS/Ca2+/Mg2+ and were ready for nsPEF treatment. For a positive control, cells incubated with either 1 mM H2O2 or 10 mM ethanol in HBSS/Ca2+/Mg2+ for 1 hour in dark at 37 °C prior to labeling with fluorescent dye were also exposed to the same electric field.
Inhibition effect of antioxidant
In order to demonstrate that we were measuring reactive oxygen species, we compared our signals with cells that were pretreated with 1 mM Trolox C (6-hydroxy-2,2,5,7,8-pentamethylchroman) (EMD Millipore, Billerica, MA) for 1 hour at 37 °C followed by a wash. This antioxidant prevents oxidation by scavenging free radicals.
Ca2+-dependence of ROS
In order to observe the Ca2+-dependence of ROS production, two chelators were used. BAPTA-AM (Invitrogen, Carlsbad, CA) was used to chelate intracellular Ca2+ (Ca2+i), while EGTA (Invitrogen, Carlsbad, CA) was used to chelate any extracellular Ca2+ (Ca2+o). Four conditions were tested: 1) Normal Ca2+ inside and out, 2) EGTA added to chelate Ca2+o; 3) BAPTA-AM pretreatment to chelate Ca2+i; 4) Both EGTA outside and pre-loading with BAPTA-AM to chelate Ca2+i One μM BAPTA-AM and 1X PowerLoad (Invitrogen) were added along with 25 μM carboxy-H2DCFDA in HBSS/ Ca2+/Mg2+ for 1 hour in the dark at room temperature before washing and resuspending. Ca2+o was chelated after ROS dye incubation and washing by adding 5 mM Na-EGTA (pH 7.4) 5 minute before nsPEF stimulation.
Slide Chamber
Two pieces of 3 mm × 6 mm platinum foil (25 μm thick) were cut and their edges polished with polishing paper. The platinum foil pieces were attached to the coverslip with paraffin with their polished edges facing each other. The slide was removed from the hot plate after the gap between the two pieces was adjusted to the desired width by positioning the platinum pieces under the microscope. Excess paraffin within the channel of the metal electrodes was removed with acetone. Three μl of cells at a concentration of 105 cells/ml were loaded into the 100 μm-wide gap between two sheets of platinum foil on the coverslip glass chamber. A glass coverslip (round, 12 mm) was placed over the gap to reduce evaporation.
NsPEF Pulse Generator
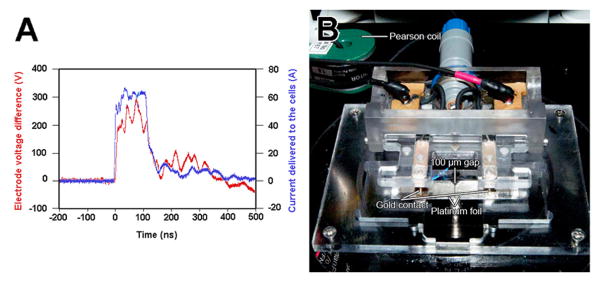
The pulse generator used is capable of generating 100 ns pulses up to 1 kV in amplitude. It does this by charging and then rapidly discharging a pulse forming network (PFN) in the Blumlein configuration. This PFN was built using a small coaxial cable (RG-174/U) as a transmission line. The length of the cable used to generate the 100 ns pulse was 65 ft. This cable was loosely wound into a coil approximately 6″ in diameter so that it could be easily enclosed in a portable, shielded box. The high voltage power supply charging this PFN is an EMCO G10 (Sutter Creek, CA). This power supply charges the PFN through a large 10M resistor placed in series with the PFN at the power supply output. To adjust the HV power supply control voltage, we use a digital potentiometer (AD7376). In order to rapidly discharge the PFN (generating the pulse), a 1kV RF N-Channel MOSFET (DE275-102N06A) was driven by an RF FET driver (DEIC420). When this FET discharges the voltage on the PFN, the 100 ns pulse is generated and delivered to the load (fig. 1A) with an impedance-matching resistor placed in parallel with the load.
Figure 1.
Microscope stage-mounted slide holder with contact electrodes and waveform. A. Oscilloscope trace of the 100 ns long voltage (red) and current (blue) pulse applied to the cells using the chamber on the right. B. Chamber that mounts on the microscope stage to apply the pulse to the cells in the 100 μm-wide gap between two pieces of Pt foil.
Spring-loaded gold contacts press onto the metal pads for electrical contact to the output cabling from the pulse generator (fig. 1B). By placing a current sensor on one of the wires to the load, the current delivered to the load was also recorded (fig. 1A). This system was isolated and powered by a 16.8 V, 2300 mAh NiMH rechargeable battery to prevent applying noise onto the mains power. All communication to the system was done via fiber optic from a user control box. The user may adjust the output (charging) voltage, the pulse frequency and the number of pulses to be delivered. For all experiments mentioned, 100 ns, 30 kV/cm pulses were delivered at a frequency of 5 pps to BxPC-3 cells.
Data acquisition
The carboxy-H2DCFDA fluorescence is optimally excited at 492 nm. To observe the fluorescence changes in the cells, digital images were taken before, during, and after the cells have received nsPEF treatment. The slide chamber holding the cells was placed on a microscope (Olympus IX71 inverted using 100X 1.30 NA objective). A cooled CCD camera (Pixera Penguin Model 600CL, Santa Clara, CA) with 24 bit resolution was mounted onto the microscope. LabVIEW (National Instruments, Austin, TX) was used to control the excitation light shutter (VCM-D1, Vincent Associates, Rochester, NY) to open at pre-determined rates (1 sec every minute, 5 sec every minute, 5 sec every 15 sec), as well as image acquisition. Fluorescence images were taken with the camera in fixed gain mode using a ½ second exposure to avoid any auto-adjustment of the gain. In order to avoid this photo-activation of the dye artifact, we limited the fluorescent light exposure to 1 s for each time point and only collected one time point per minute.
Photon counting was accomplished with a photomultiplier (PMT-100, Applied Scientific Instrumentation, Eugene OR). The photomultiplier was mounted on the camera port of the inverted fluorescence microscope (Model IX71, Olympus Corp., Center Valley, PA) with a beam splitter that directed infrared to a video camera to enable selection of the region of interest (ROI) and ROS fluorescence from the ROI to the photomultiplier for photon counting. The fluorescence light shutter was opened for a fixed amount of time under LabVIEW control (National Instruments, Austin, TX) and the photomultiplier generated a voltage signal proportional to the photons emitted. The photomultiplier gain used was 6-7 for optimal signal with minimal overexposure and the data were logged using a program written in LabVIEW.
Statistical analysis
Each experiment was repeated at least three times. Data collected on the Olympus microscope was analyzed with the use of Image J and plotted in graphs as level of gray. Voltage data acquired from the photomultiplier were converted to photons/s using calibrations curves supplied with the photomultiplier.
Results
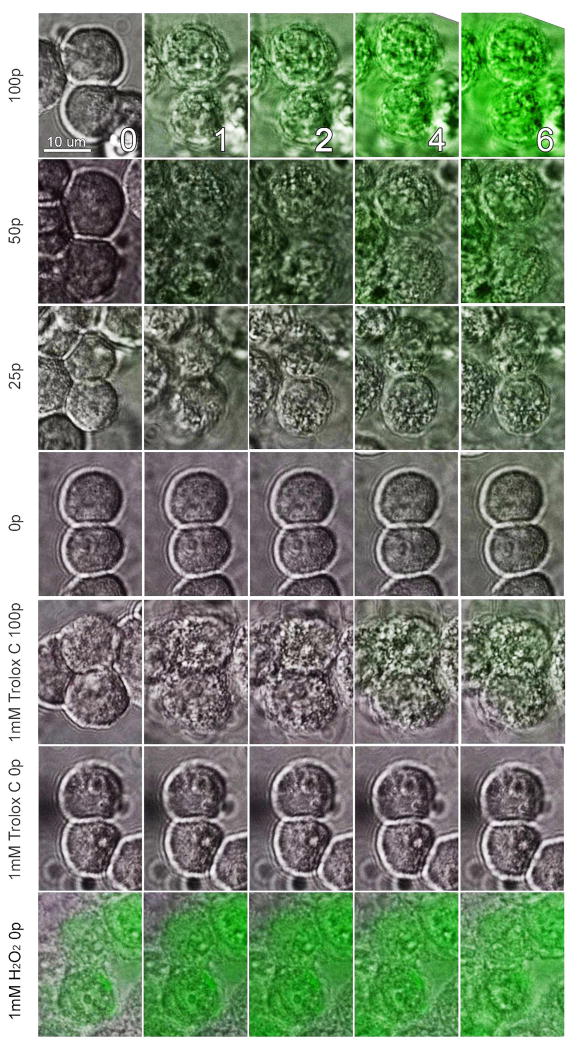
Since the ROS-sensitive dye, carboxy-H2DCF, is known to be photoactivated [20], we limited the exposure time to excitation light to either 1 or 5 s per min. We also performed both positive controls with H2O2 and negative controls with the antioxidant, Trolox C (a water soluble vitamin E analog) (fig. 2). The positive control gave a very strong ROS signal, and when cells were pre-incubated with 1 mM Trolox C for 1 hour, reactive oxygen species production was strongly inhibited (P<0.001), supporting our conclusion that this signal represents ROS.
Figure 2.
Superimposed DIC and Fluorescence images of BxPC-3 cells that have been loaded with Carboxy-H2DCFDA and exposed to the indicated number of 100 ns pulses at 30 kV/cm at 5 pps. Images were taken at the minutes after nsPEF exposure indicated by the numbers in the top row. Fluorescence excitation was limited to a 5 s exposure once per minute and each fluorescence image was acquired in 0.5 s.
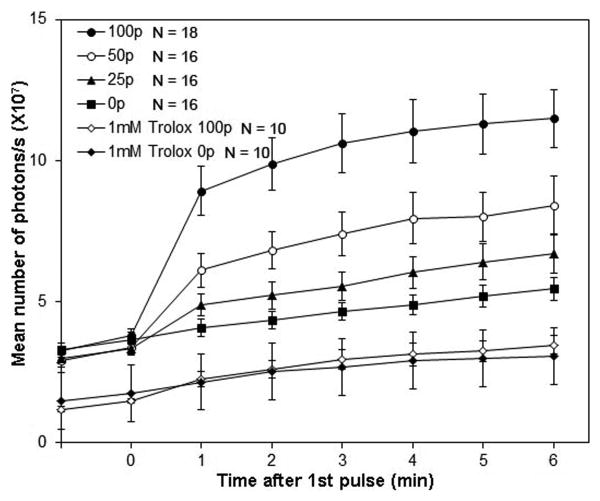
The application of 30 kV/cm, 100 ns pulses at 5 pps to BxPC-3 cells caused the oxidation of H2DCF, presumably from ROS production (fig. 2). ROS levels in nsPEF- exposed cells progressively increased over time (Fig. 2, 3) and were proportional to the number of nsPEF pulses applied (Table 1)
Figure 3.
Mean ROS increase following the indicated number of 100 ns pulses at 30 kV/cm. A fluorescence image was captured during a 5 s exposure once every minute. Error bars represent SEM with N=5.
Table 1.
Increase in carboxy-DCF fluorescence 6 min after nsPEF exposure under the indicated conditions.
| Condition | % increase |
|---|---|
| 1 mM Trolox C/0p | 4.9 |
| 1 mM Trolox C/100 p | 7.2 |
| 0 p | 6.0 |
| 25 p | 100 |
| 50 p | 267 |
| 100 p | 458 |
We also measured the level of carboxy-H2DCF fluorescence with the more sensitive photomultiplier tube. The resting ROS signal in unstimulated cells (3.6±0.2 × 10⁷ photons/s) was reduced 2.5-fold by pretreatment with 1 mm Trolox C (1.4±0.1 × 10⁷ photons/s). After stimulating with 100 pulses, the number of photons from a single BxPC-3 cell, pretreated with 1 mM Trolox C doubled to 2.7±0.2 × 10⁷ photons/s, while the number of photons from untreated cells increased nearly 3-fold to 10.4±1.1 × 10⁷ with a p value < 0.001. By 6 minutes after nsPEF exposure, the mean number of photons/s was 4.2±0.2 × 10⁷ and 13.6±1.4 × 10⁷ photons/s in unstimulated and stimulated cells, respectively, with p-value < 0.001.
A similar result was observed with fluorescence imaging (figure 3). The mean fluorescence intensity increased most steeply in nsPEF-treated cells and those pretreated with 1 mM Trolox C began exhibited a much weaker response. 10 μM Trolox C had no significant effect on ROS formation.
Ca2+-Dependence of ROS
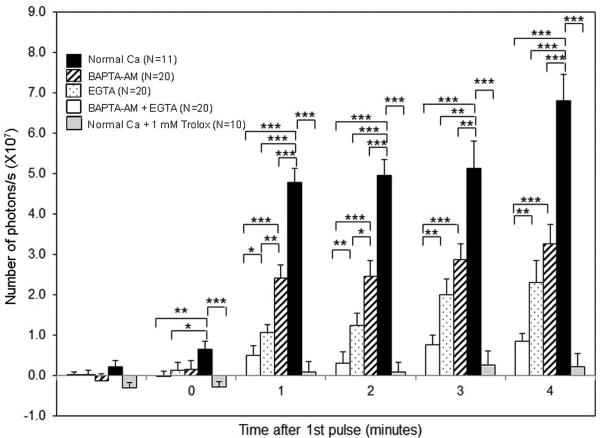
Next, we investigated the role of Ca2+ in the production of ROS by chelating intracellular and extracellular Ca2+ ROS stimulation was greatest under normal Ca2+ conditions. When BAPTA-AM was used to chelate intracellular Ca2+, ROS production was reduced by a factor of two. However, since extracellular Ca2+ can enter through the nanopores induced in the plasma membrane by the pulses we would expect it to exceed the buffering capacity of the internal BAPTA. The only way to prevent this is to buffer extracellular Ca2+ as well. When EGTA is used to chelate extracellular Ca2+alone, ROS production is even lower than that when Ca2+i was chelated. However, when both intracellular and extracellular Ca2+ were chelated the ROS level dramatically dropped to 90-94% of control levels (fig. 4). These results suggest that Ca2+ plays an important role in the nsPEF-triggered increase in ROS in BxPC-3 cells.
Figure 4.
Ca2+-dependence of nsPEF-stimulated ROS fluorescence. For each case, 100 pulses (100 ns, 30 kV/cm) were applied and the fluorescence was measured during 1 second of excitation light exposure to a single cell at the time indicated. The mean background signal was subtracted from each mean measured signal. The probabilities that any of the indicated pairs are not significantly different are indicated by the asterisks: * p < 0.05. **p < 0.01, *** p < 0.001. Each bar represents the mean response of at least four independent experiments and the error bars represent the SEM.
Discussion
New Findings
We show here that ROS generation is triggered by nsPEF treatment in human pancreatic cancer cells. We have used conditions that minimize photoactivation of the ROS-sensing fluorescent dye as indicated by the insignificant increase in ROS in cells imaged without pulsing (fig. 3). The inhibition of the fluorescent signal by the antioxidant, Trolox, provides further evidence that this signal represents ROS. Most significantly, we find that this ROS increase can be greatly inhibited by preventing the normal nsPEF-induced increase in intracellular Ca2+.Since the increase in ROS is required for normal apoptosis [25], this Ca2+-dependence suggests that the nsPEF-induced Ca2+ increase is required for apoptosis and is one of the earliest steps in the apoptotic pathway.
Previous Work
Pakhomova, et al. [20] were the first to report ROS generation by nsPEF exposure to cells in culture. They also found that the amount of ROS generated increased with increasing pulse number and continued to increase for over an hour after nsPEF exposure. Two earlier reports that failed to detect ROS generation following 10 pulses 300 ns long used a flow cytometer. Perhaps the ROS-sensitive dye leaked out of those cells during the transfer [8;22].
ROS generation was also detected following the much longer, microsecond pulsed field application as well and this also appears to depend on an increase in intracellular Ca2+ [5;9;24]. However this microsecond pulsed field response does not usually result in apoptosis. Therefore, the ROS increase alone is probably insufficient to trigger apoptosis. Since one difference between the microsecond pulses and nanosecond pulses is the ability of the latter to penetrate into the cytoplasm, some other cytoplasmic target may also be required. Recently Beebe's group reported that the nsPEF-triggered mitochondrial depolarization is the best predictor of cell death [3;23]. This involvement of mitochondria in apoptosis was also proposed by Weaver [28] who suggested that overloading mitochondria with Ca2+ via multiple pulses would lead to swelling and bursting to release cytochrome C and trigger caspase activation.
Targets of ROS
There are at least three known targets of ROS in apoptosis: 1) ROS is known to cause chromatin dysfunction such as single and double strand DNA fragmentation [12;29]. 2) Recently Bid-induced mitochondrial membrane permeabilization was shown to occur in waves propagated by ROS signaling [10]; 3) FAS-mediated apoptosome formation is dependent on ROS [25]. There is much work to be done to determine which if any of these possible targets are affected by the nsPEF-induced ROS increase.
Highlights.
100 ns, 30 kV/cm electric pulses stimulate an increase in reactive oxygen species (ROS) in human pancreatic carcinoma cells.
This ROS increase is proportional to the number of pulses applied.
This ROS increase is inhibited by blocking the increase in intracellular Ca2+ and by the presence of the anti-oxidant, Trolox.
Acknowledgments
We thank Andrei Pakhomov for his advice on the photo-activation of Carboxy-H2DCFDA. This work was supported by NIH Grants R01CA125722 and R44CA150484 to RN.
Footnotes
Publisher's Disclaimer: This is a PDF file of an unedited manuscript that has been accepted for publication. As a service to our customers we are providing this early version of the manuscript. The manuscript will undergo copyediting, typesetting, and review of the resulting proof before it is published in its final citable form. Please note that during the production process errors may be discovered which could affect the content, and all legal disclaimers that apply to the journal pertain.
References
- 1.Batista NT, Wu YH, Gundersen MA, Miklavcic D, Vernier PT. Nanosecond electric pulses cause mitochondrial membrane permeabilization in Jurkat cells. Bioelectromagnetics. 2012;33:257–264. doi: 10.1002/bem.20707. [DOI] [PubMed] [Google Scholar]
- 2.Beebe SJ, Chen X, Liu JA, Schoenbach KH. Nanosecond pulsed electric field ablation of hepatocellular carcinoma. Conf Proc IEEE Eng Med Biol Soc. 2011:6861–5. doi: 10.1109/IEMBS.2011.6091692. (2011) 6861-6865. [DOI] [PubMed] [Google Scholar]
- 3.Beebe SJ, Chen YJ, Sain NM, Schoenbach KH, Xiao S. Transient features in nanosecond pulsed electric fields differentially modulate mitochondria and viability. PLoS One. 2012;7:e51349. doi: 10.1371/journal.pone.0051349. [DOI] [PMC free article] [PubMed] [Google Scholar]
- 4.Beebe SJ, Fox P, Rec LJ, Somers K, Stark RH, Schoenbach KH. Nanosecond pulsed electric field (nsPEF) effects on cells and tissues: Apoptosis induction and tumor growth inhibition. IEEE Transactions on Plasma Science. 2002;30:286–292. [Google Scholar]
- 5.Bonnafous P, Vernhes M, Teissie J, Gabriel B. The generation of reactive-oxygen species associated with long-lasting pulse-induced electropermeabilisation of mammalian cells is based on a non-destructive alteration of the plasma membrane. Biochim Biophys Acta. 1999;1461:123–134. doi: 10.1016/s0005-2736(99)00154-6. [DOI] [PubMed] [Google Scholar]
- 6.Bowman AM, Nesin OM, Pakhomova ON, Pakhomov AG. Analysis of plasma membrane integrity by fluorescent detection of Tl(+) uptake. J Membr Biol. 2010;236:15–26. doi: 10.1007/s00232-010-9269-y. [DOI] [PMC free article] [PubMed] [Google Scholar]
- 7.Chen XH, Beebe SJ, Zheng SS. Tumor ablation with nanosecond pulsed electric fields. Hepatobiliary Pancreat Dis Int. 2012;11:122–124. doi: 10.1016/s1499-3872(12)60135-0. [DOI] [PubMed] [Google Scholar]
- 8.Ford WE, Ren W, Blackmore PF, Schoenbach KH, Beebe SJ. Nanosecond pulsed electric fields stimulate apoptosis without release of pro-apoptotic factors from mitochondria in B16f10 melanoma. Arch Biochem Biophys. 2010;497:82–89. doi: 10.1016/j.abb.2010.03.008. [DOI] [PubMed] [Google Scholar]
- 9.Gabriel B, Teissie J. Generation of reactive-oxygen species induced by electropermeabilization of Chinese hamster ovary cells and their consequence on cell viability. Eur J Biochem. 1994;223:25–33. doi: 10.1111/j.1432-1033.1994.tb18962.x. [DOI] [PubMed] [Google Scholar]
- 10.Garcia-Perez C, Roy SS, Naghdi S, Lin X, Davies E, Hajnoczky G. Bid-induced mitochondrial membrane permeabilization waves propagated by local reactive oxygen species (ROS) signaling. Proc Natl Acad Sci U S A. 2012;109:4497–4502. doi: 10.1073/pnas.1118244109. [DOI] [PMC free article] [PubMed] [Google Scholar]
- 11.Garon EB, Sawcer D, Vernier PT, Tang T, Sun Y, Marcu L, Gundersen MA, Koeffler HP. In vitro and in vivo evaluation and a case report of intense nanosecond pulsed electric field as a local therapy for human malignancies. Int J Cancer. 2007;121:675–682. doi: 10.1002/ijc.22723. [DOI] [PubMed] [Google Scholar]
- 12.Higuchi Y. Glutathione depletion-induced chromosomal DNA fragmentation associated with apoptosis and necrosis. J Cell Mol Med. 2004;8:455–464. doi: 10.1111/j.1582-4934.2004.tb00470.x. [DOI] [PMC free article] [PubMed] [Google Scholar]
- 13.Nesin OM, Pakhomova ON, Xiao S, Pakhomov AG. Manipulation of cell volume and membrane pore comparison following single cell permeabilization with 60- and 600-ns electric pulses. Biochim Biophys Acta. 2011;1808:792–801. doi: 10.1016/j.bbamem.2010.12.012. [DOI] [PMC free article] [PubMed] [Google Scholar]
- 14.Nuccitelli R, Chen X, Pakhomov AG, Baldwin WH, Sheikh S, Pomicter JL, Ren W, Osgood C, Swanson RJ, Kolb JF, Beebe SJ, Schoenbach KH. A new pulsed electric field therapy for melanoma disrupts the tumor's blood supply and causes complete remission without recurrence. Int J Cancer. 2009;125:438–445. doi: 10.1002/ijc.24345. [DOI] [PMC free article] [PubMed] [Google Scholar]
- 15.Nuccitelli R, Pliquett U, Chen X, Ford W, James SR, Beebe SJ, Kolb JF, Schoenbach KH. Nanosecond pulsed electric fields cause melanomas to self-destruct. Biochem Biophys Res Commun. 2006;343:351–360. doi: 10.1016/j.bbrc.2006.02.181. [DOI] [PMC free article] [PubMed] [Google Scholar]
- 16.Nuccitelli R, Tran K, Athos B, Kreis M, Nuccitelli P, Chang KS, Epstein EH, Jr, Tang JY. Nanoelectroablation therapy for murine basal cell carcinoma. Biochem Biophys Res Commun. 2012;424:446–450. doi: 10.1016/j.bbrc.2012.06.129. [DOI] [PMC free article] [PubMed] [Google Scholar]
- 17.Nuccitelli R, Tran K, Lui K, Huynh J, Athos B, Kress M, Nuccitelli P, De Fabo EC. Non-thermal Nanoelectroablation of UV-Induced Murine Melanomas Stimulates an Immune Response. Pigment Cell Melanoma Res. 2012;25:618–629. doi: 10.1111/j.1755-148X.2012.01027.x. [DOI] [PMC free article] [PubMed] [Google Scholar]
- 18.Nuccitelli R, Tran K, Sheikh S, Athos B, Kreis M, Nuccitelli P. Optimized nanosecond pulsed electric field therapy can cause murine malignant melanomas to self- destruct with a single treatment. Int J Cancer. 2010;127:1727–1736. doi: 10.1002/ijc.25364. [DOI] [PMC free article] [PubMed] [Google Scholar]
- 19.Pakhomov AG, Kolb JF, White JA, Joshi RP, Xiao S, Schoenbach KH. Long-lasting plasma membrane permeabilization in mammalian cells by nanosecond pulsed electric field (nsPEF) Bioelectromagnetics. 2007;28:655–663. doi: 10.1002/bem.20354. [DOI] [PubMed] [Google Scholar]
- 20.Pakhomova ON, Khorokhorina VA, Bowman AM, Rodaite-Riseviciene R, Saulis G, Xiao S, Pakhomov AG. Oxidative effects of nanosecond pulsed electric field exposure in cells and cell-free media. Archives. Biochem Biophys. 2012;527:55–64. doi: 10.1016/j.abb.2012.08.004. [DOI] [PMC free article] [PubMed] [Google Scholar]
- 21.Rassokhin MA, Pakhomov AG. Electric Field Exposure Triggers and Guides Formation of Pseudopod-Like Blebs in U937 Monocytes. J Membr Biol. 2012;245:521–529. doi: 10.1007/s00232-012-9433-7. [DOI] [PMC free article] [PubMed] [Google Scholar]
- 22.Ren W, Beebe SJ. An apoptosis targeted stimulus with nanosecond pulsed electric fields (nsPEFs) in E4 squamous cell carcinoma. Apoptosis. 2011;16:382–393. doi: 10.1007/s10495-010-0572-y. [DOI] [PMC free article] [PubMed] [Google Scholar]
- 23.Ren W, Sain NM, Beebe SJ. Nanosecond pulsed electric fields (nsPEFs) activate intrinsic caspase-dependent and caspase-independent cell death in Jurkat cells. Biochem Biophys Res Commun. 2012;421:808–812. doi: 10.1016/j.bbrc.2012.04.094. [DOI] [PubMed] [Google Scholar]
- 24.Sabri N, Pelissier B, Teissie J. Electropermeabilization of intact maize cells induces an oxidative stress. Eur J Biochem. 1996;238:737–743. doi: 10.1111/j.1432-1033.1996.0737w.x. [DOI] [PubMed] [Google Scholar]
- 25.Sato T, Machida T, Takahashi S, Iyama S, Sato Y, Kuribayashi K, Takada K, Oku T, Kawano Y, Okamoto T, Takimoto R, Matsunaga T, Takayama T, Takahashi M, Kato J, Niitsu Y. Fas-mediated apoptosome formation is dependent on reactive oxygen species derived from mitochondrial permeability transition in Jurkat cells. J Immunol. 2004;173:285–296. doi: 10.4049/jimmunol.173.1.285. [DOI] [PubMed] [Google Scholar]
- 26.Schoenbach KH, Beebe SJ, Buescher ES. Intracellular effect of ultrashort electrical pulses. Bioelectromagnetics. 2001;22:440–448. doi: 10.1002/bem.71. [DOI] [PubMed] [Google Scholar]
- 27.Stacey M, Stickley J, Fox P, Statler V, Schoenbach K, Beebe SJ, Buescher S. Differential effects in cells exposed to ultra-short, high intensity electric fields: cell survival, DNA damage, and cell cycle analysis. Mutat Res. 2003;542:65–75. doi: 10.1016/j.mrgentox.2003.08.006. [DOI] [PubMed] [Google Scholar]
- 28.Weaver JC, Smith KC, Esser AT, Son RS, Gowrishankar TR. A brief overview of electroporation pulse strength-duration space: A region where additional intracellular effects are expected. Bioelectrochemistry. 2012;87:236–243. doi: 10.1016/j.bioelechem.2012.02.007. [DOI] [PMC free article] [PubMed] [Google Scholar]
- 29.Weyemi U, Dupuy C. The emerging role of ROS-generating NADPH oxidase NOX4 in DNA-damage responses. Mutat Res. 2012;751:77–81. doi: 10.1016/j.mrrev.2012.04.002. [DOI] [PubMed] [Google Scholar]


