Abstract
A conventional electron capture dissociation (ECD) spectrum of a protein is uniquely characteristic of the first dimension of its linear structure. This sequence information is indicated by summing the primary cm+ and zm+• products of cleavage at each of its molecular ion's inter-residue bonds. For example, the ECD spectra of Ubiquitin (M + nH)n+ ions, n = 7-13, provide sequence characterization of 72 of its 75 cleavage sites from 1843 ions in seven c(1-7)+ and eight z(1-8)+• spectra and their respective complements. Now we find that each of these c/z spectra is itself composed of “charge site (CS)” spectra, the cm+ or zm+• products of electron capture at a specific protonated basic residue. This charge site has been H-bonded to multiple other residues, producing multiple precursor ion forms; ECD at these residues yields the multiple products of that CS spectrum. Closely similar CS spectra are often formed from a range of charge states of Ubiquitin and KIX ions; this indicates a common secondary conformation, but not the conventional α-helicity postulated previously. CS spectra should provide new capabilities for comparing regional conformations of gaseous protein ions and delineating ECD fragmentation pathways.
Introduction
Electron capture dissociation (ECD) [1] has become a crucial tool for detailed characterization of protein ions produced by electrospray ionization (ESI) [2]. Compared to vibrational dissociation methods, ECD cleaves a far higher proportion of inter-residue bonds while minimizing the dissociation of post-translational modifications and tertiary noncovalent bonding [1, 3, 4]. ECD cleavage of the linear molecular ion (M + nH)n+ yields cm+ and complementary zm+• ions; for the yield from a cleavage site, the conventional ECD spectrum sums the abundances of both products for all n and m values. We consider separately these component cm+ and zm+• spectra; a spectrum of specific m value (e.g., c1+) is itself an additive combination of yet more fundamental data, proposed here as “charge site (CS)” mass spectra. Ionic hydrogen bonding of a specific charge site to neighboring residues is proposed to produce multiple intermediate ion forms, whose electron capture then yields that charge site's CS spectrum. For many Ubiquitin c/z ions the same CS spectrum is found from precursors of widely varying total charge; this is consistent with their common secondary conformation, but not the α-helices previously postulated [6-8]. Characterization of tertiary conformation by its resistance to ECD is already well known [3-10].
As recently reviewed [5], “the extent to which proteins in the gas phase retain their condensed phase structure is a hotly debated issue”, and is critical for determining protein:adduct solution stabilities using ESI/MS [11]. Recently the retention of KIX tertiary structure during ESI was demonstrated by ECD [9].
Experimental
The cm+, zm+• data used here were measured 0.2 s or 5 s after ESI in a 7 T Fourier-transform mass spectrometer (Bruker) for ECD spectra reported in recent studies [9, 10]. These contain complete experimental details.
Results and Discussion
The ECD spectra from (M + nH)n+ ions (n = 7-13) of Ubiquitin (76 residues) [10] list 1843 cm+ and zm+• product ions from cleavage of 72 of its inter-residue sites (three sites on the N-terminal side of proline resist cleavage). In Figure S1, relative abundances of each cm+ and zm+• ion are plotted separately by precursor and fragment ion charge state versus cleavage site (cm+, sites 1-42; zm+•, sites 30-75). These data show extensive vertical correlations.
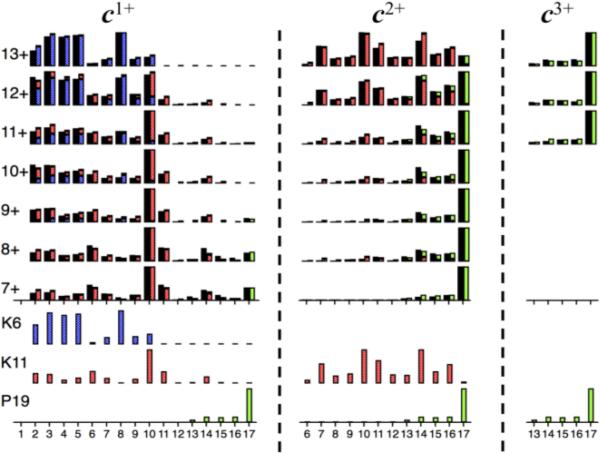
Thus for c1+ fragments from ECD cleavage at sites 2-12 (Figure 1, black bars), the 7+ to 9+ precursors yield c1+ abundances that are surprisingly similar, while those from the 10+ to 12+ ions become increasingly like those from the 13+ ions. In fact, all seven c1+ 2-12 spectra match well for changing proportions of just the two c1+ spectra from the 7+ and 13+ ions. In a similar fashion, the c1+ peaks for the 13-17 cleavage sites can result from two component spectra, one accounting for most of the 15-17 peaks. Mathematical deconvolution [12] of the 7+ to 13+ c1+ data of sites 2-17 gives three component spectra, bottom left Figure 1. Using these, predicted c1+ abundances of the 7+ to 13+ c1+ spectra (segmented colored bars) fit the experimental values to ≤3%. This proportional additivity of component reference spectra that yields the spectrum of the corresponding mixture is the classic Beer's law behavior long established for spectroscopic methods (e.g., visible, UV, IR) [12] as well as for MS [13]).
Figure 1.
Relative abundances of c1+ to c3+ ions (black bars) from ECD of Ubiquitin (M + nH)n+ ions (n = 7-13) for cleavage sites 2-17. Calculated “CS spectra” (bottom) for charge sites K6, K11, and P19 give predicted abundance values shown as segmented colored bars fused on right of black bars.
These new reference mass spectra are named here “charge site (CS)” spectra based on their apparent source (Scheme) in which the protonated basic residue forms an ionic H-bond to a nearby amide carbonyl group (Lys, Arg, and His should show similar behavior, but not Pro). Electron capture neutralizes the charge and cleaves the backbone N-Cα bond [4]. The possible basic sites of Ubiquitin from Williams’ calculations [14] are N-terminus (and/or Q2), K6, K11, and P19; the first cannot generate spectra of small c1+ ions because its electron capture produces uncharged c products for cleavages on the N-terminal side of K6. The three c1+ spectra (Figure 1, bottom left) have products from sites 2-10, 2-14, and 12-17, consistent with the CS spectra from intermediates of K6, K11, and P19, respectively, that have undergone electron capture. For the remaining protonation sites in these c1+ ions, the N-terminus is favored by charge repulsion, which also maximizes K6 charging in the 13+ precursor ions. Thus for these c1+ CS spectra, almost all arise from precursor ions with N-terminal protonation; the K6 spectrum is also protonated at K6; the K11 at K11, but not at K6; and P19 at P19, not at K6 or K11.
Scheme.

For c2+ ions (Figure 1), the K11 CS spectrum is shifted dramatically to higher masses. Now the K6 site is also protonated, repulsing the R-NH3+ side chain of K11 to H-bond farther toward the C–terminus (Scheme). But this double N-terminal protonation of the first three sites is much less for ≤11+ precursors, in which the P19 c2+ spectra dominate. The P19 c3+ spectrum requires N-terminal protonation at the first four sites and is quite similar to the c1+ and c2+ P19 spectra (Figure 1); proline lacks the charged side chain of Scheme. Thus the 1-19 N-terminal region yields six CS spectra, each from a precursor ion region of a specific distribution of 2 to 4 protons on its four basic residues and a specific electron capture site. Per the Scheme, that site's basic residue will have probabilities of H-bonding to multiple neighboring residues. Although the overall “conformation” of an ionized protein in the gas phase is thus complex, the reproducibility of a region's CS spectrum from differently charged precursor ions indicates a consistent “composite” secondary structure (tertiary structures are resistant to ECD).
Other Ubiquitin CS spectra
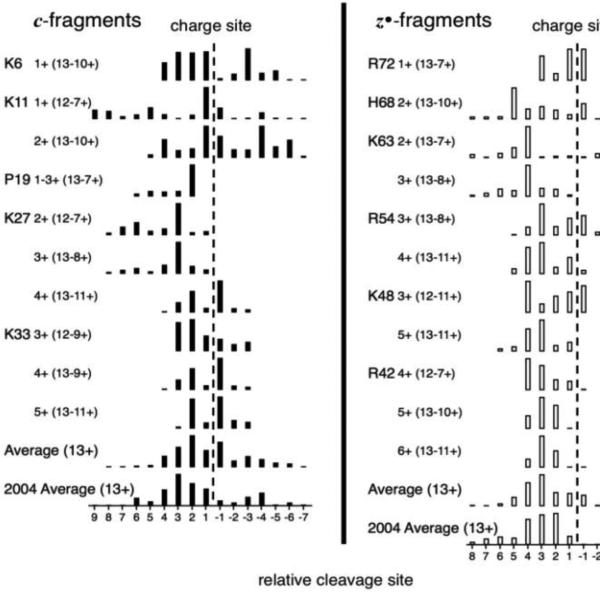
From Figure S1 this preliminary study found that 11 of the 14 charge sites form a CS spectrum that is the same from at least three of the 7+ to 13+ precursors (Figure 2). K29 is not listed, but its possible products are assigned to K27; CS spectra from the two termini are also difficult to identify (vide supra).
Figure 2.
CS spectra formed from at least three Ubiquitin ion charge states. “2004 Average” is from reference 8.
Conformational dependence of CS spectra
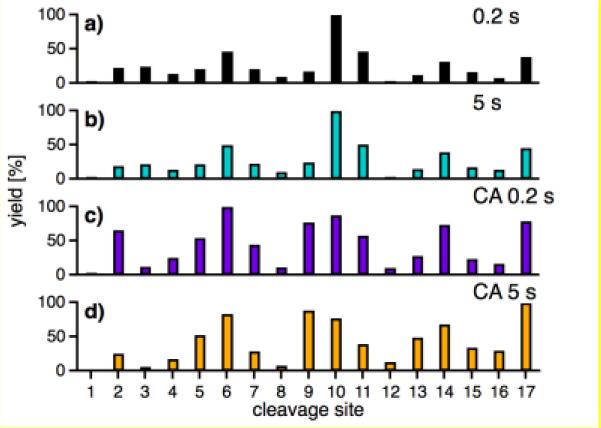
Changing the ECD measurement from 0.2 s to 5 s after ESI [10] for the 7+ ions causes virtually no change in the c1+ data (Figure 3). However, after 105 eV collisional activation of the 7+ ions, the c1+ spectrum is substantially modified. Increased peaks (e.g., 2, 5, 9, 14) represent relative increases in K6/K11/P19 ionic H-bonding (Scheme) at nearby residues, with further increases after 5 s; new secondary structures and/or unfolding are possible. As another example, the c3+ and z(n-4)+ data (Figure S1) of sites 24-35 change greatly from 7+ to 10+ precursors; sites 21-35 form an α-helix in solution [10].
Figure 3.
Relative abundances of c1+ ions from cleavage sites 1-17 of Ubiquitin 7+ ions after a (a) 0.2 and (b) 5 s delay prior to ECD; (c) causing CA with a 105V potential at the head of the second hexapole after a 0.2 s and (d) 5 s delay prior to ECD [10].
Earlier ECD studies of “mature” Ubiquitin ions (measured 40 s after ESI, not 0.2 s as here) postulated an α-helix structure for 13+ ions, with charge removal introducing bends and folding [6-8]. Of the evidence, those averages for c and z ions (Figure 2, bottom) have maxima thought to resemble the Scheme H-bonding probability for the 3.6 residue turn spacing of the α-helix [8]. However, the CS spectra of Ubiquitin (Figure 2) now make possible a more detailed evaluation of secondary structure. For the 13+ ions, the CS spectra of K6, K11, P19, K27, and K33 are all strikingly different from each other, indicating a much more intricate and far less uniform secondary structure than the previously postulated α-helix. Moreover, the average CS spectrum of the 13+ ions (Figure 2, second from bottom) does not show average “+3.6” cleavage but instead reveals, for example, abundant “−1” cleavage (the protonated side chain H-bonded to its own carbonyl). A distorted helix could possibly be formed (Scheme) by full proton transfer to the carbonyl, with resonance sharing of that charge with the amide nitrogen, with either charge position providing stabilization to a local helical structure. IR 3025-3775 cm−1 spectra of 7+ to 11+ Ubiquitin and other protein ions are dominated by strong N+-H vibrational absorptions [15], with side-chain N+-H ruled out by 15N labeling; theoretical modeling should be valuable.
Irrespective of the true secondary structure, if precursor ions of different charge states yield the same CS spectrum, in each precursor that region has the same collection of secondary structures, a collection that represents a composite of minimum energy arising from a specific distribution of protons on neighboring basic residues.
Protein KIX
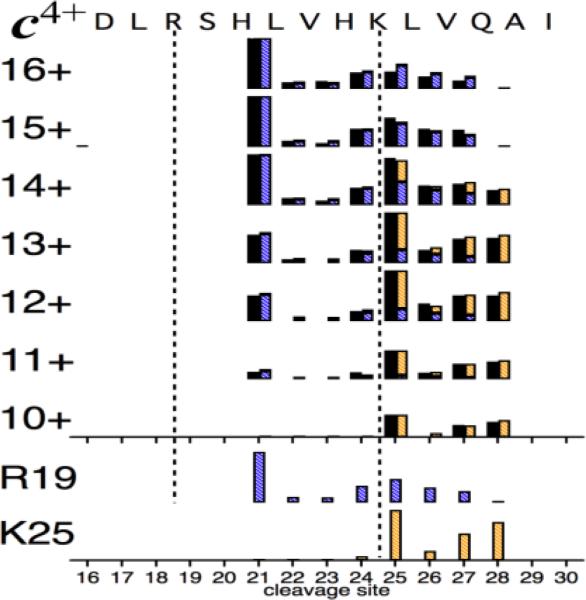
The 7+ to 16+ ECD spectra of the three-helix bundle protein KIX (91 residues) first demonstratedthe preservation of solution tertiary structure during ESI [9]. ECD of the 7+ ions yields no products from these α1 (residues 16-30), α2 (42-61), and α3 (65-88) helices. Increasing coulombic repulsion reflects their stabilities in solution: for 8+ ions, ECD peaks first appear in α1; 9+, α2; and 10+, α3. The partial c spectra (Figure S2) of the denatured gaseous ions also show vertical correlations, e.g., c4+ data (Figure 4) of sites 20-30 indicate varying amounts of two CS spectra from R19 (+ H21?) and K25 (+ H24?) for 10+ to 16+ precursors.
Figure 4.
Relative abundances (black bars) of c4+ fragments from ECD of KIX (M + nH)n+ ions (n = 10-16) [9]. Calculated CS spectra (bottom) for charge sites R19 and K25 give predicted abundance values shown as segmented colored bars fused on right of black bars; agreement with experimental values is 3.3 ±0.8%.
Complementary c/z ion data
Measurement of each of the ECD product pairs is subject to different efficiences. For example, the more highly charged z(n-m-2)+• and c(n-m-2)+ products (those closer to the N- and C-termini, respectively) are subject to greater loss from secondary electron capture [4]. Full utilization of complementary ion data requires further study.
Conclusions
We propose a fundamental form of local ECD data, the “charge site” mass spectrum, that represents the multiple cm+ or zm+• products of a specific m value resulting from electron captures at that protonated basic residue whose neighboring basic residues have a specific charging pattern. Apparently this can represent a composite secondary structure of minimum energy, as the same CS spectrum can be formed from many 7+ to 13+ Ubiquitin (Figures 1, 2, S1) and 8+ to 16+ KIX (Figures 4, S2) ions. Although the combinatorial conformation possibilities for the whole precursor are large, CS characterization of the secondary structure of individual regions now appears possible. CS spectra can provide detailed mechanistic information concerning the influence of neighboring composition and protonation on charge-site hydrogen bonding to backbone carbonyls and subsequent ionic H-bonding. This stabilization appears to be far more important in the gas phase than that of α-helical H-bonding, a supposition for which molecular dynamics simulations of protein gas phase structures could be of particular value.
Quantitative comparison of CS spectra should also provide a more rigorous test for the question “Do charge state signatures guarantee protein conformations?” [5]. With collisional activation causing a substantial conformational change (Figure 3) without change in the 7+ charge, the answer must be “no”.
Supplementary Material
Acknowledgments
We acknowledge funding by the Austrian Science Fund (FWF, Y372 to K.B.) and the General Medical Institute of the National Institutes of Health (GM16609 to F.W.M.).
Footnotes
Supporting Information
Additional information is available free of charge in the online version of this article. Figure S1 shows the cm+ and zm+• data for Ubiquitin; S2 shows cm+ data for KIX.
References
- 1.Zubarev RA, Kelleher NL, McLafferty FW. Electron capture dissociation of multiply charged protein cations. A nonergodic process. J. Am. Chem. Soc. 1998;120:3265–3266. [Google Scholar]
- 2.Fenn JB, Mann M, Meng CK, Wong SF, Whitehouse CM. Electrospray ionization for mass spectrometry of large biomolecules. Science. 1989;246:64–71. doi: 10.1126/science.2675315. [DOI] [PubMed] [Google Scholar]
- 3.Kelleher NL, Lin HY, Valaskovic GA, Aaserud DJ, Fridriksson EK, McLafferty FW. Top down versus bottom up protein characterization by tandem high-resolution mass spectrometry. J. Am. Chem. Soc. 1999;121:606–812. [Google Scholar]
- 4.Zubarev RA, Horn DM, Fridriksson EK, Kelleher NL, Kruger NA, Lewis MA, Carpenter BK, McLafferty FW. Electron capture dissociation for structural characterization of multiply charged protein cations. Anal. Chem. 2000;72:563–573. doi: 10.1021/ac990811p. [DOI] [PubMed] [Google Scholar]
- 5.Hall Z, Robinson CV. Do charge state signatures guarantee protein conformations? J. Am. Soc. Mass Spectrom. 2012;23:1161–1168. doi: 10.1007/s13361-012-0393-z. [DOI] [PubMed] [Google Scholar]
- 6.Oh H, Breuker K, Sze SK, Ge Y, Carpenter BK, McLafferty FW. Secondary and tertiary structures of gaseous protein ions characterized by electron capture dissociation mass spectrometry and photofragment spectroscopy. Proc. Natl. Acad. Sci. USA. 2002;99:15863–15868. doi: 10.1073/pnas.212643599. [DOI] [PMC free article] [PubMed] [Google Scholar]
- 7.Breuker K, Oh HB, Horn DM, Cerda BA, McLafferty FW. Detailed Unfolding and Folding of Gaseous Ubiquitin Ions Characterized by Electron Capture Dissociation. J. Am. Chem. Soc. 2002;124:6407–6420. doi: 10.1021/ja012267j. [DOI] [PubMed] [Google Scholar]
- 8.Breuker K, Oh HB, Lin C, Carpenter BK, McLafferty FW. Nonergodic and conformational control of the electron capture dissociation of protein cations. Proc. Natl. Acad. Sci. USA. 2004;101:14011–14016. doi: 10.1073/pnas.0406095101. [DOI] [PMC free article] [PubMed] [Google Scholar]
- 9.Breuker K, Brüschweiler S, Tollinger M. Electrostatic Stabilization of a Native Protein Structure in the Gas Phase. Angew. Chem. Int. Ed. 2011;50:873–877. doi: 10.1002/anie.201005112. [DOI] [PMC free article] [PubMed] [Google Scholar]
- 10.Skinner OS, McLafferty FW, Breuker K. How Ubiquitin unfolds after transfer into the gas phase. J. Am. Soc. Mass Spectrom. 2012;23:1011–1014. doi: 10.1007/s13361-012-0370-6. [DOI] [PMC free article] [PubMed] [Google Scholar]
- 11.Hofstadler SA, Sannes-Lowery KA. Applications of ESI-MS in drug discovery: interrogation of noncovalent complexes. Nature Reviews - Drug Discovery. 2006;5:585–595. doi: 10.1038/nrd2083. [DOI] [PubMed] [Google Scholar]
- 12.Liebhafsky HA, Pfeiffer HG. Beer's law in analytical chemistry. J. Chem. Ed. 1953;30:450. [Google Scholar]
- 13.Washburn HW, Wiley HF, Rock SM, Berry CE. Mass spectrometry. Ind. Eng. Chem. Anal. Ed. 1945;17:74–81. [Google Scholar]
- 14.Schnier PD, Gross DS, Williams ER. On the maximum charge state and proton transfer reactivity of peptide and protein ions formed by electrospray ionization. J. Am. Soc. Mass Spectrom. 1995;6:1086–1097. doi: 10.1016/1044-0305(95)00532-3. [DOI] [PubMed] [Google Scholar]
- 15.Kong X, Breuker K, McLafferty FW. IR Photodissociation Spectra of Gaseous Protein Ions: Hydrogen Bonding of Side-Chain Protonated Amino Groups is Unusually Strong.. 57th ASMS Conference on Mass Spectrometry and Allied Topics; 2009.p. WP425. [Google Scholar]
Associated Data
This section collects any data citations, data availability statements, or supplementary materials included in this article.


