

Abstract
Tropical tree communities are shaped by local-scale habitat heterogeneity in the form of topographic and edaphic variation, but the life-history stage at which habitat associations develop remains poorly understood. This is due, in part, to the fact that previous studies have not accounted for the widely disparate sample sizes (number of stems) that result when trees are divided into size classes. We demonstrate that the observed habitat structuring of a community is directly related to the number of individuals in the community. We then compare the relative importance of habitat heterogeneity to tree community structure for saplings, juveniles and adult trees within seven large (24–50 ha) tropical forest dynamics plots while controlling for sample size. Changes in habitat structuring through tree life stages were small and inconsistent among life stages and study sites. Where found, these differences were an order of magnitude smaller than the findings of previous studies that did not control for sample size. Moreover, community structure and composition were very similar among tree sub-communities of different life stages. We conclude that the structure of these tropical tree communities is established by the time trees are large enough to be included in the census (1 cm diameter at breast height), which indicates that habitat filtering occurs during earlier life stages.
Keywords: redundancy analysis, multivariate regression tree, beta diversity, topography, soil, Center for Tropical Forest Science
1. Introduction
Habitat filtering [1] is an important process that shapes ecological communities, and arises from species–habitat niches, or the inability of a species to persist in all environments [2]. In plant communities, habitat filtering refers to the non-random germination, establishment and survival of individuals with respect to variation in habitat characteristics. Many studies have supported the importance of habitat filtering via topographic–edaphic variation in tropical forests by documenting non-random patterns in tree species distributions and community compositional variation with respect topographic and edaphic variation over local to landscape scales [3–14].
Despite the importance of species–habitat niches and habitat heterogeneity in shaping tropical tree communities, the relative importance of habitat filtering through tree life stages is still poorly understood. By examining the degree of habitat structuring (expressed as the amount of community compositional variation explained by the environment) of tree sub-communities of different life stages, we may evaluate the relative importance of habitat filtering versus negative density dependence in governing the mortality of trees across life stages. If tree mortality from one life stage to the next is dominated by habitat filtering, we would expect the degree of habitat structuring to be greater for trees belonging to the later life stage. Alternatively, if tree mortality is random with respect to habitat, we would expect the degree of habitat structuring to be constant. Finally, if negative density dependence—due to either competitive effects or pest or pathogen pressure—is the dominant driver of tree mortality, we would expect the degree of habitat structuring to be diminished for trees belonging to the later life stage.
Recent examinations of the degree of habitat structuring across tree life stages have reached contrasting conclusions. In an analysis of the community–habitat associations for trees of different size classes and developmental stages in the Barro Colorado Island (BCI) 50-ha plot, Kanagaraj et al. [15] observed strong habitat structuring for juvenile trees, while new census recruits and reproductive-sized trees showed weak habitat structuring. This was suggested to be the result of strong habitat filtering acting upon trees at the transition from recruits to juveniles, followed by strong negative density dependence acting upon trees as they reach maturity. In another analysis, Punchi-Manage et al. [16] found similar community–habitat associations among new recruits, juveniles and adult trees in a Sri Lankan forest. This was interpreted as an indication of general stability of community–habitat associations through life stages in this forest, though the variation explained by the environment was much greater for juvenile trees. Finally, Hu et al. [17] found that the spatial structuring (which indicates the strength of environmental structuring and dispersal limitation combined) of a seasonal tropical forest in China was greatest among small trees and this decreased with increasing tree size.
However, a possible pitfall for community-level analyses of habitat structuring across tree life stages is the widely disparate sample sizes that result from splitting a tree community into sub-communities by diameter at breast height (dbh). Specifically, the number of large trees in a community is usually much less than the number of small stems. We expect the resolution of the community structure to decrease as the number of individuals in the sample decreases, weakening the signal of the community–habitat relationship. The number of individuals included in a census has been shown to significantly influence calculated beta diversity and the inferred relationship between a community and environmental variables [18–20]. However, this effect has not been accounted for in studies examining the influence of the environment through tree life stages, in which the most abundant size class nearly always shows the greatest amount of habitat or spatial structure [15–17].
An additional consideration is that the degree of habitat structuring of sub-communities of different size classes does not indicate whether habitat associations of individual species are consistent across life stages. Inconsistencies could be observed if, for example, seedlings or small individuals of a species have lower establishment or survival in the neighbourhood of adults [21,22]. Studies examining habitat associations at different life stages have found that significant habitat associations for a species at one life stage may not be present for the same species at a different life stage [21–23]. It is unclear, however, whether apparent differences in species–habitat associations across life stage have important effects at the community level.
We used the BCI 50-ha plot dataset to determine how the amount of observed habitat structuring varied with the number of trees sampled. We then compared the degree with which community structure is related to habitat heterogeneity in the form of topographic and soil resource variation across tree life stages for BCI and six additional large tropical forest plots from around the globe. We used random sampling of the sapling and juvenile communities to control for sample size differences among life stages, which may be thought of as simulating random survival of individuals in these life stages to the adult stage. If the degree of habitat structuring increases from earlier to later life stages, this would indicate that habitat filtering is an ongoing process that governs mortality across this transition. The absence of change from earlier to later life stages would indicate that neither habitat filtering nor negative density dependence is a dominant driver of tree mortality across this transition, and a decrease in habitat structuring would suggest the presence of negative density-dependent mortality. We also mapped the community compositional variation among the sapling, juvenile and adult sub-communities to gain a better understanding of the changes in community structure and composition across life stages.
2. Material and methods
(a). Study sites and census data
We used tree censuses from seven long-term tropical forest dynamics plots of the Center for Tropical Forest Science (CTFS) network: BCI, Panama [24,25]; Huai Kha Khaeng and Khao Chong, Thailand; Korup, Cameroon; La Planada, Colombia; Pasoh, Peninsular Malaysia and Yasuni, Ecuador. Within each plot, all free-standing trees larger than 1 cm dbh have been mapped, identified to species and measured for dbh according to a standard protocol [26]. Together, these plots represent a range of forest types, climate regimes, soil types and fertilities, and species richnesses (see table 1 for individual plot characteristics).
Table 1.
Vegetation and soil characteristics for the seven study sites.
| study site | size (ha) | species | forest type | soil order | soil variables used |
|---|---|---|---|---|---|
| BCI | 50 | 298 | semideciduous lowland moist | Oxisol | Al, B, Ca, Cu, Fe, K, Mg, Mn, Nmin, P, Zn, pH |
| Huai Kha Khaeng | 50 | 233 | seasonal dry evergreen | Ultisol | Al, B, Ca, Cu, Fe, K, Mg, Mn, P, Zn, pH |
| Khao Chong | 24 | 571 | mixed evergreen | Ultisol | Al, Ca, Fe, K, Mg, Mn, P, Zn, pH |
| Korup | 50 | 452 | lowland evergreen | Oxisol/Ultisol | Al, Ca, Fe, K, Mg, Mn, P, Zn |
| La Planada | 25 | 192 | pluvial premontane | Andisol | Al, Ca, Cu, Fe, K, Mg, Mn, Nmin, P, pH |
| Pasoh | 50 | 790 | lowland mixed dipterocarp | Ultisol/Entisol | Al, Ca, Cu, Fe, K, Mg, Mn, P |
| Yasuni | 50 | 1088 | evergreen lowland wet | Ultisol | Al, Ca, Cu, Fe, K, Mg, Mn, Nmin, P, Zn, pH |
(b). Environmental data
The environmental data for each site consisted of topographic and soil resource variables. The topographic variables consisted of elevation, slope, convexity (the relative elevation of a quadrat with respect to its immediate neighbours) and aspect. Throughout each plot, elevation was recorded at the intersections of a 20 × 20 m grid and used to calculate topographic variables at the 20 × 20 m quadrat scale. Mean elevation was calculated as the mean of the elevation measurements at the four corners of a quadrat. Slope was calculated as the average slope of the four planes formed by connecting three corners of a quadrat at a time. Convexity was the elevation of a quadrat minus the average elevation of all immediate neighbour quadrats. Finally, aspect was the direction of the steepest slope of a quadrat, calculated in ArcMap v. 9.3 (www.esri.com).
Soil samples were collected throughout each plot, analysed for elemental concentrations, and continuous maps of these concentrations were created by kriging the sample points (following the methods of John et al. [7]). In each study, site soil samples were taken at the intersections of a 40 or 50 m grid across the study area, with additional samples taken near alternate grid points to estimate small-scale variation in soil variables. The first 10 cm of topsoil was sampled, excluding the top organic horizon. Phosphorus, cations and micronutrients were extracted with Mehlich-III solution and analysed with inductively coupled plasma optical-emission spectrometry (ICP–OES; Perkin Elmer Inc., MA, USA), with the exception of phosphorus at the Yasuni study site, which was extracted with Bray-1 solution and analysed by automated colorimetry on a Quikchem 8500 Flow Injection Analyzer (Hach Ltd, CO, USA). For the three neotropical plots (BCI, La Planada and Yasuni), an estimate of the in situ N-mineralization rate was taken at each sample location by measuring nitrogen before and after a 28 day incubation period. Nitrogen was extracted in 2 M KCl and NH4+ and NO3– determined on an auto analyser (OI FS 3000, OI Analytical, TX, USA). Sample values were kriged to obtain estimated chemical concentrations at the 20 × 20 m quadrat scale. The set of soil variables for each study site contained 8–12 variables, always including Al, Ca, K, Fe, Mg, Mn and P, but where available also included the N-mineralization rate, B, Cu, Zn and pH (table 1).
(c). The effect of sample size on observed habitat structuring
We tested how the observed habitat structuring of a tree community changes with the number of stems in the community by sampling increasing numbers of stems from the BCI tree community and measuring the importance of the environment in explaining the community structure of each sample. We used two popular community analysis techniques to assess the importance of the environmental variables: redundancy analysis (RDA) and multivariate regression tree (MRT) analysis. Both analyses were performed at the 20 × 20 m scale.
RDA is an extension of multiple regression for the analysis of multivariate community data [27]. In RDA, the adjusted R2-value gives an unbiased estimate of the proportion of variation in the community (species abundance) data, which is explained by the explanatory variable set [28]. The proportion of community compositional variation explained by environmental variables in an RDA is frequently used to evaluate the influence of the environment on community structure [14,29]. Two explanatory variable sets were used for the RDA. The first was the set of all environmental variables, expanded to include their second- and third-order polynomials for all variables except for aspect, plus the sine and cosine of aspect (in the method of Legendre et al. [29] and Baldeck et al. [14]). The second was a set of 705 spatial eigenvectors created by principal components of neighbour matrices, which were used to model the spatial structure of the BCI tree community in Baldeck et al. [14]. This set of spatial variables models the spatial structure present in the community data [29–32].
MRT analysis progressively splits the quadrats into groups that are determined by a threshold value of one of the explanatory variables, the specific threshold chosen to maximize the within-group homogeneity of the community data [33]. The fit of an MRT model is evaluated by the cross-validated relative error (CVRE), with lower CVRE values indicating better model fit and greater importance of the explanatory variables in explaining community assemblages (the R2 of the model is given by 1-CVRE). The final number of groups created can be set by the user or selected by the model using some criteria. When selected by the model, a greater number of groups may indicate greater habitat structuring [15]. To avoid overfitting, only three topographic variables (elevation, slope and convexity) were used to constrain the splits in the community data in the MRT analysis.
We sampled the BCI tree community from 10 per cent of the stems up to 100 per cent of the stems in increments of 10 per cent. At each sampling level, x per cent of the stems were randomly selected without replacement, and RDA and MRT analysis were performed. For RDA, we recorded the proportion of variation explained by the environmental and spatial variable sets. We performed MRT analysis twice, letting the number of groups be chosen by the model using the 1-se rule [33] and then constraining the number of groups to be equal to five, recording the CVRE of the models and the number of groups. This was repeated 100 times for each sampling level. For the full community (100% of the stems), RDA was performed only once, while the MRT analysis was repeated 100 times as MRT analyses of the same community may yield variable results.
(d). Evaluating habitat structuring at different life stages
We examined the relative importance of environmental variables in explaining community structure over different life stages in all seven CTFS plots by splitting the tree communities into sapling, juvenile and adult sub-communities based on their dbh. Saplings were defined as trees less than or equal to 3 cm dbh, juveniles were more than 3 cm and less than or equal to 10 cm dbh, and adult trees more than 10 cm dbh. For each site, we randomly sampled the sapling and juvenile sub-communities without replacement with sample sizes equal to that of the adult sub-community (which always had the fewest number of trees). This process was repeated 100 times for both the sapling and juvenile sub-communities, and the proportion of compositional variation explained by the environment was calculated as the adjusted R2 from an RDA using the expanded set of all environmental variables (as above).
Differences in the degree of habitat structuring observed among size classes may result from differences in community composition (figure 1a) as well as stem number. We therefore repeated the above analysis using species-specific dbh cutoffs. Over all sites and trees, approximately 12 per cent of the trees were in the adult class (more than 10 cm dbh), 32 per cent fell into the juvenile class (more than 3 and less than or equal to 10 cm dbh) and 56 per cent were in the sapling class (less than or equal to 3 cm dbh). For the species-specific analysis, each species with at least 10 individuals was split into its own sapling, juvenile and adult classes by taking the largest 12 per cent of stems of that species and placing them into the adult class, the second largest 32 per cent of stems and placing them into the juvenile class, and the remaining 56 per cent of stems were assigned to the sapling class. The sapling, juvenile and adult sub-communities formed this way had nearly identical compositions (figure 1b).
Figure 1.

(a) The relative abundances of species in the adult versus the sapling sub-communities of BCI when sub-communities were determined using rigid dbh cutoffs (less than or equal to 3 cm and more than 10 cm, respectively). Relative abundances are shown for the 196 species shared between the two sub-communities (out of 291 total species in the two sub-communities). (b) The relative abundances of species in the adult versus sapling sub-communities of BCI when sub-communities were determined using species-specific dbh cutoffs, for 234 species with at least 10 individuals in the entire census.
To evaluate whether the change in the amount of variation explained by the environment across the transition from sapling to juvenile or juvenile to adult trees was statistically significant, the difference in the amount of variation explained between life stages was taken for each sampling iteration. If the inner 95 per cent of these differences overlapped with zero, the difference in the variation explained was considered non-significant.
To better understand the stability of community structure and composition across tree life stages, we mapped the community compositional variation of the sapling, juvenile and adult tree sub-communities determined by species-specific dbh cutoffs. For each site, the sapling and juvenile sub-communities were randomly sampled to contain the same number of stems as the adult sub-community. The sub-community data for the three life stages of a study site were submitted to a single non-metric multidimensional scaling (NMDS) ordination in three dimensions using the Bray–Curtis dissimilarity index as the community distance metric. This was performed at the 20 × 20 m scale for all sites except for Huai Kha Khaeng, for which 50 × 50 m quadrats were used to accommodate the lower density of stems. The quadrats’ ordination scores on the three axes were converted to an RGB (red–green–blue) colour by assigning the score of the first axis to intensity of red, the second to green and the third to blue (following [14]). The community maps of the three life stages together display the community compositional variation in space and among tree life stages for a single realization of the random sampling model. Only beta diversity maps created for sub-communities determined by species-specific dbh cutoffs are examined here as rigid dbh cutoffs produced maps with overwhelming RGB differences among sub-communities. RDA and NMDS analysis were performed in the ‘vegan’ package [34], and MRT in the ‘mvpart’ package [35] of the R programming language [36].
3. Results
The proportion of compositional variation explained by a set of variables in an RDA of the BCI tree community was found to increase nonlinearly with increasing stem number (figure 2a). The relationship was qualitatively the same whether the set of explanatory variables used represented environmental variation or were spatial eigenfunctions which model the spatial variation in the community. The 95% confidence limits for the amount of variation explained were very narrow, indicating significant changes in the variation explained by RDA over small changes (approx. 10%) in sampling intensity. Similar results were found in the MRT analysis, showing decreasing CVRE with increasing stem number whether the number of groups was constrained to be equal to five or was selected by the model using the 1-se rule (figure 2b). When the number of groups was selected by the model, the mean number of groups formed increased with increasing stem number.
Figure 2.
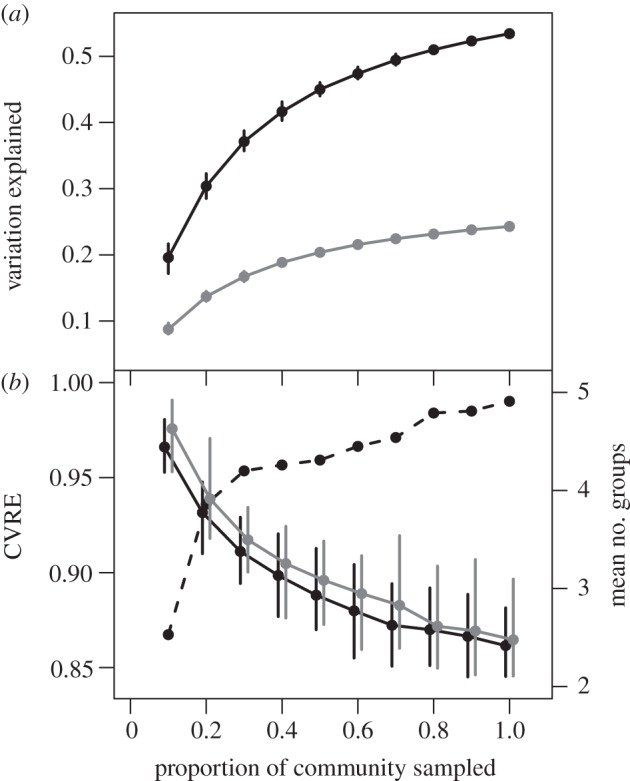
The relationship between observed habitat structuring of the BCI community and the proportion of the community sampled as evaluated by both (a) RDA and (b) MRT analysis. (a) Black indicates the proportion of variation explained by the set of spatial eigenfunctions; grey indicates the proportion of variation explained by the set of environmental variables. (b) Black indicates the CVRE of the MRT analysis when the number of groups was selected by the model with the 1-se rule; grey indicates the CVRE when the number of groups was constrained to be equal to five; dashed line indicates the mean number of groups (y-axis on the right) when the number of groups was selected by the model.
In the comparison of habitat structuring across life stages in all study sites, changes in the explanatory power of environmental variables across tree life stages varied among study sites (table 2a and figure 3a). Across the transition from the sapling (less than or equal to 3 cm dbh) to the juvenile (more than 3 and less than or equal to 10 cm dbh) stage, four sites showed significantly different amounts of variation explained, with two sites showing increases in the proportion of variation explained (Huai Kha Khaeng and Korup) and two showing decreases (Pasoh and Yasuni). At the transition from juveniles to adults (more than 10 cm dbh), six sites had significantly different amounts of variation explained. Of these, four of the sites showed an increase in the proportion of variation explained (BCI, Huai Kha Kheng, La Planada and Yasuni) and two showed a decrease (Khao Chong and Korup).
Table 2.
The differences in the proportion of variation explained by environmental variables between the sapling and juvenile sub-communities and the juvenile and adult sub-communities. Results of the test using (a) rigid dbh size cutoffs between groups and (b) species-specific dbh cutoffs to determine sub-communities. The difference in variation explained is the proportion of variation explained for the larger size class minus the proportion of variation explained for the smaller size class. Bold text indicates that the inner 95% of difference values calculated for the random samples does not overlap with zero (the difference is considered to be significant).
| study site | sample size | sapling–juvenile | juvenile–adult |
|---|---|---|---|
| (a) | |||
| BCI | 20486 | 0.001 | 0.043 |
| Huai Kha Khaeng | 20461 | 0.006 | 0.009 |
| Khao Chong | 11298 | 0.002 | −0.040 |
| Korup | 23975 | 0.116 | −0.027 |
| La Planada | 12450 | −0.005 | 0.033 |
| Pasoh | 26696 | −0.015 | 0.001 |
| Yasuni | 33411 | −0.023 | 0.007 |
| (b) | |||
| BCI | 24926 | −0.007 | 0.028 |
| Huai Kha Khaeng | 9130 | 0.011 | −0.018 |
| Khao Chong | 14233 | 0.008 | 0.007 |
| Korup | 39094 | 0.017 | −0.005 |
| La Planada | 12342 | 0.009 | 0.020 |
| Pasoh | 33486 | 0.001 | 0.004 |
| Yasuni | 35166 | 0.002 | −0.008 |
Figure 3.
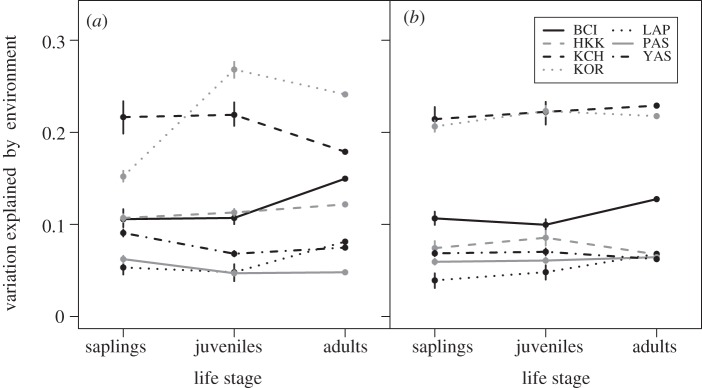
The variation explained for the sapling, juvenile and adult sub-communities of the seven plots: BCI, Barro Colorado Island; HKK, Huai Kha Khaeng; KCH, Khao Chong; KOR, Korup; LAP, La Planada; PAS, Pasoh; YAS, Yasuni. Results are shown for (a) sub-communities determined with rigid dbh size criteria and (b) sub-communities determined with species-specific dbh cutoffs.
When individuals were assigned to a life stage by their species-specific dbh quantiles, changes in the proportion of variation explained by the environment across life stages were reduced for some sites, especially Korup (table 2b and figure 3b). At the transition from saplings to juveniles, two sites showed significant increases in the proportion of variation explained (Huai Kha Kheng and Korup). Five sites showed significant differences in the amount of variation explained across the juvenile and adult transition, with three sites showing increases in the proportion of variation explained (BCI, La Planada and Pasoh), and two sites showing decreases (Huai Kha Khaeng and Yasuni). The maps of community structure of the sapling, juvenile and adult communities (determined by species-specific dbh cutoffs) were very similar among life stages for all study sites (figure 4; electronic supplementary material, figure S1).
Figure 4.

Beta diversity maps of the (i) sapling, (ii) juvenile and (iii) adult sub-communities of (a) Korup, (b) Pasoh and (c) Yasuni. The sub-communities were determined by species-specific dbh cutoffs and sapling and juvenile sub-communities were randomly sampled to have the same number of stems as the adult sub-community. Quadrats of similar colour have similar community composition (lower Bray–Curtis dissimilarity), while absolute colour is irrelevant. Maps of BCI, Huai Kha Khaeng, Khao Chong and La Planada are in electronic supplementary material, figure S1. (Online version in colour.)
4. Discussion
Our analysis of the effect of sample size on the variation explained by a set of variables demonstrates that the amount of observed habitat structuring is strongly influenced by the number of individuals included in the community data. The community-level response to environmental or spatial variation arises from the responses of many individual species to environmental or spatial gradients, but information pertaining to these responses is lost when the analysis contains fewer stems. The amount of observed habitat structuring always decreased when fewer stems were included in the census, irrespective of the explanatory variables or community analysis technique used. This result is consistent with Jones et al. [19], who found that the variation of a Costa Rican pteridophyte community explained by the environment decreased significantly when the community was subsampled randomly to include many fewer individuals.
By controlling for differences in sample size among sub-communities of different life stages, we show that tree community response to habitat heterogeneity is relatively consistent across tree life stages among trees more than or equal to 1 cm dbh. Although many of the differences in the variation explained by the environment between life stages were statistically significant, they were inconsistent among study sites for both life stage transitions. The differences in the variation explained between life stages were most often less than 1 per cent and represented less than a 20 per cent relative increase or decrease. This contrasts with the greater than twofold differences in the variation explained by the environment between trees of different size classes or developmental stages in previous analyses [15,16]. Overall, the amount of habitat structuring observed for the adult communities is similar to the amount that would be expected based on random survival of individuals at earlier life stages.
Within BCI, our analysis uncovered a pattern of slightly greater habitat structuring of the adult tree community compared with saplings and juveniles, regardless of how sub-communities were determined. This result contradicts both patterns reported for the BCI dataset by Kanagaraj et al. [15]. When sub-communities were delineated using recruitment and reproductive-size status, they found that habitat structuring was very strong for juvenile trees and weak for recruiting trees and reproductive adult trees using MRT analysis. When trees were divided into sub-communities based on dbh, the habitat structuring decreased from small (13.5% of the variation explained) to large trees (1.8% of variation explained) for the 2005 census. It is likely relevant that MRT models with different groups were compared (the number of groups and the distribution of quadrats among groups was an important component of the interpretation) and that the CVRE obtained from an MRT analysis has a high degree of variability (figure 2b), even when using the same census and environmental data. However, the discrepancy between our results and those of Kanagaraj et al. [15] is certainly affected by the fact that they did not control for differences in the number of stems among life-history stages.
Most often, changes in the effect of environmental variables across tree size classes were small, with the notable exception of Korup, where there was a large increase in the effect of habitat heterogeneity over the transition from saplings to juveniles determined using rigid dbh cutoffs. However, this difference was drastically reduced when size classes were determined on a relative basis, controlling for community composition. This indicates that the change in the amount of variation explained between sapling and juvenile trees may be attributed to differences in community composition of the sub-communities of trees determined by absolute dbh.
The maps of community structure among saplings, juveniles and adults reveal remarkably consistent community structure and composition across tree life stages (figure 4; electronic supplementary material, figure S1). It appears that changes in the significant species–habitat associations found among different life stages of trees [23] may not have important community-level consequences. Other studies comparing the presence or the absence of significant species–habitat associations across life stage focused on differences between seedlings and trees (more than 1 cm dbh; [21,22]), and thus cover different life stages than are examined here. Although these maps present qualitative rather than quantitative evidence, they indicate strong consistency in species–habitat relationships over tree life stages.
We believe that it would be over-interpretation to claim each statistically significant change in the amount of variation explained by the environment as evidence of habitat filtering or negative density dependence. Instead, we present a more parsimonious argument: in the absence of consistent increases in habitat structuring across study sites for either life stage transition, or method of determining sub-communities, we argue that habitat filtering is not an important driver of tree mortality among trees larger than 1 cm dbh. This is not to say that habitat suitability is not important for trees after they reach this size threshold; indeed, environmental change may cause habitat-related mortality among trees larger than 1 cm dbh, as has been demonstrated for BCI [37,38], but it is unclear whether this type of habitat-related mortality may be considered habitat filtering. Overall, we found no evidence that saplings occupy habitats that would not be suitable for adults of the same species, with habitat filtering narrowing their distributions through time, nor did we find evidence that density-dependent mortality acts to decrease habitat structuring of communities as they age. These conclusions are further supported by community maps showing strong similarity in community composition and structure among saplings, juveniles and adults for all seven study sites (figure 4; electronic supplementary material, figure S1).
Our results show that species–habitat associations are established by the time trees reach 1 cm dbh, indicating that habitat filtering occurs during earlier life stages—seedling establishment and the seedling–sapling transition. Some experimental studies have documented results consistent with strong habitat filtering at the seed, seedling or small sapling stages [39–41]. For example, Engelbrecht et al. [42] found that drought sensitivity at the seedling stage for 48 native tree and shrub species was correlated with distribution patterns across the isthmian rainfall gradient in central Panama, as well as the soil moisture gradient within the BCI 50-ha plot. Similarly, Fine et al. [43] marshalled strong evidence through reciprocal seedling transplant experiments that combined abiotic (soil type) and biotic (herbivory) filters determine species distribution patterns. Our analysis points to the unique importance of these early life stages in shaping the emerging forest community, but more experimental studies are needed to characterize the role of early-stage habitat filtering in tropical forests.
Acknowledgements
We thank the Center for Tropical Forest Science for the collection and organization of the tree census data used in this study. We also thank editor Andy Hector and two anonymous reviewers for their thoughtful comments on the manuscript. R.V., H.N., S.B., S.K., A.Y., M.N.N.S., S.J.D., S.P.H., G.B.C., D.K., and D.W.T. coordinated collection of tree census and topographic data; J.W.D., K.E.H., J.B.Y. and R.J. designed the soil sampling protocol; B.L.T., H.N., G.B.C., S.M., S.B., S.K. and A.Y. collected soil data; R.J. kriged the soil data; C.A.B. designed and carried out the statistical analysis and wrote the manuscript and J.W.D., K.E.H. and B.L.T. contributed substantially to revisions.
Data accessibility
Tree census and topographic data are maintained by CTFS and data enquiries should be made to S.J.D. The soils data are maintained by J.W.D. and enquires should be made to him.
Funding statement
The BCI forest dynamics research project was made possible by National Science Foundation grants to S.P.H.: DEB-0640386, DEB-0425651, DEB-0346488, DEB-0129874, DEB-00753102, DEB-9909347, DEB-9615226, DEB-9615226, DEB-9405933, DEB-9221033, DEB-9100058, DEB-8906869, DEB-8605042, DEB-8206992, DEB-7922197, support from the Center for Tropical Forest Science, the Smithsonian Tropical Research Institute, the John D. and Catherine T. MacArthur Foundation, the Mellon Foundation and the Small World Institute Fund. Funding for soils work was provided by the US National Science Foundation Grants DEB 0211004, DEB 0211115, DEB 0212284, DEB 0212818 and OISE 0314581, the soils initiative of the Smithsonian Tropical Research Institute, and a CTFS grant to cover collection and extraction of soils from Korup.
References
- 1.Keddy PA. 1992. Assembly and response rules: two goals for predictive community ecology. J. Veg. Sci. 3, 157–164 (doi:10.2307/3235676) [Google Scholar]
- 2.Hutchinson GE. 1957. Concluding remarks. Cold Spring Harb. Symp. Quant. Biol. 22, 415–427 (doi:10.1101/SQB.1957.022.01.039) [Google Scholar]
- 3.Clark DB, Clark DA, Read JM. 1998. Edaphic variation and the mesoscale distribution of tree species in a neotropical rain forest. J. Ecol. 86, 101–112 (doi:10.1046/j.1365-745.1998.00238.x) [Google Scholar]
- 4.Harms KE, Condit R, Hubbell SP, Foster RB. 2001. Habitat associations of trees and shrubs in a 50-ha neotropical forest plot. J. Ecol. 89, 947–959 (doi:10.1111/j.1365-2745.2001.00615.x) [Google Scholar]
- 5.Potts MD, Ashton PS, Kaufman LS, Plotkin JB. 2002. Habitat patterns in tropical rain forests: a comparison of 105 plots in northwest Borneo. Ecology 83, 2782–2797 (doi:10.1890/0012–9658(2002)083[2782:HPITRF]2.0.CO;2) [Google Scholar]
- 6.Phillips OL, Vargas PN, Monteagudo AL, Cruz AP, Zans M-EC, Sánchez WG, Yli-Halla M, Rose S. 2003. Habitat association among Amazonian tree species: a landscape-scale approach. J. Ecol. 91, 757–775 (doi:10.1046/j.1365-2745.2003.00815.x) [Google Scholar]
- 7.John R, et al. 2007. Soil nutrients influence spatial distributions of tropical tree species. Proc. Natl Acad. Sci. USA 104, 864–869 (doi:10.1073/pnas.0604666104) [DOI] [PMC free article] [PubMed] [Google Scholar]
- 8.Valencia R, et al. 2004. Tree species distributions and local habitat variation in the Amazon: large forest plot in eastern Ecuador. J. Ecol. 92, 214–229 (doi:10.1111/j.0022-0477.2004.00876.x) [Google Scholar]
- 9.Fine PA, Daly DC, Cameron KM. 2005. The contribution of edaphic heterogeneity to the evolution and diversity of burseracear trees in the Western Amazon. Evolution 59, 1464–1478 (doi:10.1111/j.0014-3820.2005.tb01796.x) [PubMed] [Google Scholar]
- 10.Gunatilleke CVS, Gunatilleke IAUN, Esufali S, Harms KE, Ashton PMS, Burslem DFRP, Ashton PS. 2006. Species–habitat associations in a Sri Lankan dipterocarp forest. J. Trop. Ecol. 22, 371– 384 (doi:10.1017/S0266467406003282) [Google Scholar]
- 11.Paoli GD, Curran LM, Zak DR. 2006. Soil nutrients and beta diversity in the Bornean Dipterocarpaceae: evidence for niche partitioning by tropical rain forest trees. J. Ecol. 94, 157–170 (doi:10.1111/j.1365-2745.2005.01077.x) [Google Scholar]
- 12.Chuyong GB, Kenfack D, Harms KE, Thomas DW, Condit R, Comita LS. 2011. Habitat specificity and diversity of tree species in an African wet tropical forest. Plant Ecol. 212, 1363–1374 (doi:10.1007/s11258-011-9912-4) [Google Scholar]
- 13.De Caceres M, et al. 2012. The variation of tree beta diversity across a global network of forest plots. Glob. Ecol. Biogeogr. 21, 1191–1202 (doi:10.1111/j.1466-8238.2012.00770.x) [Google Scholar]
- 14.Baldeck CA, et al. 2013. Soil resources and topography shape local tree community structure in tropical forests. Proc. R. Soc. B 280, 20122532 (doi:10.1098/rspb.2012.2532) [DOI] [PMC free article] [PubMed] [Google Scholar]
- 15.Kanagaraj R, Wiegand T, Comita LS, Huth A. 2011. Tropical tree species assemblages in topographical habitats change in time and with life stage. J. Ecol. 99, 1441–1452 (doi:10.1111/j.1365-2745.2011.01878.x) [Google Scholar]
- 16.Punchi-Manage R, Getzin S, Wiegand T, Kanagaraj R, Savitri Gunatilleke CV, Nimal Gunatilleke IAU, Wiegand K, Huth A. 2013. Effects of topography on structuring local species assemblages in a Sri Lankan mixed dipterocarp forest. J. Ecol. 101, 149–160 (doi:10.1111/1365-2745.12017) [DOI] [PubMed] [Google Scholar]
- 17.Hu Y-H, Lan G-Y, Sha L-Q, Cao M, Tang Y, Li Y-D, Xu D-P. 2012. Strong neutral spatial effects shape tree species distributions across life stages at multiple scales. PLoS ONE 7, e38247 (doi:10.1371/journal.pone.0038247) [DOI] [PMC free article] [PubMed] [Google Scholar]
- 18.Higgins MA, Ruokolainen K. 2004. Rapid tropical forest inventory: a comparison of techniques based on inventory data from western Amazonia. Conserv. Biol. 18, 799–811 (doi:10.1111/j.1523-1739.2004.00235.x) [Google Scholar]
- 19.Jones MM, Tuomisto H, Olivas PC. 2008. Differences in the degree of environmental control on large and small tropical plants: just a sampling effect? J. Ecol. 96, 367–377 (doi:10.1111/j.1365-2745.2007.01340.x) [Google Scholar]
- 20.Kraft NJB, et al. 2011. Disentangling the drivers of β diversity along latitudinal and elevational gradients. Science 333, 1755–1758 (doi:10.1126/science.1208584) [DOI] [PubMed] [Google Scholar]
- 21.Webb CO, Peart DR. 2000. Habitat associations of trees and seedlings in a Bornean rain forest. J. Ecol. 88, 464–478 (doi:10.1046/j.1365-2745.2000.00462.x) [Google Scholar]
- 22.Comita LS, Condit R, Hubbell SP. 2007. Developmental changes in habitat associations of tropical trees. J. Ecol. 95, 482–492 (doi:10.1111/j.1365-2745.2007.01229.x) [Google Scholar]
- 23.Lai J, Mi X, Ren H, Ma K. 2009. Species–habitat associations change in a subtropical forest of China. J. Veg. Sci. 20, 415–423 (doi:10.1111/j.1654-1103.2009.01065.x) [Google Scholar]
- 24.Hubbell SP, Foster RB, O'Brien ST, Harms KE, Condit R, Wechsler B, Wright SJ, Lao SLDE. 1999. Light-gap disturbances, recruitment limitation, and tree diversity in a neotropical forest. Science 283, 554–557 (doi:10.1126/science.283.5401.554) [DOI] [PubMed] [Google Scholar]
- 25.Hubbell SP, Condit R, Foster RB.2005. Forest census plot on Barro Colorado Island. See http://ctfs.arnarb.harvard.edu/webatlas/datasets/bci/
- 26.Condit R. 1998. Tropical forest census plots. Berlin, Germany: Springer-Verlag and Georgetown, TX: R. G. Landes Company [Google Scholar]
- 27.Rao CR. 1964. The use and interpretation of principal component analysis in applied research. Sankhyā: Indian J. Stat. Ser. A (1961–2002) 26, 329–358 (doi:10.2307/25049339) [Google Scholar]
- 28.Peres-Neto PR, Legendre P, Dray S, Borcard D. 2006. Variation partitioning of species data matrices: estimation and comparison of fractions. Ecology 87, 2614–2625 (doi:10.1890/0012-9658(2006)87[2614:VPOSDM]2.0.CO;2) [DOI] [PubMed] [Google Scholar]
- 29.Legendre P, Mi X, Ren H, Ma K, Yu M, Sun I-F, He F. 2009. Partitioning beta diversity in a subtropical broad-leaved forest of China. Ecology 90, 663–674 (doi:10.1890/07-1880.1) [DOI] [PubMed] [Google Scholar]
- 30.Borcard D, Legendre P. 2002. All-scale spatial analysis of ecological data by means of principal coordinates of neighbour matrices. Ecol. Model. 153, 51–68 (doi:10.1016/S0304-3800(01)00501-4) [Google Scholar]
- 31.Borcard D, Legendre P, Avois-Jacquet C, Tuomisto H. 2004. Dissecting the spatial structure of ecological data at multiple scales. Ecology 85, 1826–1832 (doi:10.1890/03-3111) [Google Scholar]
- 32.Dray S, Legendre P, Peres-Neto PR. 2006. Spatial modelling: a comprehensive framework for principal coordinate analysis of neighbour matrices (PCNM). Ecol. Model. 196, 483–493 (doi:10.1016/j.ecolmodel.2006.02.015) [Google Scholar]
- 33.De'ath G. 2002. Multivariate regression trees: a new technique for modeling species–environment relationships. Ecology 83, 1105–1117 (doi:10.1890/0012-9658(2002)083[1105:MRTANT]2.0.CO;2) [Google Scholar]
- 34.Oksanan J, Blanchet FG, Kindt R, Legendre P, O'Hara RB, Simpson GL, Solymos P, Stevens MHH, Wagner H.2011. vegan: community ecology package.
- 35.Therneau TM, Atkinson B.2012. mvpart: Multivariate partitioning.
- 36.R Development Core Team 2011. R: a language and environment for statistical computing. Vienna, Austria: R Foundation for Statistical Computing [Google Scholar]
- 37.Condit R, Hubbell SP, Foster RB. 1996. Changes in tree species abundance in a Neotropical forest: impact of climate change. J. Trop. Ecol. 12, 231–256 (doi:10.1017/S0266467400009433) [Google Scholar]
- 38.Feeley KJ, Davies SJ, Perez R, Hubbell SP, Foster RB. 2011. Directional changes in the species composition of a tropical forest. Ecology 92, 871–882 (doi:10.1890/10-0724.1) [DOI] [PubMed] [Google Scholar]
- 39.Bruna EM. 1999. Biodiversity: seed germination in rainforest fragments. Nature 402, 139–139 (doi:10.1038/45963)10647004 [Google Scholar]
- 40.Paine CET, Harms KE, Ramos J. 2009. Supplemental irrigation increases seedling performance and diversity in a tropical forest. J. Trop. Ecol. 25, 171–180 (doi:10.1017/S0266467408005798) [Google Scholar]
- 41.Paz H, Mazer SJ, Martínez-Ramos M. 1999. Seed mass, seedling emergence, and environmental factors in seven rain forest Psychotria (Rubiaceae). Ecology 80, 1594–1606 (doi:10.1890/0012-9658(1999)080[1594:SMSEAE]2.0.CO;2) [Google Scholar]
- 42.Engelbrecht BMJ, Comita LS, Condit R, Kursar TA, Tyree MT, Turner BL, Hubbell SP. 2007. Drought sensitivity shapes species distribution patterns in tropical forests. Nature 447, 80–82 (doi:10.1038/nature05747) [DOI] [PubMed] [Google Scholar]
- 43.Fine PVA, Mesones I, Coley PD. 2004. Herbivores promote habitat specialization by trees in Amazonian forests. Science 305, 663–665 (doi:10.1126/science.1098982) [DOI] [PubMed] [Google Scholar]
Associated Data
This section collects any data citations, data availability statements, or supplementary materials included in this article.
Data Availability Statement
Tree census and topographic data are maintained by CTFS and data enquiries should be made to S.J.D. The soils data are maintained by J.W.D. and enquires should be made to him.