

Abstract
The muscle work required to sustain steady-speed locomotion depends largely upon the mechanical energy needed to redirect the centre of mass and the degree to which this energy can be stored and returned elastically. Previous studies have found that large bipedal hoppers can elastically store and return a large fraction of the energy required to hop, whereas small bipedal hoppers can only elastically store and return a relatively small fraction. Here, we consider the extent to which large and small bipedal hoppers (tammar wallabies, approx. 7 kg, and desert kangaroo rats, approx. 0.1 kg) reduce the mechanical energy needed to redirect the centre of mass by reducing collisions. We hypothesize that kangaroo rats will reduce collisions to a greater extent than wallabies since kangaroo rats cannot elastically store and return as high a fraction of the mechanical energy of hopping as wallabies. We find that kangaroo rats use a significantly smaller collision angle than wallabies by employing ground reaction force vectors that are more vertical and center of mass velocity vectors that are more horizontal and thereby reduce their mechanical cost of transport. A collision-based approach paired with tendon morphometry may reveal this effect more generally among bipedal runners and quadrupedal trotters.
Keywords: bipedal hopping, biomechanics, energetics, collisions
1. Introduction
The muscle work needed to sustain steady-speed locomotion can be substantially reduced by (i) reducing the mechanical energy required to redirect the centre of mass trajectory from downward to upward—i.e. the energy involved in collisions [1] and/or (ii) minimizing the energetic consequences of such collisions by storing and returning a portion of the mechanical energy involved in collisions via passive elastic mechanisms [2]. Previous studies of bouncing gaits have focused primarily on the second method of reducing muscle work. These studies have shown that large bipedal hoppers, such as kangaroos and wallabies, can store and return a substantial portion of the mechanical energy required for locomotion (35–54%) in their long, thin ankle extensor tendons [3–5], whereas small bipedal hoppers, such as spring hares and kangaroo rats, can only store and return a small portion (14–21%) owing to their relatively short, thick ankle extensor tendons [6]. An important implication of such passive elastic mechanisms is that they contribute mechanical energy without consuming chemical energy, thus reducing metabolic cost relative to mechanical cost [4]. Our approach determines the mechanical energy required to sustain centre of mass oscillations during bipedal hopping as a dimensionless mechanical cost of transport and also reveals the underlying collision-based dynamics [1].
Here, we consider the relative extent to which tammar wallabies (large bipedal hoppers) and desert kangaroo rats (small bipedal hoppers) reduce the mechanical energy involved in collisions by adjusting the relative orientations of the ground reaction force and centre of mass velocity vectors. Limiting the potential for collisional energy loss may be more important for kangaroo rats than wallabies, because kangaroo rats cannot elastically store and return as high a fraction of the mechanical energy of hopping as wallabies. Therefore, we hypothesized that kangaroo rats would keep the ground reaction force, F, and centre of mass velocity, V, vectors closer to perpendicular—i.e. use a smaller collision angle (see figure 1 and table 1 for definition of collision angle)—than wallabies in order to use less mechanical power, P = F · V, to redirect the centre of mass from a downward to upward trajectory during ground contact.
Figure 1.
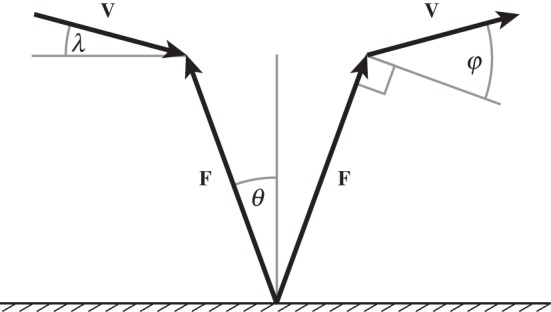
Collision geometry is calculated from the ground reaction force vector, F, and the centre of mass velocity vector, V. θ, λ and φ represent instantaneous force, velocity and collision angles, respectively (see table 1 for equations). Collision angle measures the extent to which the force and velocity vectors deviate from being perpendicular to each other: a collision angle of zero corresponds to a right angle between the two vectors, larger collision angles correspond to obtuse angles.
Table 1.
Collision parameters (equations (1.1–1.6)) and traditional stride parameters (equations (1.7–1.11)).
instantaneous force angle, where F is the ground reaction force vector and  is a unit vector normal to the ground pointing upward is a unit vector normal to the ground pointing upward |
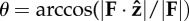 |
equation (1.1) |
| average force angle determined by force averaging over the contact periods of the stride | 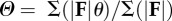 |
equation (1.2) |
instantaneous velocity angle, where V is the CoM velocity vector and  is a unit vector parallel to the ground pointing in the direction of travel is a unit vector parallel to the ground pointing in the direction of travel |
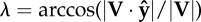 |
equation (1.3) |
| average velocity angle determined by velocity averaging over the contact periods of the stride |  |
equation (1.4) |
instantaneous collision angle determined from the dot product of force on velocity—the arcsine rotates this angle by π/2 such that it quantifies the deviation from 
|
 |
equation (1.5) |
| average collision angle determined by force and velocity averaging over the contact periods of the stride |  |
equation (1.6) |
| mechanical cost of transport is a normalized absolute value of CoM power, where m is body mass, n is the number of samples in the stride period and g is the acceleration of gravity on the Earth |  |
equation (1.7) |
dimensionless hop speed (the square-root of Froude number), where l is leg length (average distance from toe to hip), g is acceleration of gravity on the Earth and  is average forward velocity is average forward velocity |
 |
equation (1.8) |
| dimensionless hop frequency, where f is hop frequency |  |
equation (1.9) |
| dimensionless hop length, where d is hop length |  |
equation (1.10) |
| duty factor, where tc is contact time and T is hop period |  |
equation (1.11) |
2. Material and methods
(a). Subjects
Five tammar wallabies (Macropus eugenii) and five desert kangaroo rats (Dipodomys deserti) hopped bipedally along level runways while ground reaction force and centre of mass trajectory were recorded. Average body mass and leg length (average distance from toe to hip during stance) were 6.6 ± 0.5 kg and 0.305 ± 0.009 m (mean ± s.d.), and 0.11 ± 0.01 kg and 0.063 ± 0.004 m for the wallabies and kangaroo rats, respectively.
(b). Force and motion capture data
Ground reaction forces were recorded with force plates (1000 Hz) [7]. Trials were filmed in the sagittal plane with high-speed video cameras (125 Hz for the wallabies and 200 Hz for the kangaroo rats; see the electronic supplementary material for video footage). White paint was used to mark anatomical landmarks, which were tracked and digitized [7]. The initial velocity of the centre of mass prior to ground contact was estimated from the velocity of a pelvic marker. During ground contact, the centre of mass velocity was determined by integrating centre of mass accelerations calculated from ground reaction force data and the estimated initial velocity of the centre of mass. Trials were deemed to be acceptably close to steady-state if the change in forward hopping speed over the course of the trial was less than 10 per cent of the mean forward hopping speed. Based on this criterion, a total of 22 and 33 trials were included for wallabies and kangaroo rats, respectively, with an average of 4.4 (range 2 : 6) and 6.6 (range 3 : 11) trials per animal. A single hop was analysed from each trial.
(c). Collision parameters
Collision parameters—force angle, velocity angle and collision angle—were calculated according to the methods of Lee et al. [8] (table 1, equation (1.1–1.6)). Instantaneous values were computed for all parameters and these values were averaged over the contact period. Weighted averages were used because portions of the stride that involve more power, P = F · V, have a greater influence on centre of mass mechanics. All collision parameters reported in this study are weighted averages over a hop cycle (table 1, equations ((1.2), (1.4) and (1.6)), but for the sake of conciseness, we will simply refer to these average collision parameters as ‘force angle’ (Θ), ‘velocity angle’ (Λ) and ‘collision angle’ (Φ).
(d). Stride parameters
Traditional stride parameters—mechanical cost of transport, hop speed, hop frequency, hop length and duty factor—were also calculated for the purposes of comparison (table 1, equations (1.7–1.11)). Hop speed, frequency and length were made dimensionless according to leg length and the acceleration of gravity [9].
(e). Statistics
Statistical analyses of collision angle, mechanical cost of transport, force angle, velocity angle, dimensionless hop frequency, dimensionless hop length and duty factor versus dimensionless hopping speed were performed in MATLAB. The ‘aoctool’ in the statistics toolbox was used to obtain regression coefficient and ANOVA tables. In each case, we started with a general model that assumed that the regressions for wallabies and kangaroo rats had different slopes and intercepts. If the slopes and/or intercepts were not found to be significantly different in the general model, we progressed towards models where the slopes were the same for both species. If the slopes were not significantly different from zero, we used a model that compared means. Statistical significance was set at the α = 0.05 level.
3. Results
(a). Collision parameters
Collision angle decreased with increasing forward hop speed for both wallabies and kangaroo rats (figure 2a). This was accomplished by using a smaller velocity angle, corresponding to a flatter, more horizontal velocity vector, with increasing hopping speed (figure 2c). The force angle actually increased slightly over the range of speeds studied (figure 2b) counteracting, but not completely offsetting, the decreasing velocity angle. The smaller velocity angle resulted from holding vertical speed roughly constant while increasing horizontal hopping speed. Kangaroo rats used significantly smaller collision angles (4°–7° smaller) than wallabies across the range of speeds studied. Ranges give the lowest and highest differences between kangaroo rat and wallaby regression lines for the range of speeds where data were available for both species. This was due to the fact that the kangaroo rats used both 2°–4° smaller (more horizontal) velocity angles and 3°–4° smaller (more vertical) force angles than wallabies. The coefficients for all least-squares regressions and p-values comparing slopes and intercepts between species are given in table 2.
Figure 2.

Collision parameters—(a) average collision angle (black) and mechanical cost of transport (grey), (b) average force angle and (c) average velocity angle—and traditional stride parameters—(d) dimensionless hop frequency, (e) dimensionless hop length and (f) duty factor—as a function of dimensionless hop speed. Kangaroo rats use significantly smaller collision angles than wallabies across all speeds studied by employing significantly smaller force angles and velocity angles. This is mirrored by the traditional stride parameter data (see §4 for details).
Table 2.
Slopes and intercepts for regression equations of the form  and p-values indicating the probability that the observed differences between regressions are due to chance alone. All regressions are significantly different between species at the α = 0.05 level.
| parameter | species | slope | intercept | p-value |
|---|---|---|---|---|
| Φ | wallabies | −0.017 | 0.35 | 0.012a |
| kangaroo rats | −0.048 | 0.33 | ||
| CoTmech | wallabies | −0.017 | 0.34 | 0.012a |
| kangaroo rats | −0.047 | 0.32 | ||
| Θ | wallabies | 0.038 | 0.071 | 0.0002a |
| kangaroo rats | 0.0089 | 0.085 | ||
| Λ | wallabies | −0.067 | 0.36 | <10−11b |
| kangaroo rats | −0.066 | 0.30 | ||
 |
wallabies | 0.036 | 0.49 | <10−17b |
| kangaroo rats | 0.065 | 0.66 | ||
 |
wallabies | 1.39 | 0.83 | 0.014a |
| kangaroo rats | 1.05 | 0.42 | ||
| δ | wallabies | −0.029 | 0.50 | 0.0002a |
| kangaroo rats | −0.097 | 0.64 |
ap-value for slopes.
bp-value for intercepts, slopes are not significantly different.
The relationship between mechanical cost of transport and dimensionless hopping speed closely matches that of collision angle (figure 2a). This shows that collision angle approximates this traditional metric in bipedal hoppers, as previously observed for quadrupedal trotters [8]. Kangaroo rats used significantly less mechanical energy (0.070–0.11 J m−1 N−1 less) than wallabies to move their centre of mass a given distance.
(b). Stride parameters
Both wallabies and kangaroo rats increased dimensionless hopping speed by increasing both dimensionless hop frequency and hop length (figure 2d,e). However, kangaroo rats used significantly greater dimensionless hop frequencies (0.21–0.26 greater) and significantly shorter dimensionless hop lengths (0.95–1.5 shorter) than wallabies across all speeds studied (figure 2d,e).
Duty factor decreased with increasing hopping speed for both wallabies and kangaroo rats, but duty factor decreased significantly more rapidly for kangaroo rats than for wallabies such that duty factors spanned 0.54–0.35 for kangaroo rats but only 0.46–0.38 for wallabies. For dimensionless speeds of less than about 2, wallabies use lower duty factors, but for dimensionless speeds greater than about 2, kangaroo rats use lower duty factors. (Collision and stride parameter data are available as electronic supplementary material.)
4. Discussion
The goal of this study was to quantify the dynamic interaction of the centre of mass with the environment using collision parameters. Traditional stride parameters were used to quantify the timing, relative duration and spacing of the footfalls responsible for these dynamics.
Kangaroo rats use significantly smaller collision angles than wallabies across all speeds studied by employing smaller force angles and, especially, smaller velocity angles at a given dimensionless speed. By reducing collision angle, kangaroo rats use less mechanical energy to redirect their centre of mass during stance and, consequently, have 79–61% the mechanical cost of transport of wallabies at equivalent hopping speeds.
Traditional spatio-temporal stride parameters also show differences between wallabies and kangaroo rats. Wallabies use relatively longer hop lengths and lower hop frequencies to achieve the same dimensionless speeds as kangaroo rats. This implies that wallabies reach greater hop heights for a given speed, which is consistent with wallabies using a greater (more vertical) velocity angle (figure 2c). Wallabies use similar duty factors as kangaroo rats at their slowest dimensionless speed but greater duty factors at greater speeds. Given that wallabies use roughly the same or greater duty factor, longer hop length and lower hop frequency at a given speed over the range of speeds studied, their centre of mass will travel forward a greater distance relative to leg length during ground contact. Because this necessitates a greater angular excursion of the legs, this is consistent with wallabies using a greater force angle (figure 2b).
Spatio-temporal data are available for bipedal striding locomotion of birds from quail to ostriches [10]. These classic data provide an opportunity to compare bipedal hopping with bipedal running across a size range that includes kangaroo rats and wallabies. Dimensionless stride frequency appears to be lower and dimensionless stride length appears to be longer during bipedal running of smaller versus larger birds ([10], fig. 5). Although data from more species will be required to determine scaling, bipedal hoppers might show a different relationship given that kangaroo rats use higher frequencies and shorter stride lengths than wallabies. Likewise, duty factors of kangaroo rats and wallabies do not conform to the apparent tendency for smaller birds to use greater duty factors during bipedal running ([10, fig. 7]).
Our collision-based analysis of hopping suggests that legged animals without specialized structures for elastic energy storage and return may be more likely to use smaller collision angles to reduce fluctuations of centre of mass power during bouncing gaits such as trotting and bipedal running. Within bipedal hoppers, the relative capacity for storing and returning elastic energy increases with increasing body size. The small kangaroo rats (approx. 0.1 kg) have relatively thick ankle extensor tendons compared with the larger tammar wallabies (approx. 7 kg) and are not capable of storing and returning substantial elastic energy. A similar scaling relationship for energy storage capacity has been reported across a number of quadrupedal mammals [11]. However, it remains to be determined whether or not small quadrupeds and small bipedal striders might also adopt a strategy that reduces fluctuations of centre of mass power during steady-speed trotting and running.
Acknowledgements
All testing protocols were approved by the Harvard University (wallabies) or University of Idaho (kangaroo rats) Institutional Animal Care and Use Committees.
This work was supported by BEACON under NSF Cooperative Agreement no. DBI-0939454 and by Idaho INBRE, NIH grant nos. P20 RR016454 and P20 GM103408. We thank Dayne Sullivan for helping with data collection.
References
- 1.Ruina A, Bertram JE, Srinivasan M. 2005. A collisional model of the energetic cost of support work qualitatively explains leg sequencing in walking and galloping, pseudo-elastic leg behavior in running and the walk-to-run transition. J. Theor. Biol. 237, 170–192 (doi:10.1016/j.jtbi.2005.04.004) [DOI] [PubMed] [Google Scholar]
- 2.Cavagna GA. 1970. Elastic bounce of the body. J. Appl. Physiol. 29, 279–282 [DOI] [PubMed] [Google Scholar]
- 3.Alexander RM, Vernon A. 1975. Mechanics of hopping by kangaroos (Macropodidae). J. Zool. 177, 265–303 (doi:10.1111/j.1469-7998.1975.tb05983.x) [Google Scholar]
- 4.Biewener AA, Baudinette RV. 1995. In-vivo muscle force and elastic energy storage during steady-speed hopping of tammar wallabies (Macropus eugenii). J. Exp. Biol. 198, 1829–1841 [DOI] [PubMed] [Google Scholar]
- 5.Cavagna GA, Heglund NC, Taylor CR. 1977. Mechanical work in terrestrial locomotion: two basic mechanisms for minimizing energy expenditure. Am. J. Physiol. 233, R243–R261 [DOI] [PubMed] [Google Scholar]
- 6.Biewener A, Alexander RM, Heglund NC. 1981. Elastic energy storage in the hopping of kangaroo rats (Dipodomys spectabilis). J. Zool. 195, 369–383 (doi:10.1111/j.1469-7998.1981.tb03471.x) [Google Scholar]
- 7.McGowan CP, Baudinette RV, Biewener AA. 2005. Joint work and power associated with acceleration and deceleration in tammar wallabies (Macropus eugenii). J. Exp. Biol. 208, 41–53 (doi:10.1242/Jeb.01305) [DOI] [PubMed] [Google Scholar]
- 8.Lee DV, Bertram JEA, Anttonen JT, Ros IG, Harris SL, Biewener AA. 2011. A collisional perspective on quadrupedal gait dynamics. J. R. Soc. Interface 8, 1480–1486 (doi:10.1098/rsif.2011.0019) [DOI] [PMC free article] [PubMed] [Google Scholar]
- 9.Alexander RMcN, Jayes AS. 1983. A dynamic similarity hypothesis for the gaits of quadrupedal mammals. J. Zool. 201, 135–152 (doi:10.1111/j.1469-7998.1983.tb04266.x) [Google Scholar]
- 10.Gatesy SM, Biewener AA. 1991. Bipedal locomotion: effects of speed, size and limb posture in birds and humans. J. Zool. 224, 127–147 (doi:10.1111/j.1469-7998.1991.tb04794.x) [Google Scholar]
- 11.Pollock CM, Shadwick RE. 1994. Allometry of muscle, tendon, and elastic energy storage capacity in mammals. Am. J. Physiol. 266, R1022–R1031 [DOI] [PubMed] [Google Scholar]