

Abstract
Normal somatic cells are capable of only a limited number of divisions, which prevents unlimited cell proliferation and the onset of tumours. Cancer cells find ways to circumvent this obstacle, typically by expressing the enzyme telomerase and less often by alternative recombination strategies. Given this fundamental link between cellular replication limits and cancer, it is important to understand how a tissue's architecture affects the replicative capacity of a cell population. We define this as the average number of remaining divisions at equilibrium. The lower the replication capacity, the lower the chances to escape the replication limit during abnormal growth when a tumour develops. In this paper, we examine how the replication capacity is influenced by defining characteristics of cell lineages, such as the number of intermediate cell compartments, self-renewal capability of cells and division rates. We describe an optimal tissue architecture that minimizes the replication capacity of dividing cells and thus the risk of cancer. Interestingly, some of the features that define an optimal tissue architecture have been documented in a variety of tissues, suggesting that they may have evolved as a cancer-protecting strategy in multicellular organisms.
Keywords: cancer, telomeres, cell lineages
1. Introduction
Human somatic cells can undergo only a limited number of divisions in vitro [1]. This phenomenon known as replicative senescence or the Hayflick limit has long been attributed to the progressive shortening of telomeres with age, which occurs both in vivo and in vitro [2]. Telomeres are specialized non-coding repetitive sequences of DNA that are highly conserved throughout evolution and are found at the end of eukaryotic chromosomes [3,4]. There are several processes that are believed to contribute to telomere shortening during cell division; these include the incomplete replication of linear DNA molecules by DNA polymerases [5], active degradation by an unknown exonuclease [6] and oxidative stress [7].
It has been suggested that replication limits in somatic cells evolved as a means to reduce the incidence of cancer in multicellular organisms. A transformed cell dividing without control must first evade the constraints imposed by the replication limit before it can establish a neoplasia of a significant size. The link between telomeres and cancer is supported by the fact that most colonies of transformed human cells initially proliferate but ultimately cease to divide and die [8,9]. This extinction coincides with a phase termed telomere crisis, in which there is an abundance of cells with very short telomeres and widespread cell death (presumably owing to chromosome instability) [8]. In addition, very significantly, between 85 and 90% of cancer cells express telomerase [10] (an enzyme that extends telomere length) allowing them to circumvent the limitations imposed by replicative limits.
The role of replication limits in the context of cancer biology has been seen as a mechanism to curtail the clonal expansion of cells. Conceptually, if an oncogenic event causes uncontrolled proliferation of a cell and its progeny, then replication limits place a cap on the maximum size of the cell colony and on the total number of divisions by transformed cells. According to the multi-hit theory of carcinogenesis, full progression towards malignancy requires the accumulation of several mutations in altered cells. Because mutations typically occur during cell division, a limit on the possible number of divisions reduces the probability of acquiring additional mutations. Hence, the lower the replication capacity (defined as the number of divisions left) of the originally transformed cell, the lower the chances of acquiring subsequent mutations that can lead to further cancer progression. This explains the goal of minimizing the average replication capacity of a dividing cell. We also note that a mutation that results in the activation of telomerase could allow cells to bypass the replicative limit [10], so the probability of escaping Hayflick's limit itself also depends on the replication capacity of the originally transformed cell.
In order to understand how replication limits protect against cancer, it is essential to understand how a tissue's architecture affects the replicative capacity of the cell population. Recently, cell lineages have been viewed as the fundamental units of tissue development, maintenance and regeneration [11–13]. At the starting points of lineages, one finds stem cells, characterized by their ability to maintain their own numbers through self-replication [11]. Stem cells give rise to intermediate more differentiated progenitor cells, which are often capable of at least some degree of self-replication [12]. The end products of lineages are the fully differentiated mostly non-dividing cells associated with mature tissue functions.
In this paper, we explore how different architectural characteristics of a cell lineage—the number of intermediate cell compartments, the self-renewal capabilities of cells and the rates of cell division—impact the replication capacity of a cell population. In any given system, there are many theoretically possible architectures that are able to produce a fixed physiologically required output of differentiated cells from a small stem cell pool. Yet, we find that these alternative architectures may produce radically different results with regards to the replicative potential of the cell population. In this study, we find specific features that define an optimal tissue architecture that minimizes the expected replication capacity of dividing cells and thus the risk of cancer. Our work highlights the importance of understanding the precise architecture of cell lineages by analysing the interconnections between lineages, replication limits and cancer biology.
2. Lineages and replication limits
Cell lineages follow specific differentiation pathways. The turnover rate, degree of differentiation and distinct function of different cells within a lineage can often be associated with the expression of specific markers [13,14]. These observations have led to the idea of cell compartments as a sequence of distinct and distinguishable differentiation steps. The organization of lineages into cell compartments is a widely proposed model that has been studied both biologically and mathematically in many tissues, including the haematopoietic and neural systems, epidermis, oesophagus and colon crypt [14–18]. The level of differentiation of cells can change upon cell division [12]. Alternatively, for certain tissues, it has been proposed that cells can also change their differentiation level by moving away from the stem cell niche [19], leading to a continuous differentiation process. Given our interest in replication limits and their intrinsic connection to cell division, here we focus on differentiation occurring through cell division (alternative division-independent differentiation mechanisms lie beyond the scope of this paper).
We begin by introducing a variant of a widely proposed model of cell dynamics within a cell lineage [20–25]. In this model (figure 1), the starting point of the lineage is stem cells S. Downstream from the stem cell population, one finds a series of intermediate cell types often referred to in the literature as progenitor cells or transit-amplifying cells (here named X0, … , Xk). If a stem cell divides, then each daughter cell remains in the stem cell compartment with probability ps or proceeds to the X0 compartment with probability 1 − ps. Similarly, if a cell in compartment j (hereafter called a j-type cell) divides, then each daughter cell will remain in the j compartment with probability pj or differentiate into a (j + 1)-type cell with probability 1 − pj. The end products of the cell lineage are fully differentiated cells D, which cannot divide any further and die at a certain rate d. The division rates are r for stem cells and vj for a j-type cell.
Figure 1.
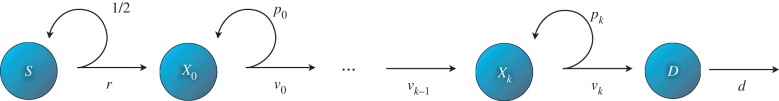
Cell lineage model. Transit cells of j-type cells divide at a rate vj producing two j-type cells with probability pj or two (j + 1)-type cells with probability 1 − pj. Stem cells S divide at a rate r. There are k + 1 intermediate steps until cells become fully differentiated (D). Once they do they exit the cell cycle and die at a certain rate d. (Online version in colour.)
Healthy tissue is highly regulated to ensure homeostasis with feedback loops playing a fundamental role in this regard [26,27]. Thus, if one wishes to examine certain dynamic properties, such as tissue regeneration after an injury, then it is necessary to impose control mechanisms that guarantee the stability of the system. In practice, this means that the division rates (r and vj) and self-renewal probabilities (ps and pj) may be functions that take on different values depending on the state of the system [20–24]. In the case of an injury, the self-renewal probabilities and division rates might temporarily increase to ensure a faster recovery [22], leading to an increased number of divisions per unit of time. Thus, repeated injury and repair might augment the risk of cancer by increasing the number of cell divisions. In particular, control must be imposed on the self-renewal probability of stem cells, because otherwise in a stochastic setting the fate of the lineage would inevitably result in extinction or uncontrolled growth. Here, however, we are concerned only with properties at homeostasis. Hence, we are interested only in the values of r, ps, vj and pj at equilibrium, and the precise nature of the control mechanisms is irrelevant to our analysis.
Next, we consider replication limits in the context of telomere biology. In vivo telomeres interact with a number of proteins, allowing them to be recognized by the cell as being in a protected or ‘capped’ state (for a review, see [4]). As telomeres shorten, they lose their ability to form these capped or protected structures and any further division is then halted. If a cell happens to exhaust its replication capacity but nevertheless attempts mitosis, then senescence or apoptosis would be triggered through the p53 or p16-RB pathways [28]. Several models for cellular replication limits have been proposed. These models use a range of approaches from population dynamics [29–33] to detailed considerations of the molecular mechanisms affecting telomere function [34,35]. In this paper, associated with every cell, there is a number that we call the replication capacity of the cell. When a non-stem cell divides, the replication capacity of the daughter cells will be one unit less than the replication capacity of the parent cell. First, we consider the case where all stem cells have a fixed replication capacity ρ that does not change with time. This setting corresponds to a scenario in which stem cells express enough telomerase to maintain a stable telomere length. (Later, we consider the case where the replication capacity of stem cells diminishes with time.) Here, ρ plays the role of Hayflick's limit and is treated as a parameter. Experimental measurements typically set the value of ρ between 50 and 70 divisions [36]. Biologically, ρ should be large enough to produce and replenish the necessary number of cells required to sustain tissue function during the lifespan of the organism.
We integrate the cell dynamics described above into a single stochastic agent-based model (see §5). In this agent-based formulation, we track cells individually. Every cell has two attributes: a type determined by the compartment it belongs to and a replication capacity. When an intermediate cell divides, the replication capacity of the daughter cells will be one unit less than that of the parent. The same thing occurs if a stem cell divides into two intermediate cells. The cell division events and the death of differentiated cells are decided probabilistically according to the death rate d and the division rates r and vj. If a cell attempting division has exhausted its replication capacity, then division is halted, and the cell is removed from the cell population. If division occurs in compartment j, then the probability of self-renewal will be pj. To decide the fate of a stem cell division, we impose the following simple control mechanism. If the number of stem cells is larger than the equilibrium number S, then the stem cell division results in two intermediate daughter cells, otherwise division results in two daughter stem cells. At homeostasis, equation (2.1) gives the analogous model in terms of ordinary differential equations. The precise correspondence between the agent-based model and this analytical formulation is discussed in §5.
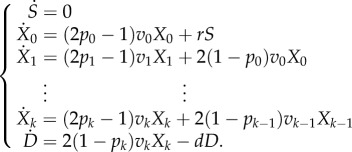 |
2.1 |
3. Results and discussion
We are interested in finding an optimal cell lineage architecture that protects against cancer by minimizing the replication capacity of dividing cells. Stated in this form, however, the problem is not sufficiently constrained. In particular, the target number of differentiated cells D and their death rate d depend on other biological considerations such as tissue function and organismic physiology that lie clearly beyond the scope of the optimization problem. Thus, we consider the outflow of differentiated cells (dD) as a fundamental fixed quantity of the system. With this constraint at hand, we arrive at our first result: a cell lineage architecture concerned only with minimizing the replication capacity of dividing cells would have a stem cell compartment consisting of a single cell (proposition 5.1 in §5). Note that a cell lineage that depends on a single stem cell would be extremely fragile; thus, in vivo the equilibrium number of stem cells must depend on other factors (independent of replication limits) that deal with the robustness of the system. Hence, in broader terms what this result suggests is that a tissue architecture concerned with reducing the risk of cancer should have a very small number of stem cells compared with the total number of cells in the lineage (in the colon epithelium, for example, there might be as little as four stem cells per crypt [37,38]). This result becomes intuitive when we look at the proliferative potential of stem cells in specific tissues. For example, colon stem cells are estimated to divide up to 5000 times during a human lifespan [18]. Thus, the cumulative number of divisions in clones originating from a transformed colon stem cell is potentially enormous, suggesting that replication limits are not an effective mechanism to protect against the accumulation of mutations in stem cells.
If the stem cell compartment is small, then most of the cell divisions required for normal tissue function must be carried out by non-stem cells, where the much smaller replication limits can protect against the sequential accumulation of mutations. As we discussed in §1, the effectiveness of this protection will depend on the replication capacity of the originally transformed cell as it directly influences the likelihood of acquiring subsequent mutations and of escaping the Hayflick limit itself. Even though the proliferative potential of non-stem cells is limited because they are responsible for the overwhelming majority of cell divisions within a tissue, it can be shown that statistically the accumulation of mutations in non-stem cells is possible [38]. Furthermore, for certain types of cancers, there is evidence that the initiating mutations originate in progenitors (for a review, see [39]). Recently, progenitor cell populations have been identified as targets for tumour initiation in a number of leukaemias [40–45] and several types of solid cancer, including glioblastoma, medulloblastoma, prostate cancer, basal cell carcinoma and basal-like breast cancer [46–50]. To study how replication limits and tissue architecture protect against mutations originating outside the stem cell compartment, we treat the influx of stem cells (rS) and the outflow of differentiated cells (dD) as the fundamental fixed quantities of the system, and ask how the number of intermediate cell compartments (k + 1), the self-renewal probabilities (pj) and the cell division rates (vj) affect the replication capacity of dividing cells.
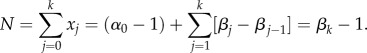
We start by describing some of the fundamental features of the system. As explained above, the flux of cells between the stem cell and differentiated cell compartments (dD − rS) is fixed. At homeostasis, dD − rS equals the number of intermediate cell divisions per unit of time. Thus, if we call the equilibrium number of j-type cells xj, then we have the constraint
| 3.1 |
The steady-state number of cells in compartment j is
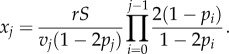 |
3.2 |
From equation (3.2), it follows that increasing the self-renewal probability in a compartment increases the compartment's size and the number of divisions per unit of time in that compartment (vjxj). Hence, given the constraint found in equation (3.1), an increase in the self-renewal probability in one of the compartments must be offset by a change in some other variable of the system. Figure 2a illustrates this situation with two alternative architectures. The same target number of divisions may be reached by a lineage with smaller self-renewal probabilities and a larger number of compartments or by a lineage with larger self-renewal probabilities and fewer compartments.
Figure 2.

Alternative architectures for the same target number of divisions in the intermediate cell population. (a) Increasing the self-renewal probability increases the size and the number of divisions per unit of time of a compartment. The same target number of divisions in the intermediate cell population can be reached by a lineage with smaller self-renewal probabilities and three intermediate compartments (blue), or by a lineage with larger self-renewal probabilities and only two intermediate cell compartments (green). The size of circles is indicative of population size. Bar plots: the average replication capacity and the number of divisions in the compartments depend on the architecture of the cell lineage. (See text for discussion.) In this case, rS = 50, dD = 2100 and all vi = 1. Blue parameters: (p0 = 0.3, p1 = 0.4, p2 = 0). Green parameters: (p0 = 0.41, p1 = 0.41). (b) An increase in the division rate of a compartment produces a decrease in the compartment's size; however, the number of divisions per unit of time and the average replication capacity in a compartment are independent of the division rate. Note that the number of divisions per unit of time increases with each compartment. (See text for discussion.) In this case, rS = 100, dD = 2400, p0 = 0, p1 = 0.4, p2 = 0, v0 = 1, v2 = 1.5 and k = 2. Blue parameters: (v1 = 1). Green parameters: (v1 = 2).
An increase in the division rate in a compartment produces a decrease in the compartment's size (equation (3.2)). If we multiply the expression for xj in equation (3.2) by vj, then we find that, at equilibrium, the number of divisions per unit of time is independent of the division rate. Both these phenomena are demonstrated in figure 2b. Here, an increase in the division rate in one of the compartments results in a reduction in the population size; the number of divisions per unit of time, however, does not change. There is also another feature of the system that is apparent from figure 2b. The relative sizes of the compartments are not necessarily determined by their positions within the lineage; however, the number of divisions occurring in the compartments is. Thus, a more differentiated compartment produces at least the same number of divisions than any of its predecessors. (Indeed, it is easy to see from equation (3.2) that vj − 1xj − 1 ≤ vjxj.)
Let us call aj the expected replication capacity of the j-compartment at equilibrium, which can be intuitively defined as the average number of divisions left for a typical cell in the compartment when the tissue is at homeostasis. There are two important things to remark: first, aj decreases with differentiation (histograms in figure 2a,b) and second, the architecture of a lineage affects the distribution of the replication capacity of the entire population (figure 2). From the point of view of replication limits, the optimal architecture to protect against cancer is one that minimizes the expected replication capacity of a dividing cell. Note that we emphasize the fact that we are interested in the properties of dividing cells and not just cells in general. Given that mutations typically occur during cell division, we need to take into account that compartments with a fast division rate carry an increased risk of producing a transformed cell. Hence, the quantity that we seek to minimize is the expected replication capacity of a dividing cell, which in mathematical terms equals (Σajvjxj)/(rS − dD).
Our next result examines the effect of position within the cell lineage on the replicative potential. If there is only one intermediate cell compartment with self-renewal capabilities, then the distribution of the replication capacity of dividing cells is independent of where this compartment lies within the order of the cell lineage (proposition 5.2 in §5). Figure 3a exemplifies this behaviour in a system with three transit-amplifying cell compartments. Here, only one compartment has a non-zero self-renewal probability, and the distribution of the replication capacity of dividing cells does not change when the self-renewal compartment is alternatively chosen to be either the zeroth or second compartment.
Figure 3.

(a) Distribution of the replication capacity of dividing cells (k = 2, r = 1, vj = 1, S = 50, ρ = 50, p0 or p2 = 0.45). Here self-renewal occurs only in one transit-amplifying cell compartment. Bar plots are produced using the agent-based model and allowing for self-renewal only in compartment 0. Red line is produced using the analytical model allowing for self-renewal only in compartment 2. The distribution does not change when the non-zero self-renewal probability is switched from compartment 0 to compartment 2. See proposition 5.2. (Stem cell and differentiated cell compartments are not depicted in the inset.) (b) Replication capacity of the entire cell population at equilibrium as a function of p0 (k = 1, v = 1, dD − rS = 1716, ρ = 50). Given that dD − rS is fixed the value of p0 = 0 determines the value of p1 (see inset). Note that the minimum occurs when there is self-renewal in only one of the compartments (i.e. p0 or p1 is equal to zero). See lemma 5.4. (c) It is not always possible to reach a specified target number of divisions with only one intermediate compartment. Here, the number of differentiated cells produced by a system with a single intermediate compartment is incapable of producing the target number of differentiated cells (indicated by a half-filled compartment D). In this case, rS = 50, D = 1600, d = 1 and ρ = 20. Results were obtained using the agent-based model. (See text for discussion.)
Next, we study what happens if we distribute the self-renewal potential among several compartments. If the number of compartments is fixed, then the average replication capacity of dividing cells is minimized when there is no more than one self-renewing compartment (lemma 5.4 in §5). This is illustrated in figure 3b where we consider a system with two intermediate cell compartments and plot the average replication capacity for different values of the self-renewal probability of the zeroth compartment. In this instance, where there are only two compartments, the self-renewal probability of one of them completely determines the self-renewal probability of the other (see inset). From figure 3, we note that the average replication capacity is minimized when only one of the compartments has a positive probability of self-renewal.
Given a fixed target of intermediate cell divisions (dD − rS), there is an upper limit to the number of cell compartments. Indeed, if there are k + 1 intermediate compartments, then the equilibrium number of cell divisions per unit of time is always greater than or equal to rS(2k + 1 − 1), from which it is clear that we cannot choose k arbitrarily large. There may also be a lower limit to the number of compartments. First, having only one intermediate cell compartment may lead to too many cells exhausting their replication capacity, making it impossible for the compartment to reach the target number of divisions. For example, in figure 3c, simulations using the agent-based model show that for a given set of values dD − rS and ρ it is impossible to produce the target number of divisions with only one intermediate cell compartment. Hence, a target flux of cells dD − rS and a given maximum replication capacity ρ might preclude certain tissue architectures. Second, it is important to note that every fork in the differentiation pathway of cells adds a new compartment to a cell lineage. Thus, there may be a minimal theoretical number of intermediate cell compartments when different types of mature cells arise from the same kind of stem cell (such is the case of the haematopoietic system, discussed in §4).
Finally, to arrive at our core result, we combine the previous observations with the relation between the self-renewal probabilities and the number of intermediate cell compartments. We find that the average replication capacity of dividing cells is minimized by a tissue architecture in which at most one cell compartment has self-renewal capabilities and the number of compartments is kept as small as possible. Moreover, the replication capacity of the cell population is independent of the position that the self-renewing compartment holds in the hierarchy of the cell lineage (proposition 5.5 in §5). Figure 4a demonstrates these results when there is only one self-renewing compartment. As the number of intermediate cell compartments increases, so does the average replication capacity. Also note that not only the average but also the entire distribution of the replication capacity is deeply affected by the number of compartments and self-renewal probabilities (figure 4b). Figure 4c further highlights these results. Here, two alternative architectures for the same target of intermediate cell divisions are presented. The optimal cell lineage that both minimizes the number of intermediate cell compartments and has only one self-renewing compartment has a significantly lower average replication capacity than that of the alternative architecture.
Figure 4.

(a) Average replication capacity as a function of the number of transit-amplifying cell compartments (k + 1). Here, only one compartment has self-renewal capabilities (vj = 1, dD − rS = 6500, ρ = 70). The average replication capacity increases with (k + 1). See propositions 5.3 and 5.5. (b) Frequency of the replication capacity of dividing cells. In both instances, the number of intermediate cell divisions is the same. In both cases, vj = 1 for all j, ρ = 60 and rS = 50. Red lines: k = 6 and all pj = 0. Blue bars: k = 4, p0 = 0.43 and all other pj = 0. (c) Two alternative architectures for the same target number of intermediate cell divisions (3450). In the cell lineage depicted in blue (k = 2, p0 = p1 = p2 = 0.341), the resulting average replication capacity of dividing cells is 51. An optimal cell lineage depicted in green (k = 1, p0 = 0.485, p1 = 0) minimizes the average replication capacity of dividing cells by minimizing the number of compartments and allowing self-renewal in only one of them. In both cell lineages, rS = 50, ρ = 60 and all v = 1. The average replication capacity of dividing cells is minimized by a tissue architecture in which at most one intermediate cell type has self-renewal capabilities and the number of compartments is kept as small as possible. (See proposition 5.5.)
Next, we turn our attention to the division rates. If there is one intermediate compartment with a slower division rate than all the rest, then it would be optimal as a cancer-preventing strategy if it were the first (zeroth) compartment. In this case, the most ‘dangerous cells’ (i.e. those with the largest replication capacity) would be dividing slower. Indeed, it is reasonable to assume that if a cell starts behaving erratically and breaks away from tissue regulation, it would present a greater threat if it originally comes from a compartment that has a fast division rate. Assuming that the first compartment has the slowest division rate, it would then make sense as a cancer-preventing strategy to have this same compartment be the one with self-renewal capabilities, as this would increase the number of cells with a slow division rate.
Hence, an optimal tissue architecture to protect against cancer is one where the less differentiated cells have a larger rate of self-renewal and a slower rate of cell division. These types of cell dynamics have been repeatedly observed in cell lineages, suggesting that they may have evolved to decrease the risk of cancer. It is important to note, however, that there are other biological issues at play (which are not considered here) which may affect the choice of the cell division rates, such as the speed of tissue generation after an injury.
Finally, we look at the question of whether adult stem cells have a truly unlimited replication capacity. While it is widely acknowledged that adult stem cells have a greater replication capacity than more differentiated cell types, experimental evidence suggests that some adult stem cells experience a diminishment of their replicative potential during the lifespan of the host [51,52]. To address this possibility, we consider a cell lineage model in which the replication capacity of stem cells decreases with time and explore whether our previous results hold in this scenario. More precisely, let ρ(t) be the time-dependent average replication capacity of the stem cell population. We assume a decrease in the replication capacity of the stem cell population that is linear with time. In mathematical terms: ρ(t) = ρ0 − εt. Similarly, let us call aj(t) the time-dependent expected replication capacity of the transit cells in the j-compartment. If the cell population (x0, …, xk) is at equilibrium, then we have
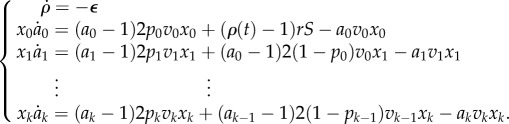 |
3.3 |
To analyse this system of ordinary differential equations (see last part of §5), we develop an approximation formula and compare our results with corresponding implementation of the agent-based model. We find that the central result regarding the optimal architecture to minimize the expected replication capacity of a dividing cell holds when the replicative capacity of stem cells decreases with time. This is demonstrated in figure 5: here, we compare the distributions of the replication capacity of two cell lineages with the same target number of divisions (one with an optimal and one with a suboptimal architecture). Each distribution is presented at two different times. In both instances, the replication capacity of stem cells decreases at the same rate.
Figure 5.
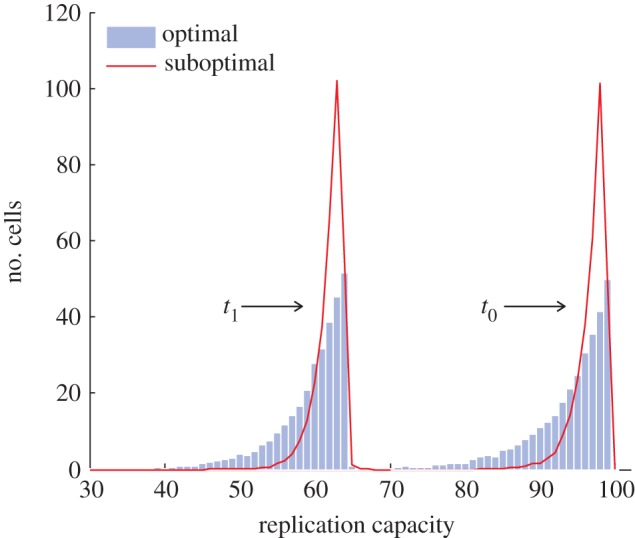
Distribution of the replication capacity of dividing cells for the case when the stem cell replication capacity diminishes with time. Results from two alternative cell lineage architectures for the same target number of intermediate cell divisions are presented. The distributions are shown at two different times t0 = 0 and t1 = 3500. (Units of time equal the mean cell division time of stem cells.) In both cell lineages, all vj = 1, r = 1, S = 50 and ε = 0.02. In the optimal architecture (bars), k = 0 and p0 = 0.42; in the suboptimal architecture (lines), k = 1, p0 = 0.31 and p1 = 0.31. (Online version in colour.)
4. Conclusion
Several of the features that characterize an optimal tissue architecture are found in various cell lineages. Consider the haematopoietic system. At the starting point of this lineage, there are stem cells that are classified into two categories: long-term repopulating stem cells and short-term repopulating stem cells. There are three intermediate cell types: multipotent progenitor cells, common progenitors and precursor cells. Out of the intermediate cells, there is self-renewal only in multipotent progenitors, which in the cell lineage appear immediately downstream from the stem cell population. The end products of the lineages are fully mature differentiated cells that perform tissue function [12,53]. Thus, in the haematopoietic system, it appears that self-renewal occurs only in the first least-differentiated intermediate cell compartment, which is one of the features that we found reduces the replication capacity of the non-stem cell population (although there is some recent ex vivo evidence of self-renewal downstream of progenitors [54]). With regards to the number of intermediate cell compartments, we note that there is no definite agreement on the number of stages of differentiation; however, there appear to be at least two forks in the differentiation pathway. Multipotent progenitors give rise to two different types of common progenitors: common lymphoid progenitors and common myeloid progenitors. These common progenitors further subdivide into two types of precursors, each of which ultimately gives rise to the mature lymphoid and myeloid cells that make up blood. The division rates follow an optimal pattern with division rates increasing with each more differentiated compartment [14]. In addition, the number of stem cells is small compared with the total number of blood cells [12].
Neural tissues also exhibit characteristics of an optimal tissue architecture. In the process of adult neurogenesis, multipotent neural stem cells give rise to intermediate neuron progenitors that exhibit some degree of self-renewal. The neuron progenitors, in turn, give rise to cells that exit the cell cycle and differentiate into neurons [22,55]. A similar organization has been observed in the production of glia cells. Neural stem cells give rise to intermediate glia progenitors, which exhibit some degree of self-renewal and produce the different types of mature glia cells [55].
In most tissues, however, there is some uncertainty about the precise hierarchical structure of the cell lineage. For example, in adult neurogenesis, the number of intermediate cell compartments is alternatively reported as one or two [15,22]. Part of this uncertainty is explained by a lack of a clear standard to distinguish between stem cells and progenitor cells. In many tissues, there is also uncertainty about the self-renewal capabilities of intermediate cells. It is often unclear whether an experimentally observed transit-amplifying behaviour is produced by a cell programme that allows for a fixed number of divisions in progenitor cells, or by some degree of self-renewal. A cell programme that calls for a fixed number of divisions would be represented in our framework as a lineage with numerous intermediate compartments and no self-renewal. By contrast, through a self-renewal mechanism, the cell's decision to differentiate would be independent of the number of previous divisions and instead be determined by the current state of the cell's microenvironment. As we have discussed here, the two mechanisms may be able to produce the same results in terms of population sizes. Yet, our model demonstrates that the precise architecture of a cell lineage has dramatic implications for the replication capacity of a cell population, and thus the risk of cancer. Experiments should be devised to characterize not only the transit-amplifying behaviour of intermediate cells but also to determine which mechanisms different systems use. Finally, we note that when interpreting the model's results to a specific biological system, it is important that the biological description of a ‘cell compartment’ agrees with the one presented here. In particular, within the model's framework, a common surface marker cannot be used to define a cell compartment if it is expressed by a heterogeneous group of cells with inherently different self-renewal capabilities.
In this paper, we have demonstrated that a lineage's architecture can significantly impact the goal of reducing the replicative potential of cells. These findings underscore the importance of fully understanding a lineage's architecture as well as the precise mechanisms used to accomplish transit-amplifying behaviour. The fact that at least some of the features that characterize an optimal architecture are present in various tissues suggests that they might have evolved to minimize cancer risk. This however does not mean that tissues must follow all aspects that define an optimal architecture. What we have described here is only one of possibly many evolutionary forces that shape a tissue's architecture. There could be other forces unrelated to reducing the risk of cancer, which also play a role in ultimately determining the architecture of a specific tissue. A better understanding of how a tissue's architecture and replicative limits impact the likelihood of cancer can provide insights into cancer biology that may lead to new targets of therapy.
5. Methods
From system (2.1), we find two expressions for the steady-state number of cells in compartment j (which we will need later):
 |
In compartment j at any given time, there are: vjxj cells leaving the compartment; 2pjvjxj new j-type cells created through symmetric divisions; and 2(1 − pj −1)vj −1 xj −1 cells arriving from compartment j − 1. If the system is at equilibrium, then the expected replication capacity of the cells coming into the compartment must be the same as the expected replication capacity of the cells leaving the compartment. Thus, if we call ai the expected replication capacity of the i-compartment at equilibrium, then we find that
and using the relation previously found between  and
and  , we find
From where we have
 |
Proposition 5.1. —
If the equilibrium number of stem cells S is not fixed a cell lineage that minimizes the average replication capacity of a dividing cell necessarily has S = 1.
Proof —
(by contradiction). In this case, the system is constrained by the equation ∑vjxj + rS = dD, where r, d and D are fixed. Clearly, S cannot be smaller than 1. Suppose now that there is a cell lineage that minimizes the average replication capacity of a dividing cell with S ≥ 2. This lineage is defined by a given stem cell division rate r and a set of parameters {pj, vj}j =0, …,k. Let us define an alternative architecture with one more intermediate cell compartment defined by the same stem cell division rate and a set of parameters
that satisfy
and
for j > 0.
If we make
and
, then
and
for all j > 0. It follows that this new cell lineage also satisfies
. Furthermore, if we respectively call the average replication capacities of the jth compartments aj and
, then we find
and
for j > 0. The variable aj refers to a specific compartment (the jth compartment). We are also interested in the variable A, the expected replication capacity of a dividing cell in the entire population. We find: the expected replication capacity of a dividing cell
for the original cell linage and
for the new cell lineage. Clearly,
which is a contradiction.▪
Proposition 5.2. —
Let v, r, s, d, D and k be fixed and assume there is at most one compartment j of transit-amplifying cells for which pj > 0. Then, the value of pj, and the distribution of the replication capacity of the transit cell population at equilibrium are independent of j.
Proof. —
Let N = ∑xj be the total steady-state number of transit-amplifying cells. Using the previously derived expression for xj, we find after simplifying
which implicitly defines pj as a function of N and k independent of j.
We want to look at the distribution of the replication capacity of the entire cell population at equilibrium. To simplify the notation, we assume rS/v = 1 (the case rS/v ≠ 1 follows immediately from this). Let x(a) be the number of cells in the entire population that have replication capacity a at equilibrium, and
the corresponding number of j type cells. Let us assume that pj = 0 ∀j ≠ s. Then, for j = 0, … , s − 1, we have
For j = s, we have
Moreover, it can be shown that j = 1, … , k − s:
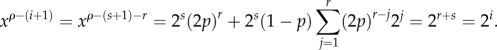
First, we will show that xρ −(k + 1) − r is independent of s for r > 0. We have
But then, after simplifying, we obtain
Now, we want to look at the values of xρ −(i + 1) for 0 ≤ i ≤ k − 1. If i < s, then clearly x(i) = 2i. If i ≥ s, then we can call r = i − s and we find
Thus, we find that the distribution of the cell replication capacity is independent of the choice of the self-renewing compartment.▪
Proposition 5.3. —
Suppose that all the vj are equal and consider v, r, S, d and D fixed. If at most one pj > 0, we want to find the pair (p, k) that minimizes the entire replication capacity of the transit cell population at equilibrium. Under this condition, the entire replication capacity of the transit cell population at equilibrium is minimized by choosing p as large as possible subject to the restriction ak ≥ 1.
Proof. —
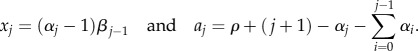
We proved that if at most one pi > 0, then the entire replication capacity of the transit cell population is independent of the choice of i. Thus, without loss of generality, we assume i = 0. Let α = (1 − p)/(1 − 2p), N be the steady-state number of transit cells and k the number of compartments, then
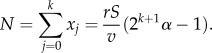
We also have xk = (rS/v)2kα from where it follows that 2xk = N + rS/v. On the other hand, dD = 2vxk and we find that N is completely determined by rS, dD and v:
Now, the entire replication capacity of the j-compartment at equilibrium is aj = ρ − (j + 1) − 2(α − 1) for all j. We want to minimize A = ∑ajxj. We have
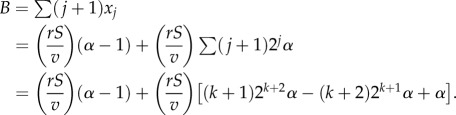
The first term on the l.h.s. of the previous equation equals N[ρ − 2(α − 1)]. Given that x0 = (rS/v)(2α − 1) and xj = (rS/v)· 2jα for j > 0, we can decompose the second term (let us call it B) in the following way:
Now, we call c = rS/v and n = k + 1. Then, using the fact that 2nαc = N + c, we find that
Hence, to minimize A, we should maximize 2α + n. Given that nlog(2) + log(α) = log(N/c + 1), if we write f(α) = 2α − log(α)/log(2), then we find that 2α + n equals
It is easy to prove that the f : [1, ∞] → R is a decreasing function. Hence, to minimize A, we should make α as large as possible, which is equivalent to choosing p as large as possible given the restriction ak ≥ 1.▪
Lemma 5.4. —
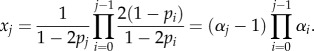
For any pair (N, k), let {yj} be the sequence defined by y0 = 1/(1 − 2p), yj = 2j(1 − p)/(1 − 2p) for 0 < j < k and
, and bj be the average replication capacity of the jth compartment at equilibrium. Then, for any other sequence {xj}, with average replication capacities aj that satisfies
, we have
Proof. Preliminaries. —
First, let us write αi = 2(1 − pi)/(1 − 2pi) ⇒ 1/(1 − 2pi) = αi − 1. For j > 0, we then have
Calling
, we have xj = βj − βj−1 for j > 0. Thus, we can write
Thus, we have
Proof of (1). —
Note that following the previous definitions
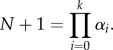
. Thus, the problem reduces to the maximization of ∑αj subject to the conditions: (i)
, (ii) αi ≥ 2, and (iii) αk ≥ 0. Let us assume that {αi} satisfy the conditions stated above. Assume that at least two of the αi are greater than two. Without loss of generality, let them be α0 and α1. We can write N + 1 = Pα0α1 and S = s + (α0 + α1). We want to maximize α0 + α1 subject to A = (N + 1)/P = α0α1. Which means we want to maximize α0 + A/α0. It is easy to see that this function has a unique minimum at
and thus the maximum occurs at the endpoints of its domain which is [2, A/2].
Proof of (2). —
We will prove this part of the proposition using the principle of mathematical induction.
Base step
Let k = 2, then N + 1 = α0α1 and
Given this last expression, the problem for minimizing S reduces to the maximization of α0 + α1, subject to the conditions N + 1 = α0α1 and a1 ≥ 0 ⇔ r + 2 − (α0 + α1) ≥ 0. From the symmetry of these equations, it easy to prove that the minimization occurs when either α0 or α1 equals 2 ⇒ either p0 or p1 equals 0.
Induction step
Assume the proposition is true for n = k − 1. Let (x0, … , xk) be defined by P = (p0, … , pk) and assume that the sequence {xj} minimizes the replication capacity of the X population subject to the condition N = ∑xj.
Case A: there is a single pj ≥ 0 for j ≤ k. Then, there is nothing to prove.
Case B: there are at least two pj > 0 for j ≤ k − 1 (we will prove this leads to a contradiction).
Let us call
. Make
for j > 0 and
such that
. Now by the induction hypothesis
. Note that
Given that xk = yk, it follows that
and then we have
From part (1), we have bk −1 ≤ ak −1 and thus it follows that
which means that {xj} does not minimize the entire replication capacity of the transit cell population →←.
Case C: there is one pj ≠ 0 for j < k − 1 and pk ≠ 0.
If we prove that A = ∑ ajxj is invariant under a permutation pi ↔ pj. Then, the situation reduces to case B. It is sufficient to prove that A is invariant under pj ↔ pj+1. Note that
After the permutation,
and
. Then
From where
and it follows that the permutation A is invariant under this permutation.▪
Proposition 5.5. —
Suppose that all the vj are equal and consider v, r, S, d and D fixed. Then, to minimize the entire replication capacity of the transit cell population at equilibrium, make at most one pj > 0 and choose the pair (pj, k) such that pj is the largest possible subject to the restriction ak ≥ 0. Furthermore, the value of pj, and the distribution of the replication capacity of the transit cell population at equilibrium are independent of j.
Proof. —
Let k and P = (p0, … , pk) be such that the sequence they define (x0, … , xk) minimizes A = ∑ajxj. Subject to the restrictions imposed by the choice of parameters r, s, v and D. Because of proposition 5.3, there is at most one j such that pj > 0. Furthermore, because of lemma 5.4, the pair (k, pj) is such that among all pairs (K, Pj) that fit the parameters pj is maximum subject to the restriction ak ≥ 1. The last statement of the proposition follows straight from proposition 5.2.▪
5.1. Agent-based model
An agent-based stochastic version of the model is implemented as an algorithm. At any given time t, the system is described by a set of cells, each of which has two attributes: a real number representing its replication capacity and a type. If we call A = rS + dD(t) + ∑vixi(t), then the probability that the next reaction involves a j-type cell is vixi(t)/A(t), and the probabilities that it involves a differentiated cell or a stem are Sr/A(t) and dD(t)/A(t), respectively. Once a type of cell is selected, a random cell among all cells of this particular type is selected. Then, we proceed in the following way.
— If division occurs in an intermediate cell, then the two offspring of the parent cell will have a replication capacity one unit smaller than that of the parent cell. If division occurs in a j-type cell, then the probability of self-renewal is pj. If the cell attempting division has a zero replication capacity, then division is halted and the cell is removed from the cell population.
— If division occurs in a stem cell and the current number of stem cells S(t) is less than the equilibrium value
 , then we make ps = 1 and if
  , then we make ps = 0. This is a simple way of establishing control in the stem cell population. As we mentioned before, we are interested only in equilibrium properties of the intermediate cell population system so any control mechanism on the number of stem cells will suffice.
— If a differentiated cell is selected, then the only possible event is cell death.
— The time when the next reaction occurs is exponentially distributed with mean equal to 1/A(t).
The difference between the ODE model and the agent-based model lies with the fraction of cells at equilibrium that exhaust their replication capacity and nevertheless attempt cell division. In the ODE model, there is no built-in mechanism to prevent such cells from dividing. In the agent-based model, division is halted, and the cells are removed from the population. For an optimal architecture, this fraction f is given by
Typical experimental measurements for ρ yield a value of approximately 50–70 divisions [36] and proposed models for the number of transit-amplifying cell types in several tissues, including blood, neurons and hair [12], set the number of intermediate cell compartments (k + 1) between one and four. These values for ρ and k + 1 produce a very large exponent on the right-hand side of the previous inequality suggesting a small value for f. In figure 3a, we show results from the agent-based model that show very good agreement with the corresponding analytical model, suggesting that the latter adequately captures the essential dynamics of the system.
5.2. Decrease in the replication capacity of stem cells
First, assuming that the cell population is at equilibrium, we derive an approximation formula for aj(t) the expected replication capacity of the j-type population as a function of time. Under this condition we have rS = x0v0(1 − 2p0) which means that
Hence, we can write  , where K and B are constants. From here, we find
for some constant C0 and it follows that
Let us call Kj = (2pj − 1)vj. We find after simplifying
and we find
 |
Note that  and
and 
 .
.
From these considerations, it follows that
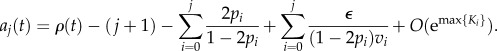 |
Finally, note that all the Ki are negative, hence the O(emax{Ki}) in the previous expression goes to zero exponentially fast. We may thus neglect this term and find a good approximation to aj(t).
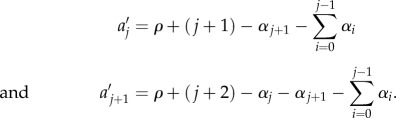
Now we would like to address the optimality results previously derived, this time in the context of a replication capacity of stem cells that decreases with time. Consider the case where all the vj = v are equal. Once again, we assume that the cell population is at equilibrium and thus the aj(t) are well approximated by the following formula:
 |
Let us write αi = 2(1 − pi)/(1 − 2pi) and call  . If ε = 0, then we find after simplifying that aj = ρ + F(j). If ε > 0, then similarly we find aj(t) = ρ(t) + (1 − ε/v)F(j). Thus, to minimize ∑aj(t)xj, we need to focus only on minimizing (1 − ε/v)∑F(j)xj and it follows that the choice of parameters that minimize S the expected replication capacity when ε = 0 also minimize S(t) when ε > 0.
References
- 1.Hayflick L, Moorhead P. 1961. Serial cultivation of human diploid cell strains. Exp. Cell Res. 25, 585–621. ( 10.1016/0014-4827(61)90192-6) [DOI] [PubMed] [Google Scholar]
- 2.Harley CB, Futcher AB, Greider CW. 1990. Telomeres shorten during ageing of human fibroblasts. Nature 345, 458–460. ( 10.1038/345458a0) [DOI] [PubMed] [Google Scholar]
- 3.Blackburn E. 1991. Structure and function of telomeres. Nature 350, 569–573. ( 10.1038/350569a0) [DOI] [PubMed] [Google Scholar]
- 4.de Lange T. 2005. Shelterin: the protein complex that shapes and safeguards human telomeres. Genes Dev. 19, 2100–2110. ( 10.1101/gad.1346005) [DOI] [PubMed] [Google Scholar]
- 5.Olovnikov AM. 1973. A theory of marginotomy: the incomplete copying of template margin in enzymic synthesis of polynucleotides and biological significance of the phenomenon. J. Theor. Biol. 41, 181–190. ( 10.1016/0022-5193(73)90198-7) [DOI] [PubMed] [Google Scholar]
- 6.Makarov V, Hirose Y, Langmore J. 1997. Long g tails at both ends of human chromosomes suggest a c strand degradation mechanism for telomere shortening. Cell 88 657–666. ( 10.1016/S0092-8674(00)81908-X) [DOI] [PubMed] [Google Scholar]
- 7.von Zglinicki T. 2002. Oxidative stress shortens telomeres. Trends Biochem. Sci. 27, 339–344. ( 10.1016/S0968-0004(02)02110-2) [DOI] [PubMed] [Google Scholar]
- 8.Counter CM, Avilion AA, LeFeuvre CE, Stewart NG, Greider CW, Harley CB, Bacchetti S. 1992. Telomere shortening associated with chromosome instability is arrested in immortal cells which express telomerase activity. EMBO J. 11, 1921–1929. [DOI] [PMC free article] [PubMed] [Google Scholar]
- 9.Chin K, et al. 2004. In situ analyses of genome instability in breast cancer. Nat. Genet. 36, 984–988. ( 10.1038/ng1409) [DOI] [PubMed] [Google Scholar]
- 10.Piatyszek M, Prowse K, Harley C, West M, Ho P, Coviello G, Wright W, Weinrich S, Shay J. 1994. Specific association of human telomerase activity with immortal cells and cancer. Science 266, 2011–2015. ( 10.1126/science.7605428) [DOI] [PubMed] [Google Scholar]
- 11.Reya T, Morrison S, Clarke M, Weissman I. 2001. Stem cells, cancer, and cancer stem cells. Nature 414, 105–111. ( 10.1038/35102167) [DOI] [PubMed] [Google Scholar]
- 12.Shizuru JA, Negrin RS, Weissman IL. 2005. Hematopoietic stem and progenitor cells: clinical and preclinical regeneration of the hematolymphoid system. Annu. Rev. Med. 56, 509–538. ( 10.1146/annurev.med.54.101601.152334) [DOI] [PubMed] [Google Scholar]
- 13.Frank SA. 2007. Dynamics of cancer: incidence, inheritance, and evolution. Princeton, NJ: Princeton University Press. [PubMed] [Google Scholar]
- 14.Passegué E, Wagers AJ, Giuriato S, Anderson WC, Weissman IL. 2005. Global analysis of proliferation and cell cycle gene expression in the regulation of hematopoietic stem and progenitor cell fates. J. Exp. Med. 202, 1599–1611. ( 10.1084/jem.20050967) [DOI] [PMC free article] [PubMed] [Google Scholar]
- 15.Gage F. 2000. Mammalian neural stem cells. Science 287, 1433–1438. ( 10.1126/science.287.5457.1433) [DOI] [PubMed] [Google Scholar]
- 16.Potten C, Booth C. 2002. Keratinocyte stem cells: a commentary. J. Invest. Dermatol. 119, 888–899. ( 10.1046/j.1523-1747.2002.00020.x) [DOI] [PubMed] [Google Scholar]
- 17.Okumura T, Shimada Y, Imamura M, Yasumoto S. 2003. Neurotrophin receptor p75NTR characterizes human esophageal keratinocyte stem cells in vitro. Oncogene 22, 4017–4026. ( 10.1038/sj.onc.1206525) [DOI] [PubMed] [Google Scholar]
- 18.Marshman E, Booth C, Potten C. 2002. The intestinal epithelial stem cell. Bioessays 24, 91–98. ( 10.1002/bies.10028) [DOI] [PubMed] [Google Scholar]
- 19.Reya T, Clevers H. 2005. Wnt signalling in stem cells and cancer. Nature 434, 843–850. ( 10.1038/nature03319) [DOI] [PubMed] [Google Scholar]
- 20.Johnston MD, Edwards CM, Bodmer WF, Maini PK, Chapman SJ. 2007. Mathematical modeling of cell population dynamics in the colonic crypt and in colorectal cancer. Proc. Natl Acad. Sci. USA 104, 4008–4013. ( 10.1073/pnas.0611179104) [DOI] [PMC free article] [PubMed] [Google Scholar]
- 21.Marciniak-Czochra A, Stiehl T, Ho AD, Jäger W, Wagner W. 2009. Modeling of asymmetric cell division in hematopoietic stem cells—regulation of self-renewal is essential for efficient repopulation. Stem Cells Dev. 18, 377–385. ( 10.1089/scd.2008.0143) [DOI] [PubMed] [Google Scholar]
- 22.Lander AD, Gokoffski KK, Wan FYM, Nie Q, Calof AL. 2009. Cell lineages and the logic of proliferative control. PLoS Biol. 7, e15 ( 10.1371/journal.pbio.1000015) [DOI] [PMC free article] [PubMed] [Google Scholar]
- 23.Bocharov G, Quiel J, Luzyanina T, Alon H, Chiglintsev E, Chereshnev V, Meier-Schellersheim M, Paul WE, Grossman Z. 2011. Feedback regulation of proliferation vs. differentiation rates explains the dependence of CD4 T-cell expansion on precursor number. Proc. Natl Acad. Sci. USA 108, 3318–3323. ( 10.1073/pnas.1019706108) [DOI] [PMC free article] [PubMed] [Google Scholar]
- 24.Rodriguez-Brenes IA, Komarova NL, Wodarz D. 2011. Evolutionary dynamics of feedback escape and the development of stem-cell-driven cancers. Proc. Natl Acad. Sci. USA 108, 18 983–18 988. ( 10.1073/pnas.1107621108) [DOI] [PMC free article] [PubMed] [Google Scholar]
- 25.Werner B, Dingli D, Lenaerts T, Pacheco JM, Traulsen A. 2011. Dynamics of mutant cells in hierarchical organized tissues. PLoS Comput. Biol. 7, e1002290 ( 10.1371/journal.pcbi.1002290) [DOI] [PMC free article] [PubMed] [Google Scholar]
- 26.McPherron AC, Lawler AM, Lee SJ. 1997. Regulation of skeletal muscle mass in mice by a new TGF-β superfamily member. Nature 387, 83–90. ( 10.1038/387083a0) [DOI] [PubMed] [Google Scholar]
- 27.Wu H-H, Ivkovic S, Murray RC, Jaramillo S, Lyons KM, Johnson JE, Calof AL. 2003. Autoregulation of neurogenesis by GDF11. Neuron 37, 197–207. ( 10.1016/S0896-6273(02)01172-8) [DOI] [PubMed] [Google Scholar]
- 28.Smogorzewska A, de Lange T. 2002. Different telomere damage signaling pathways in human and mouse cells. EMBO J. 21, 4338–4348. ( 10.1093/emboj/cdf433) [DOI] [PMC free article] [PubMed] [Google Scholar]
- 29.Marciniak-Czochra A, Stiehl T, Wagner W. 2009. Modeling of replicative senescence in hematopoietic development. Aging (Albany NY) 1, 723–732. [DOI] [PMC free article] [PubMed] [Google Scholar]
- 30.Glauche I, Thielecke L, Roeder I. 2011. Cellular aging leads to functional heterogeneity of hematopoietic stem cells: a modeling perspective. Aging Cell 10, 457–465. ( 10.1111/j.1474-9726.2011.00692.x) [DOI] [PubMed] [Google Scholar]
- 31.Enderling H, Hlatky L, Hahnfeldt P. 2009. Migration rules: tumours are conglomerates of self-metastases. Br. J. Cancer 100, 1917–1925. ( 10.1038/sj.bjc.6605071) [DOI] [PMC free article] [PubMed] [Google Scholar]
- 32.Arkus N. 2005. A mathematical model of cellular apoptosis and senescence through the dynamics of telomere loss. J. Theor. Biol. 235, 13–32. ( 10.1016/j.jtbi.2004.12.016) [DOI] [PubMed] [Google Scholar]
- 33.Olofsson P, Kimmel M. 1999. Stochastic models of telomere shortening. Math. Biosci. 158, 75–92. ( 10.1016/S0025-5564(98)10092-5) [DOI] [PubMed] [Google Scholar]
- 34.Rodriguez-Brenes IA, Peskin CS. 2010. Quantitative theory of telomere length regulation and cellular senescence. Proc. Natl Acad. Sci. USA 107, 5387–5392. ( 10.1073/pnas.0914502107) [DOI] [PMC free article] [PubMed] [Google Scholar]
- 35.Proctor CJ, Kirkwood TBL. 2002. Modelling telomere shortening and the role of oxidative stress. Mech. Ageing Dev. 123, 351–363. ( 10.1016/S0047-6374(01)00380-3) [DOI] [PubMed] [Google Scholar]
- 36.Huffman KE, Levene SD, Tesmer VM, Shay JW, Wright WE. 2000. Telomere shortening is proportional to the size of the g-rich telomeric 3’-overhang. J. Biol. Chem. 275, 19 719–19 722. ( 10.1074/jbc.M002843200) [DOI] [PubMed] [Google Scholar]
- 37.Bach SP, Renehan AG, Potten CS. 2000. Stem cells: the intestinal stem cell as a paradigm. Carcinogenesis 21, 469–476. ( 10.1093/carcin/21.3.469) [DOI] [PubMed] [Google Scholar]
- 38.Komarova NL, Wang L. 2004. Initiation of colorectal cancer: where do the two hits hit? Cell Cycle 3, 1558–1565. ( 10.4161/cc.3.12.1186) [DOI] [PubMed] [Google Scholar]
- 39.Visvader JE. 2011. Cells of origin in cancer. Nature 469, 314–322. ( 10.1038/nature09781) [DOI] [PubMed] [Google Scholar]
- 40.Guibal FC, et al. 2009. Identification of a myeloid committed progenitor as the cancer-initiating cell in acute promyelocytic leukemia. Blood 114, 5415–5425. ( 10.1182/blood-2008-10-182071) [DOI] [PMC free article] [PubMed] [Google Scholar]
- 41.Krivtsov AV, et al. 2006. Transformation from committed progenitor to leukaemia stem cell initiated by MLL-AF9. Nature 442, 818–822. ( 10.1038/nature04980) [DOI] [PubMed] [Google Scholar]
- 42.Goardon N, et al. 2011. Coexistence of LMPP-like and GMP-like leukemia stem cells in acute myeloid leukemia. Cancer Cell 19, 138–152. ( 10.1016/j.ccr.2010.12.012) [DOI] [PubMed] [Google Scholar]
- 43.Wojiski S, Guibal FC, Kindler T, Lee BH, Jesneck JL, Fabian A, Tenen DG, Gilliland DG. 2009. PML-RARα initiates leukemia by conferring properties of self-renewal to committed promyelocytic progenitors. Leukemia 23, 1462–1471. ( 10.1038/leu.2009.63) [DOI] [PMC free article] [PubMed] [Google Scholar]
- 44.Huntly BJP, et al. 2004. MOZ-TIF2, but not BCR-ABL, confers properties of leukemic stem cells to committed murine hematopoietic progenitors. Cancer Cell 6, 587–596. ( 10.1016/j.ccr.2004.10.015) [DOI] [PubMed] [Google Scholar]
- 45.Cozzio A, Passegué E, Ayton PM, Karsunky H, Cleary ML, Weissman IL. 2003. Similar MLL-associated leukemias arising from self-renewing stem cells and short-lived myeloid progenitors. Genes Dev. 17, 3029–3035. ( 10.1101/gad.1143403) [DOI] [PMC free article] [PubMed] [Google Scholar]
- 46.Friedmann-Morvinski D, Bushong EA, Ke E, Soda Y, Marumoto T, Singer O, Ellisman MH, Verma IM. 2012. Dedifferentiation of neurons and astrocytes by oncogenes can induce gliomas in mice. Science 338, 1080–1084. ( 10.1126/science.1226929) [DOI] [PMC free article] [PubMed] [Google Scholar]
- 47.Schüller U, et al. 2008. Acquisition of granule neuron precursor identity is a critical determinant of progenitor cell competence to form shh-induced medulloblastoma. Cancer Cell 14, 123–134. ( 10.1016/j.ccr.2008.07.005) [DOI] [PMC free article] [PubMed] [Google Scholar]
- 48.Goldstein AS, Huang J, Guo C, Garraway IP, Witte ON. 2010. Identification of a cell of origin for human prostate cancer. Science 329, 568–571. ( 10.1126/science.1189992) [DOI] [PMC free article] [PubMed] [Google Scholar]
- 49.Youssef KK, Van Keymeulen A, Lapouge G, Beck B, Michaux C, Achouri Y, Sotiropoulou PA, Blanpain C. 2010. Identification of the cell lineage at the origin of basal cell carcinoma. Nat. Cell Biol. 12, 299–305. ( 10.1038/ncb2031) [DOI] [PubMed] [Google Scholar]
- 50.Lim E, et al. 2009. Aberrant luminal progenitors as the candidate target population for basal tumor development in BRCA1 mutation carriers. Nat. Med. 15, 907–913. ( 10.1038/nm.2000) [DOI] [PubMed] [Google Scholar]
- 51.Flores I, Benetti R, Blasco MA. 2006. Telomerase regulation and stem cell behaviour. Curr. Opin. Cell Biol. 18, 254–260. ( 10.1016/j.ceb.2006.03.003) [DOI] [PubMed] [Google Scholar]
- 52.Flores I, Canela A, Vera E, Tejera A, Cotsarelis G, Blasco MA. 2008. The longest telomeres: a general signature of adult stem cell compartments. Genes Dev. 22, 654–667. ( 10.1101/gad.451008) [DOI] [PMC free article] [PubMed] [Google Scholar]
- 53.Lobo NA, Shimono Y, Qian D, Clarke MF. 2007. The biology of cancer stem cells. Annu. Rev. Cell Dev. Biol. 23, 675–699. ( 10.1146/annurev.cellbio.22.010305.104154) [DOI] [PubMed] [Google Scholar]
- 54.England SJ, McGrath KE, Frame JM, Palis J. 2011. Immature erythroblasts with extensive ex vivo self-renewal capacity emerge from the early mammalian fetus. Blood 117, 2708–2717. ( 10.1182/blood-2010-07-299743) [DOI] [PMC free article] [PubMed] [Google Scholar]
- 55.Sanai N, Alvarez-Buylla A, Berger MS. 2005. Neural stem cells and the origin of gliomas. N. Engl. J. Med. 353, 811–822. ( 10.1056/NEJMra043666) [DOI] [PubMed] [Google Scholar]