Abstract
The muscular layer of the uterus (myometrium) undergoes profound changes in global excitability prior to parturition. Here, a mathematical model of the myocyte network is developed to investigate the hypothesis that spatial heterogeneity is essential to the transition from local to global excitation which the myometrium undergoes just prior to birth. Each myometrial smooth muscle cell is represented by an element with FitzHugh–Nagumo dynamics. The cells are coupled through resistors that represent gap junctions. Spatial heterogeneity is introduced by means of stochastic variation in coupling strengths, with parameters derived from physiological data. Numerical simulations indicate that even modest increases in the heterogeneity of the system can amplify the ability of locally applied stimuli to elicit global excitation. Moreover, in networks driven by a pacemaker cell, global oscillations of excitation are impeded in fully connected and strongly coupled networks. The ability of a locally stimulated cell or pacemaker cell to excite the network is shown to be strongly dependent on the local spatial correlation structure of the couplings. In summary, spatial heterogeneity is a key factor in enhancing and modulating global excitability.
Keywords: uterus, myometrium, gap junction, modelling, Fitzhugh–Nagumo, parturition
1. Introduction
The myometrium is the muscular layer that constitutes the bulk of the uterine wall. It is a syncytium of interconnected smooth muscle cells, forming an excitable medium [1], i.e. a nonlinear dynamical system that can propagate signals over long distances without damping. In the myometrium, these propagating signals trigger phasic contractions [2]. The behaviour of the myometrium as an excitable medium is thought to be influenced by the spatial variations in the excitability of individual muscle cells as well as the strength of their interconnections [3]. The modulation of global excitation by network heterogeneity may play an important role in the myometrium during pregnancy. Sufficient coupling is needed for excitation to spread, but this coupling need not be uniform, or even exist between all cells. The aim of this paper is to examine how spatial heterogeneity, in particular local variations in cell connectivity, affects global excitability. Furthermore, we study the ability of pacemaker cells to drive the network as a function of its spatial heterogeneity.
In the rodent (as in most mammals), the myometrium consists of an inner circular layer and an outer longitudinal layer of smooth muscle cells [4]. In humans, these layers are less distinct [5]. Through most of pregnancy, the myometrium remains in a predominantly quiescent state as the fetus develops [6]. However, in the days leading up to parturition, contractile activity in the myometrium undergoes major changes which prepare the uterus for labour [6]. This activation phase involves molecular changes that lead to an increase in contraction frequency, when compared with mid-gestation [7]. A key characteristic of this phase is a profound change in the connectivity between the myometrial smooth muscle cells.
If a stimulus is applied to a smooth muscle cell, its membrane potential undergoes a depolarization before eventually returning to the quiescent resting value. An excitable cell exhibits an all-or-nothing response: a cell either responds with a full excursion of the membrane potential, or barely at all. In particular, when the stimulus exceeds an excitability threshold, the response is an action potential whose magnitude is independent of the size of the (suprathreshold) stimulus. A consequence of this all-or-nothing behaviour is that a stimulus of sufficient amplitude can be reliably propagated across the network.
Pacemaker cells, by contrast, do not require an external stimulus, but exhibit periodic excitations that drive neighbouring non-pacemaker cells. The presence of specialized pacemaker cells in myometrial tissue is much disputed [8–11]. If present, it is likely that the pacemaker cells are not anatomically distinct from non-pacemaker cells and have no fixed location in the uterus [12]. Rather, they would occur dispersed within the matrix of non-pacemaker cells. Therefore, the cells can only be recognized through patterns of electrical activity: a slow depolarization of the smooth muscle membrane which results in the generation of an action potential [13]. The oscillation frequency of a pacemaker cell dictates the rate of uterine contractions.
In order to generate action potentials, a myometrial cell maintains transmembrane gradients of several ionic species by means of active transport across the cell membrane. In humans, the action potential is initiated by an inward, depolarizing current carried by calcium ions [2]. Post-excitation, the cells enter a refractory period, during which they are temporarily unable to become excited [14]. Electrical coupling between myometrial smooth muscle cells is maintained by intercellular channels through which ions and certain metabolites can pass from one cell to another. Each channel consists of two connexons, one contributed by each of the communicating cells; furthermore, each connexon is a complex of six connexin proteins [15]. A gap junction is a cluster of such channels joining two cells electrically. Myometrial gap junctions vary in number over the course of gestation; in fact, an increase in the number of gap junctions in myometrial tissue is indicative of the onset of labour [1]. Moreover, the precise nature of the conditions that stimulate the expression of gap junctions is of considerable clinical importance and an understanding of these conditions may ultimately aid early diagnosis and improve management of pre-term labour [16].
Heterogeneity has long been known to be a factor in the spatial patterns of activation in excitable systems [17]. In particular, electrical heterogeneities can play a role in cardiac arrhythmias and cause a decrease in propagation velocity through the tissue. The propagation of excitation in spatially extended systems through spiral waveforms has been well studied [18,19]. Here, we focus on a question which has received much less attention: whether spatial heterogeneity in connectivity is sufficient to modulate global excitability. We use a mathematical model to investigate how the global excitation of the myometrium is affected by the spatial heterogeneity of the system. Benson et al. [20] analysed a heterogeneously coupled model which is based on FitzHugh–Nagumo dynamics, but this was a continuum-model in which the coupling between cells was not represented explicitly. Spatial heterogeneity was found to assist the transition between quiescence and excitability. However, heterogeneity in coupling alone was not observed to produce synchronous activity. Following these authors, we use the FitzHugh–Nagumo model [21,22] and introduce heterogeneity by generating stochastic coupling structures based on several statistical distributions. These include empirical distributions obtained from experiments performed on myometrial cells taken from mice at the 15th and 18th day of pregnancy (i.e. towards the end of gestation). In addition, we investigate how spatial heterogeneity of the intercellular connections modulates the ability of a pacemaker cell to drive the network.
2. Material and methods
Both in silico and in vitro methods were employed. Myometrial tissue was simulated in a mathematical network model to determine the effect of spatial variations of coupling strengths on the spread of excitation. Since coupling depends on cell capacitance, as explained later, cell capacitance values were taken from pregnant mouse myometrium to define a statistical distribution for coupling values, which was used to construct an asymmetrically coupled model. Furthermore, data from pregnant mouse myometrial cells were used to simulate statistical variation in resting membrane potential for each cell. These physiologically realistic spatial statistics were also used to determine the efficacy of pacemaker cells.
2.1. Experimental methods
2.1.1. Electrophysiological measurements
Animals used were C57BL/6 mice which were time-mated (within a 2 h period) to generate pregnancies with an accurate gestational age. Mice were sacrificed by carbon dioxide inhalation at gestation day 15 or 18, time points towards the end of pregnancy. Strips of myometrium from the longitudinal layer (2 × 2 × 20 mm) were dissected from freshly isolated uteri in ice-cold physiological saline. The strips were washed in Ca2+ and Mg2+-free HBSS (Fisher Scientific) at 37°C for 10, 20 and 30 min sequentially. This was followed by a 45-min incubation in HBSS containing Liberase TM (Roche) at a final concentration of 0.13 units ml−1. Digestion was terminated by several dilutions with fresh HBSS. Cells were dispersed by slow trituration through a wide-bore fire polished glass pipette in HBSS solution. Single myometrial cells were filtered through a 200 μm gauze and stored in HBSS for use within 6 h.
The cell membrane was perforated using the antibiotic amphotericin B (600 μg ml−1) [23]. Cell capacitance was measured in the enzymatically isolated smooth muscle cells using the membrane test facility of the Axopatch 700B amplifier (Axon Instruments). Repetitive square voltage pulses of ΔVm = 10 mV were applied from the holding potential of –60 mV and the current response was measured. The integral of the current as a function of time over the decay phase equals the unloaded charge Qc which is related to the step change in voltage by Qc = CmΔVm, whence Cm can be calculated. Electronic supplementary material, table S1 lists the cell capacitance data obtained in our experiments.
Transmembrane potentials were recorded with an amplifier (Axopatch 700B; Axon Instruments) and a Digidata 1440a computer interface running pCLAMP 10.2 software (Molecular Devices, Sunnyvale, CA, USA). Resting membrane potential values were taken as the mean potential (mV) for the 5-s period immediately after an action potential has occurred.
2.1.2. Data analysis
For the 18-day cell capacitance data, a distribution was fitted as follows. The coefficient of variation was calculated as ξ1 = σ18/μ18, where μ and σ are the mean and s.d. of the experimental data, respectively. The data were normalized by the average value, giving a normalized mean of 1 and a normalized s.d. of ξ1. A lognormal distribution can be characterized by two parameters λ and τ such that the mean is equal to exp(λ + τ2/2) and the variance equals exp{2λ + τ2}(exp{τ2−1}). These parameters satisfy the following system:
 |
2.1 |
The non-dimensional cell capacitance for 18-day pregnant mouse data was found to be distributed as eZ, where Z follows a normal distribution with mean –0.03551 and s.d. 0.2665.
The 15-day data were analysed in a similar fashion. The coefficient of variation was defined as ξ2 = σ15/μ15 using the mean and s.d. of the experimental data. However, the data were normalized by the 18-day mean μ18, with normalized mean α = μ15/μ18. Hence
 |
2.2 |
The non-dimensional cell capacitance for 15-day pregnant mouse data was found to be distributed as eZ, where Z follows a normal distribution with mean –0.2114 and s.d. 0.3073.
2.2. Myometrial network model
The myometrial network model consists of excitable elements interconnected by resistors representing gap junctions. Heterogeneity is introduced in the form of random variations in the strength of the cell-to-cell couplings. We use various statistical models to generate the networks, including two based on cell population statistics taken from the mice data.
2.2.1. Cell model
The Hodgkin–Huxley model of electrogenic cell activity, proposed in 1952, forms the basis for the study of excitable systems [14,24–27]. While the Hodgkin–Huxley model has four state variables, FitzHugh pointed out that the essential dynamical properties are captured by a two-dimensional simplified model [21], for which Nagumo proposed an electric analogue circuit [22]. The simplified model is an excitation–relaxation oscillator with a fast (‘excitation’) state variable v that corresponds to the cell's membrane potential and a slow (‘recovery’) variable w that corresponds to gating kinetics which repolarize the excited cell. The following ordinary differential equations describe this two-variable model:
| 2.3a |
and
| 2.3b |
where I is the input current and A, α, γ, w0, v0 and ε are positive parameters. The values shown in table 1 were used in the simulations presented in §§3.1–3.7, with the exception of ε which was scaled according to cell capacitance in §3.6.
Table 1.
Parameter values used in the simulations in §§3.1–3.7 with the exception of ε in §3.6 which is scaled according to the modal point of the cell capacitance distributions.
| parameter | A | α | γ | w0 | v0 | ε |
| value | 3 | 3 | 0.05 | 0.4 | 0.4 | 0.2 |
The equations were solved using the NDSolve function in Mathematica, which uses a Livermore Solver for Ordinary Differential Equations approach. Results were numerically stable under variation in step size.
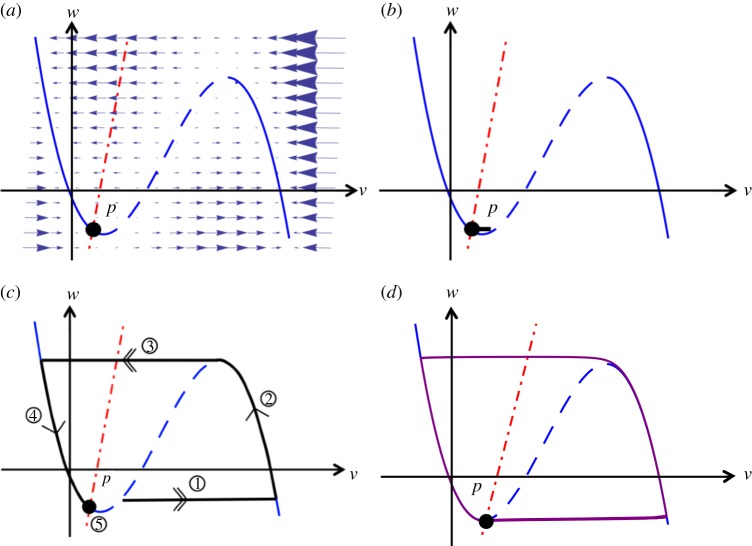
The behaviour of an isolated cell with the input I = 0 is shown in a phase-space diagram (figure 1a). Whereas the null isocline of w is a straight line, the null isocline of v is a cubic polynomial with an unstable branch in the middle, indicated as a dashed line. In the region left of this unstable branch, the phase point tends towards the left stable branch and ultimately towards the intersection of the null isoclines, which forms a stable stationary point. To the right of the unstable branch, the phase point tends rapidly towards the right stable branch, where the slow dynamics of w will drive it upwards until the branch point is attained. The rapid dynamics of v subsequently drives the phase point back to the left stable branch.
Figure 1.
Axes labels v and w represent the non-dimensionalized excitation current and recovery current, respectively. (a) Local dynamics described by equations (2.3a,b). The dashed-dotted line represents the null isocline  , and the curve represents the null isocline
  . The dashed section of the curve is the unstable branch. The fixed point of the dynamics is at P, where the null isoclines meet. Parameters are given in table 1. Trajectories (b) and (c) shown as thick, solid lines, vary depending on the initial perturbation from the equilibrium point P. (b) A small perturbation quickly relaxes back to rest. (c) A large perturbation triggers a substantial response. An initial rapid excitation (1) is followed by a period in which the system remains in an excited state (2). After a rapid relaxation (3), the system enters a refractory period in which no further excitation can take place (4), before regaining excitability as it returns to its rest state (5). (d) Local dynamics described by equations (2.3a,b) for a pacemaker cell. Parameters as in table 2. P is an unstable fixed point, causing continuous re-excitation of the cell after a refractory period. (Online version in colour.)
Excitation corresponds to an excursion along the right stable branch. To reach this branch from the stationary point, a perturbation (Δv) has to be applied on v. If this perturbation is insufficient to move the phase point beyond the unstable branch, the phase point rapidly relaxes back to the equilibrium (figure 1b), whereas sufficiently large perturbations trigger a substantial response (figure 1c). The unstable branch of the null isocline  thus represents a threshold for excitation.
2.2.2. Lattice model
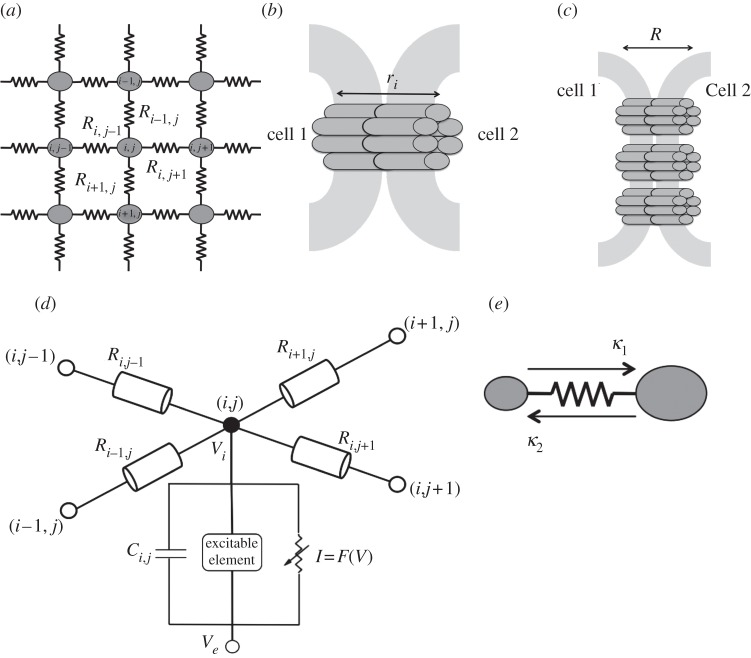
The individual excitable cells were coupled together through resistors into an n × n lattice, as illustrated in figure 2a. The lattice was modelled with closed boundary conditions. The resistors represent the gap junctions between any two adjacent cells. The equivalent resistance of the gap junction can be calculated on the basis of the properties of the individual connexon channels. Let the individual connexon have a resistance ri (figure 2b). Suppose that the gap junction between a given pair of cells consists of n connexons. Because the connexons conduct in parallel, Kirchoff's law for parallel resistors determines the total resistance R of the gap junction (figure 2c)
| 2.4 |
If the connexons have equivalent resistance, ri ≡ r and R = r/n.
Figure 2.
(a) Schematic of the lattice. Cells are referred to using i, j coordinates; the resistance between cells is denoted by R. The resistances are converted into dimensionless coupling values as detailed in §2.2.3. (b,c) The resistance of a gap junction. (b) The resistance ri across an individual connexon (consisting of six connexins). (c) A number of connexons link the two cells. The individual connexons act in parallel, giving an equivalent resistance R. (d) Electrical circuit diagram representing the current flow between connected cells. Cell (i, j) is the cell of interest, coupled to four surrounding cells; R represents the resistances in gap junctions. The circuit at cell (i, j) represents a basic model of an excitable system [28]. Ve represents the external potential, Vi represents the internal potential, Ci,j is the cell capacitance, the excitable element represents the recovery current and the nonlinear current–voltage device (I) represents the fast current. (e) Asymmetry in coupling due to different cell sizes κ1 > κ2.
2.2.3. Coupling constants
A coupling constant K is assigned to each gap junction and defined as follows. The cell membrane is modelled as a capacitor in parallel with a resistor, as indicated in figure 2d. Let Qi denote the membrane charge of cell i, Ci the cell capacitance and Vi the membrane potential. These quantities are related by
| 2.5 |
The gap junctional current between two cells i and j is given by (Vj – Vi)/Rij. Define the coupling constant between cells i and j as Kij = (CiRij)−1 and consider a cell connected to four other cells in a rectangular grid, as shown in figure 2d. The gap junctional current for the central cell is a sum of four gap junctional currents
where (i,j) denotes the location of the cell on the grid. Hence the voltage dynamics for cell (i,j) is given by
 |
2.6 |
where ICh is the total current carried by the ion channels of cell (i, j). The coupling values between any two adjacent cells are as follows:
 |
2.7 |
The coupling value is rendered dimensionless in accordance with the scaled equations for dynamics of the cell network (equations (2.3a,b). As defined here, K is a rate constant. Dimensionless time t in the FitzHugh–Nagumo model is defined by t = R1τ/D, where D is the damping coefficient that captures the inertia of the system induced by the gating kinetics, as shown by FitzHugh [21], dimensional time is represented by τ, and R1 is the passive resistance of the nonlinear current device of the circuit, represented as a tunnel diode by Nagumo et al. [22]. Dimensionless coupling is defined as κ = D/R1K. The dimensionless equations governing the dynamics of the cell in the (i, j)th position are as follows:
 |
2.8a |
and
| 2.8b |
Here Ii,j is the input current applied to cell (i, j). To render the remaining parameters dimensionless, define  where R1 is the passive resistance of the nonlinear element, Ci,j is the capacitance of cell (i, j) and D is the damping coefficient. The quantities R and D are incorporated into the excitable element depicted in figure 2d. The other parameters were scaled in accordance with the derivation given by Keener & Sneyd [28], as detailed in appendix A.
2.2.4. Initial conditions and activation clusters
The initial conditions for each cell correspond to the resting membrane potential and are given by the real solution to the following simultaneous equations:
| 2.9 |
and
| 2.10 |
A perturbation Δv, representing a short-lasting influx of charge, is applied to the cell at the centre of the lattice, displacing it from its stationary point. The cells that become excited as a consequence of this initial perturbation constitute an activation cluster. The ratio of the number of cells in the cluster to the total number of cells in the simulated lattice is used as a measure of the strength of activation.
2.2.5. Spatial structuring
Both homogeneously coupled and heterogeneously coupled cell networks are considered. In the spatially homogeneous case, all couplings are equal, i.e. κi,j = κ ∀(i, j), whereas in the spatially heterogeneous case, the cell–cell couplings κij are allowed to vary with i,j. Two further subcases can be distinguished: (i) symmetric coupling, i.e. κi,j = κj,i ∀(i, j) and (ii) asymmetric coupling, where κi,j ≠ κj,i.
2.2.5.1. Symmetrical coupling: the Bernoulli lattice
To simulate symmetrical coupling, the value κi,j = κj,i is determined probabilistically by
| 2.11 |
where the limiting case p = 1 represents spatial homogeneity. We refer to the lattice defined by equation (2.11) as the Bernoulli lattice. Heterogeneity in the Bernoulli lattice is modulated by varying the amount of connectivity in the lattice, expressed by the parameter p representing the probability of a connection existing between any two given cells.
2.2.5.2. Symmetrical coupling: uniformly distributed
A second type of symmetrical heterogeneity is introduced using a lattice with connections drawn from uniform distributions. In particular, the intercellular couplings are modelled as independent uniform variates on [0.5,10].
2.2.5.3. Spatial correlation in the coupling structure
Distance to the stimulated cell is expressed using the ℓ1 (‘city-block’) measure; electronic supplementary material, figure S1, labels cells according to their ℓ1-distance to the central cell on a 5 × 5 lattice. The correlation function Cr, where r is the ℓ1-distance, is defined as follows:
| 2.12 |
where  denotes the grand mean of coupling over the network and
  is the mean coupling of cell i.
2.2.5.4. Asymmetrical coupling: cell capacitances
Asymmetrical coupling is introduced by allowing variation in cell capacitances (with symmetrical gap junctional conductances). A larger cell has a larger capacitance, and as a result will be more weakly coupled to its neighbours since Ki,j = (CiRi,j)–1 will be smaller (figure 2e). The model assumes that the cell capacitance values are independently lognormally distributed; calculation of realistic parameter values is detailed in §2.1.2. A resistance value is chosen from within a window of values that permit global excitability.
The value of the scaled parameter ε is proportional to the capacitance of the cell. Accordingly, in simulations using day 18 data, the value of ε is normalized by the modal point of the 18-day distribution. Similarly, ε is normalized by the modal point of the 15-day distribution in day 15 simulations.
2.2.5.5. Variability in resting membrane potential
A normal distribution was fit to the normalized resting membrane potential data. The 18-day data serve as a reference point. The non-dimensional resting membrane potential for 18-day pregnant data is normally distributed with mean 1 and s.d. 0.1615, whereas the non-dimensional resting membrane potential for 15-day pregnant data is normally distributed with mean 1.046 and s.d. 0.08737.
Equations (2.9) and (2.10) can be solved simultaneously to find an expression for the value of v in the steady state. Retaining only linear terms, we find that the scaled resting membrane potential  is proportional to v0 – γw0.
A value vi,j is sampled from the resting membrane potential distribution for each cell (i, j) in the network. The dependent parameters γ and w0 are then multiplied by vi,j to introduce variability into the model. Introducing variability through the parameter v0 produces non-sensical results.
Multiplying γ and w0 by vi,j alters the phase portrait for each cell. We therefore examine the effect of the variability in resting membrane potential (and so gestation period) on the minimum perturbation required to excite an isolated cell. Simulations were run with the only asymmetry being the variation in resting membrane potential, and also with an asymmetry in the cell capacitances. Relative cluster sizes were recorded for a range of coupling strengths and initial perturbations with varying connectivity p.
An increase in variability in resting membrane potential is seen as pregnancy progresses. Therefore, by assuming a linear relationship between day 15 and day 18 data, we extrapolate resting membrane potential variability for time points outside this range to examine the trend of excitability throughout pregnancy.
2.2.5.6. Pacemaker cells
Activity waves can be initiated by external stimuli (for example, oxytocin) or by intrinsic activity of spontaneously active cells. Such cells can be obtained by adjusting the parameters to shift the position of its null isoclines. The pacemaker cell parameter values are given in table 2. The straight line null isocline passes directly through the local minimum of the cubic null isocline to create an unstable fixed point at the rest state of the cell, as indicated in figure 1d. In effect, the cell continually re-excites itself. The cells are connected symmetrically with a constant coupling value.
Table 2.
Parameter values for pacemaker cells.
| parameter | A | α | γ | w0 | v0 | ε |
| value | 3 | 3 | 0.1 | 0.4 | 0.7 | 0.2 |
The models used in this study are summarized in table 3.
Table 3.
Summary of the models used.
| type of network | coupling | method of generation | key results |
|---|---|---|---|
| homogeneous lattice | symmetrical | fixed coupling κ | minimum and maximum coupling for each perturbation in which global excitation is possible |
| Bernoulli lattice | symmetrical | fixed coupling κ with varying probability p | even when global excitation cannot occur in the fully connected lattice, it can be attained in a partially connected system |
| uniformly distributed | symmetrical | couplings drawn from a uniform distribution on [0.5,10] with varying probability p | total coupling between neighbouring cells has a minimum and maximum threshold for global excitation. Between these values (and with constant total coupling), the ability to achieve global excitation is dependent on the standard deviation of coupling values |
| cell capacitance | asymmetrical | coupling κ = RC−1. C is drawn from distribution of cell capacitance taken from experimental data. R is fixed. Probability p is varied | the presence of spatial heterogeneity is essential for global excitation at comparable perturbation values to the Bernoulli lattice. A larger perturbation is needed for full excitation and full connectivity. There is no discernible difference between day 15 and day 18 gestation |
| resting membrane potential | symmetrical | fixed coupling κ. Each cell has its own parameters and so its own resting membrane potential | increase in gestational age results in a smaller excitation threshold for each cell to overcome. Systems with resting membrane potential variation only fail to achieve global excitation |
| cell capacitance and resting membrane potential combined | asymmetrical | each cell has its own resting membrane potential. C is drawn from distribution of cell capacitance. R is fixed | both forms of variation allow global excitation in heterogeneous systems. A larger perturbation is needed than in the Bernoulli lattice to achieve global excitation at full connectivity |
| pacemaker cells | symmetrical | central cell is a pacemaker. All other cells as before. Fixed coupling κ with varying probability p | highly connected systems have a greater probability of the pacemaker cell ceasing to be active. The frequency of oscillation of the pacemaker cell decreases with increasing connectivity. At high coupling strength values, connectivity has no effect on the frequency—the only way for a pacemaker to retain a finite frequency is to be isolated |
3. Results
To investigate how the spatial heterogeneity affects the global excitability of the network, the spatially homogeneous case is studied first, followed by the heterogeneous coupling case.
3.1. Fully connected square lattice
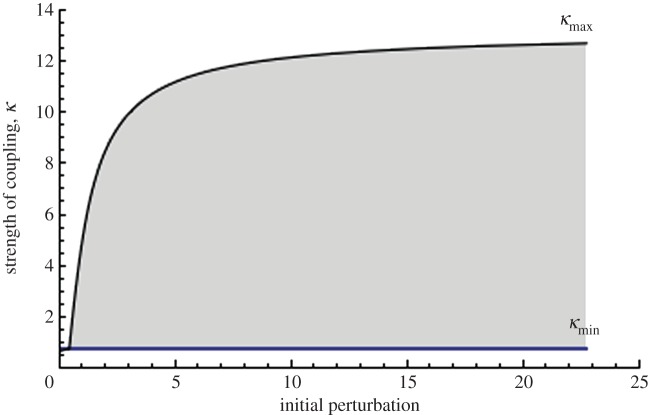
Simulations of a spatially homogeneous square lattice indicate that for each perturbation there is a window of coupling strengths in which global excitation of the lattice is possible. For instance, an initial perturbation of 1 in a fully connected lattice of size 25 × 25, produces global excitation for coupling strengths (κ) between 0.76 and 5.12. Below 0.76, the excitation does not spread beyond the cell to which the stimulus was applied. Above 5.12, no cell is able to become excited, including the perturbed cell. The surrounding cells act as a current sink; when the coupling is too strong, this effect prevents excitation. The symbols κmin and κmax denote the boundaries of the window of excitation; for the standard perturbation Δv = 1 these values are 0.76 and 5.12.
The ranges of perturbation and coupling values that permitted global excitation are shown in figure 3 for a 25 × 25 lattice. Simulations run for smaller and larger lattices produce qualitatively similar excitation curves.
Figure 3.
The range of parameters that allow global excitation (shaded region) in a 25 × 25 lattice. The strength of coupling and initial perturbation are non-dimensionalized. The horizontal line corresponds to κmin below which global excitation is impossible; κmax defines the maximum coupling value for each perturbation and corresponds to the curve bounding the shaded region from above. (Online version in colour.)
3.2. Symmetric coupling in the Bernoulli lattice
Simulations were run with a lattice of 25 × 25 cells and the coupling strengths were chosen in the range from 1 to 2.5 (i.e. within the window of global excitation for an initial perturbation of 1). Initial perturbations took the following values: 1, 1.5, 2 and 2.5. As the connectivity of the lattice (p) increases, the relative cluster size increases in a sigmoidal fashion, as shown in figure 4. The response curve does not substantially vary with lattice size, coupling value or initial perturbation (see figure 4 and electronic supplementary material, figure S2), which suggests that connectivity is the dominant factor governing the excitability of the system.
Figure 4.
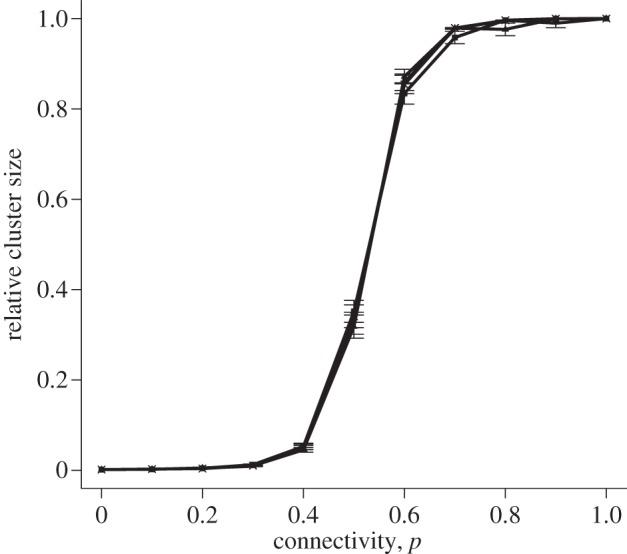
Relative cluster size versus connectivity for symmetrical coupling in the Bernoulli lattice. Points show mean ± s.e.m. of 100 simulations for a 25 × 25 lattice. In all simulations, a coupling strength of κ = 1 was chosen. The four lines represent initial perturbations of 1, 1.5, 2 and 2.5, shown in the same colour due to the proximity of the curves.
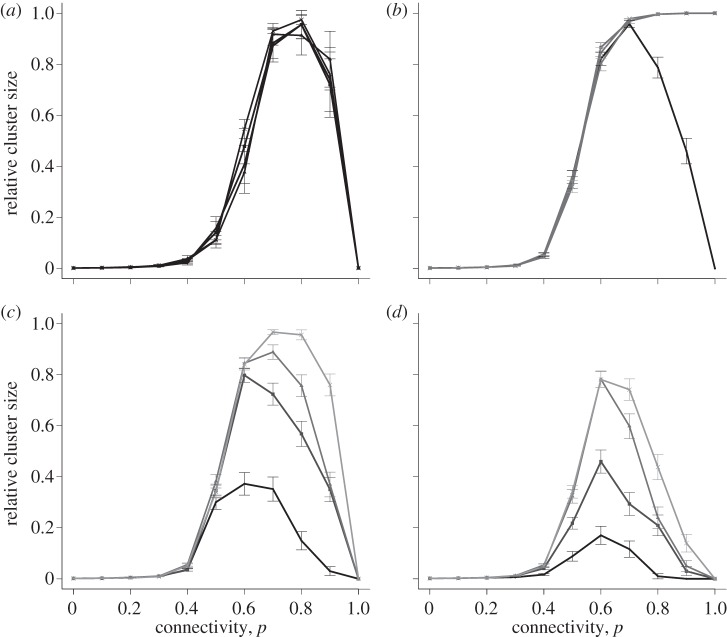
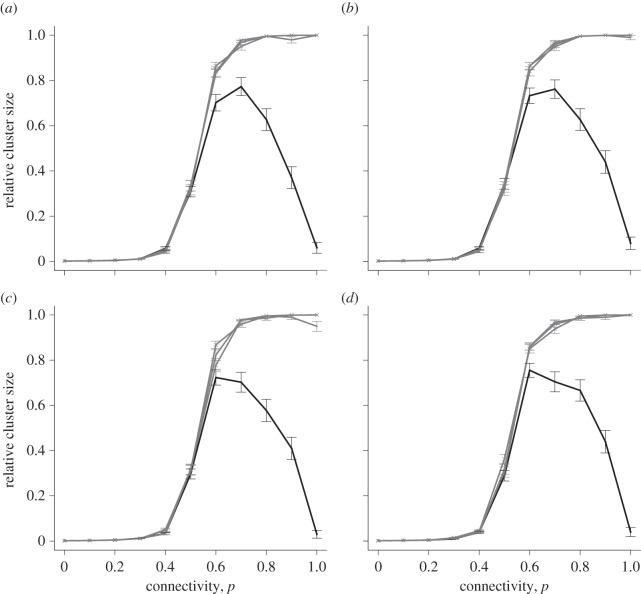
Coupling values were chosen from outside the window of global excitation, and the effect of spatial heterogeneity in coupling was investigated by varying lattice connectivity as before. The behaviour for coupling values greater than or equal to the maximum coupling value κmax is shown in figure 5b–d for initial perturbation Δv = 1. The behaviour for the minimum coupling value κmin is shown in figure 5a. In both the cases, the sigmoidal curve was replaced by a negatively skewed bell curve, indicating that even when global excitation is precluded in the fully connected lattice, it can be attained in a partially connected system. Connectivity attains an optimum in the range p = 0.6–0.8. At these probabilities, either more than 90 per cent of the cells or fewer than 10 per cent of cells become excited. The averaging of the cluster sizes over 100 replicates underlies the decline in cluster size seen in the bell-shaped curve. At p = 1, this all-or-nothing behaviour is absent. Lattice size had no effect on this result (see the electronic supplementary material, figure S3).
Figure 5.
Relative cluster size versus connectivity for κ values outside the window of excitability in the symmetrical Bernoulli lattice. Points show mean ± s.e.m. of 100 simulations for a lattice size of 25 × 25. (a) κmin = 0.76, the four lines represent initial perturbations of 1, 1.5, 2 and 2.5 and are shown in the same colour due to the proximity of the curves; (b) κmax = 5.2, the four lines represent initial perturbations of 1, 1.5, 2 and 2.5. The dark curve represents an initial perturbation of 1, perturbations of 1.5, 2 and 2.5 are shown in the same (lighter) colour due to the proximity of the curves; (c) κ = 10, the four lines represent initial perturbations of 1, 1.5, 2 and 2.5 on a graded scale from dark to light; (d) κ = 15, the four lines represent initial perturbations of 1, 1.5, 2 and 2.5 on a graded scale from dark to light.
3.3. Global transitions
Simulations around boundary points κmin and κmax were performed to elucidate the transition from quiescence to global excitation, at varying levels of connectivity, viz. p = 1, p = 0.7, p = 0.5 and p = 0.3. Initially, simulations were run at κmax with perturbations from 0.5 to 1.5 at probabilities of 1, 0.7, 0.5 and 0.3 (figure 6a). In the fully connected lattice (p = 1), no excitation occurs for Δv < 1, whereas global excitation is attained for Δv > 1. At reduced connectivity, the lattice exhibits global excitation even at perturbations Δv < 1. The reduced connectivity allows a more gradual increase in cluster size with increased stimulation. This effect was especially pronounced at p = 0.7, an almost exactly optimal level of connectivity.
Figure 6.
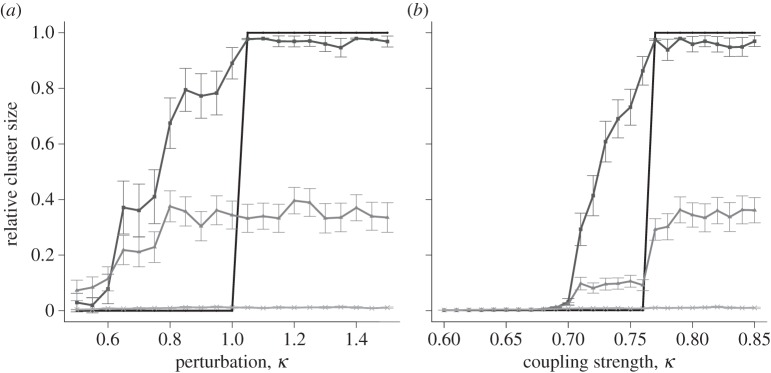
Relative cluster size versus small changes in parameters. Points show mean ± s.e.m. of 100 simulations, for a lattice size of 25 × 25. The four lines represent probabilities of connections between cells of 1, 0.7, 0.5 and 0.3 on a graded scale from dark to light. Anomalous cluster sizes are too few to affect the average. (a) Fixed coupling value κmax = 5.12 with varying perturbation; (b) fixed initial perturbation = 1.0 with varying coupling values around κmin = 0.76.
A similar phenomenon occurs near the lower bound (figure 6b). The fully connected lattice is unexcitable when the coupling is below κmin, whereas global excitation can occur at couplings above this value. At reduced levels of connectivity, coupling values below the lower bound are associated with activation clusters of increasing size. The strength of the perturbation, however, has little effect on the cluster size (see the electronic supplementary material, figure S4), indicating that connectivity per se is the dominant factor governing the transition to global excitability.
3.4. Uniformly distributed coupling strengths
The sum and standard deviation of the coupling strengths of the four cells surrounding the excited cell were examined for the fully connected lattice with couplings sampled from a uniform distribution between 0.5 and 10. For a combined coupling value over the four neighbouring cells (κT) less than 21.0, the cluster always exhibits global excitation, with every cell becoming excited. For κT greater than 22.2, the couplings around the perturbed cell do not allow any neighbouring cell to become excited. This points to a threshold for global excitation in a fully connected system with coupling sizes sampled from a uniform distribution. For κT between these two values, an increase in the standard deviation between the coupling strengths is correlated with a reduced global threshold for excitation (see the electronic supplementary material, table S2). The ability to achieve global excitation does not depend on the combined strength of the couplings to the neighbouring cells. The relationship between standard deviation and global excitation around the upper bound of coupling strengths (§3.1) for Δv = 1 is shown in table 4. The standard deviation has a more pronounced effect on the cluster size than κT. At constant κT, there is a standard deviation threshold beyond which the system cannot achieve global excitation.
Table 4.
The effect of standard deviation of coupling strengths on global excitation in a 25 × 25 square lattice, with an initial perturbation of 1.0. Full table shown in electronic supplementary material, table S3.
| horizontal κ | 5.2 | — | 6.6 | 6.7 | — | 9.7 | 9.8 | — | 10.4 |
| vertical κ | 5.2 | — | 3.8 | 3.7 | — | 0.7 | 0.6 | — | 0 |
| s.d. κ | 0 | — | 1.6166 | 1.7321 | — | 5.1962 | 5.3116 | — | 6.0044 |
| cluster size | 0 | — | 0 | 1 | — | 1 | 0.04 | — | 0.04 |
3.5. Uniformly distributed coupling strengths: Bernoulli lattice
The two sources of heterogeneity were combined to give a lattice with coupling values drawn from a mixed distribution with a finite probability at the value zero and a uniform distribution over non-zero values. The isotropic lattice was studied for various values of the initial perturbation (figure 7a). The negatively skewed bell-shaped curve was observed with a fixed coupling value for the smallest perturbation. Compared with the Bernoulli lattice, larger clusters are observed, at higher connectivity values. Again, the declining slope of the bell-shaped curve for a perturbation of 1 is associated with all-or-nothing behaviour. The transition from quiescence to global excitability as a function of p, at fixed Δv, is gradual, in contrast to the Bernoulli lattice (figure 7b).
Figure 7.
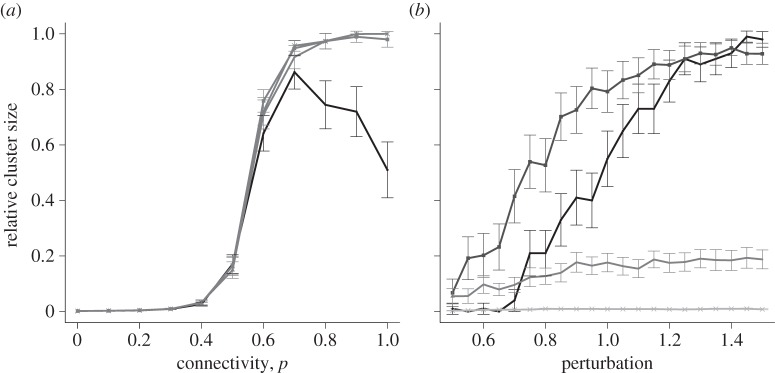
(a) Relative cluster size versus connectivity, for random coupling values. All points show mean ± s.e.m. of 100 simulations, for an isotropic lattice of size 25 × 25. The four lines represent initial perturbations of 1, 1.5, 2 and 2.5. A perturbation of 1 is shown in the darkest shade. Lighter colours represent perturbations of 1.5, 2 and 2.5 due to their close proximity. All κ ∈ [0.5,10]. (b) Relative cluster size versus perturbation, for an isotropic square lattice of size 25 × 25. All κ ∈ [0.5,10]. Points show mean ± s.e.m. of 100 simulations. The four lines represent probabilities of connections between cells of 1.0, 0.7, 0.5 and 0.3 on a graded scale from dark to light. Anomalous cluster sizes are too few to affect the average.
3.5.1. Role of spatial correlation in the coupling structure
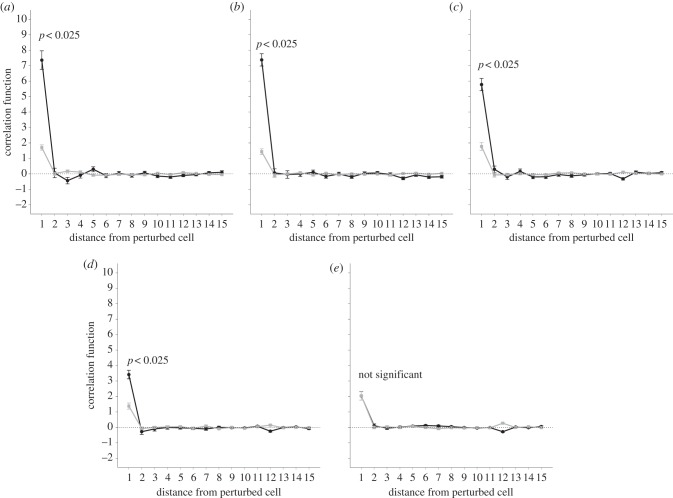
The spatial correlation function exhibits a striking difference between networks in which more than 90 per cent of the cells become excited, and those in which fewer than 10 per cent of the cells become excited. The latter are characterized by a strong correlation between the stimulated cell and the r = 1 neighbouring cells. The strong local coupling strengths act as a sink, preventing the current from dissipating throughout the network (as illustrated in electronic supplementary material, figure S5a where couplings are strong between the central cell and its r = 1 neighbours). In contrast, a low degree of spatial correlation between the stimulated cell and its r = 1 neighbour is associated with networks in which 90 per cent of cells become excited. An example of such a network is given in the electronic supplementary material, figure S5b. As the heterogeneity decreases from p = 0.6 to p = 0.9 (figure 8a–d) this effect becomes less pronounced. At a connectivity of p = 1, this difference in correlation is not observed (figure 8e).
Figure 8.
Correlation function versus increasing distance from the stimulated cell. Points show mean ± s.e.m. of 100 simulations. The darker lines correspond to networks with fewer than 10 per cent of cells becoming excited. The paler lines correspond to networks with more than 90 per cent of cells becoming excited. The initial perturbation is kept constant at 1. Each graph represents a different probability of connections existing between any two given cells. (a) Probability = 0.6, (b) probability = 0.7, (c) probability = 0.8, (d) probability = 0.9, (e) probability = 1.
3.6. Asymmetrical coupling: cell capacitance
The couplings between cells can be adjusted to represent differences in cell size as explained in §2.2.5. Realistic distributions were derived from data obtained in 15-day pregnant and 18-day pregnant mice, shown in electronic supplementary material, figure S6. Figure 9 shows a model with scaled ε values, a constant gap junctional resistance and lognormally distributed capacitance values. At perturbations of 1.5, 2.0 and 2.5, a sigmoidal curve is observed, with an increased probability of cell-to-cell coupling corresponding to a larger cluster size. For Δv = 1, a bell-shaped curve is observed, with slightly reduced connectivity resulting in a larger relative cluster size. The graph shown is for the day-18 simulations. There was no discernible difference between day-15 and day-18 simulations. It appears that this variation between gestation days is not sufficient to remove the cells from the excitable range displayed in figure 3. In contrast to the symmetrically coupled case discussed earlier (figure 4), the curve is not sigmoidal for an initial perturbation of 1, suggesting that an asymmetrically coupled system requires a larger initial perturbation before full excitation can be achieved at full connectivity.
Figure 9.
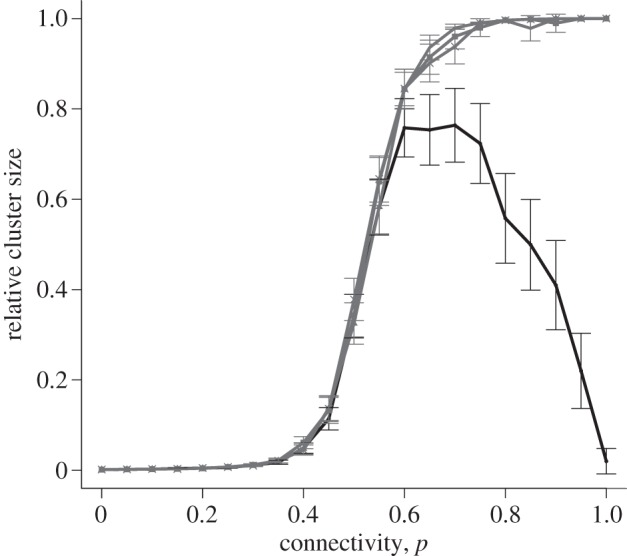
Relative cluster size versus connectivity, for a selection of initial perturbations. All points show mean ± s.e.m. of 100 simulations, for an asymmetrically coupled lattice of size 25 × 25. The four lines represent initial perturbations of 1, 1.5, 2 and 2.5. Perturbations of 1 are shown in the darkest shade, and the remaining perturbations are shown lighter due to their close proximity. Capacitance values are sampled from 18-day distribution. There is no discernible difference in the model using capacitance values sampled from 15-day distribution.
3.7. Variation in resting membrane potential
If the resting membrane potential is allowed to vary between cells, the pattern of spatial heterogeneity enhancing excitability persists. Figure 10a indicates the value of Δv required to excite the cell for a given resting membrane potential mean and standard deviation. The means and standard deviations for other gestation days were determined by interpolation and extrapolation, assuming a linear relationship between the 15-day and 18-day data. With the change in resting membrane potential, the cells' phase portraits change over time, resulting in a smaller Δv-value required for excitation of an individual cell as the system approaches parturition.
Figure 10.
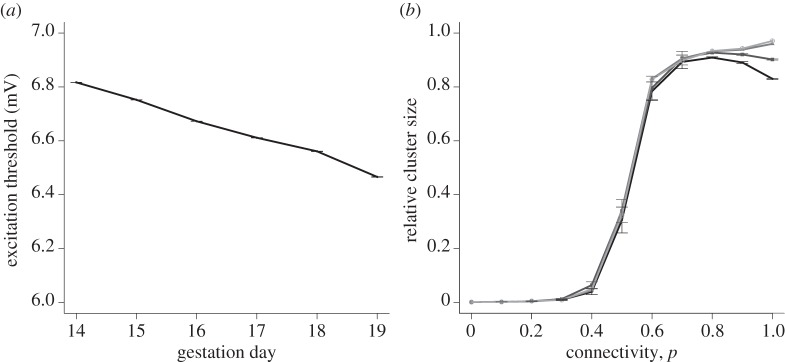
(a) Excitation threshold a cell needs to overcome versus the gestation day. The points from day 15 and day 18 gestations are determined by experimental data. Other points are generated by interpolation and extrapolation based on a linear relationship between day 15 and day 18 data. All points show mean ± s.e.m. of 100 simulations. (b) Relative cluster size versus connectivity, for an initial perturbation of 1. All points show mean ± s.e.m. of 100 simulations, for a lattice size of 25 × 25. There is no asymmetry due to cell capacitance variation: κ = 1. Lines represent simulations incorporating pre-day 15 variation, day 15 variation, day 18 variation and post-day 18 variation on a graded scale from dark to light.
Figure 10b illustrates the relationship between relative cluster size and connectivity for systems with pre-day 15, day 15, day 18 and post-day 18 resting membrane potential variation. We see that a system with resting membrane potential variation only, at a constant coupling strength (κ = 1), fails to achieve full excitation. However, increased gestational age correlates with increased excitability.
Figure 11 displays the results of variation in resting membrane potential and cell capacitance, for all four gestation time point combinations. Capacitance variation endows some cells with a greater ability to excite the network, since larger cells can accommodate the current sink effect exerted by its neighbours and act as a buffer, enabling all cells to become excited. It appears that excitability is optimal with larger perturbations in the case combining capacitance and resting membrane potential variability sampled from the 18-day distribution. In contrast to the symmetrically coupled case (figure 4), an asymmetrically coupled system requires a larger initial perturbation before full excitation can be achieved at full excitability.
Figure 11.
Relative cluster size versus connectivity, for a selection of initial perturbations. All points show mean ± s.e.m. of 100 simulations, for a lattice size of 25 × 25. The four lines represent initial perturbations of 1, 1.5, 2 and 2.5 on a graded scale from dark to light. Perturbations of 1.5, 2 and 2.5 are shown in the same shade due to their close proximity. (a) Resting membrane potentials and capacitances sampled from day 15 distribution; (b) resting membrane potentials sampled from day 15 distribution, cell capacitances sampled from day 18 distribution; (c) resting membrane potentials sampled from day 18 distribution, cell capacitances sampled from day 15 distribution and (d) resting membrane potentials and capacitances sampled from day 18 distribution.
3.8. Pacemaker cells
In networks with a pacemaker cell, the frequency of oscillations of the pacemaker is affected by connectivity. The current sink represented by neighbouring cells can reduce the frequency of the pacemaker cell's free-running oscillation or even cause the cell to cease cycling altogether. The probability of such a complete cessation of cycling increases with connectivity (figure 12a). With the exception of very small coupling values κ, at full connectivity the pacemaker cell is not able to maintain its excitability and subsequently none of the surrounding cells are able to become excited. At small values of κ, the pacemaker maintains its excitability and pacemaker frequency is hardly affected by increased probability of connection. Heterogeneity of the spatial coupling structure thus appears to be an important modulator of excitability.
Figure 12.
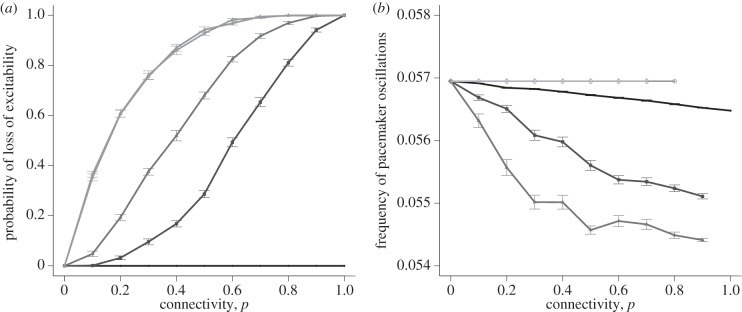
(a) Probability that the pacemaker cell becomes inactivated versus connectivity, for a selection of coupling strengths. All points show the number of times excitation was not maintained in 50 simulations as mean ± s.e.m. of 15 repetitions. Lattice size is 25 × 25. Lines represent coupling strengths of 0.1, 0.5, 1, 5 and 10 on a graded scale from dark to light. Coupling strengths of 5 and 10 are shown in the same shade due to their close proximity. (b) Frequency of oscillations of the pacemaker cell versus connectivity, for a selection of coupling strengths. All points show mean ± s.e.m. of 100 simulations where excitability of the pacemaker cell was maintained, for a lattice size of 25 × 25. Lines represent coupling strengths of 0.1, 0.5, 1, 5 and 10 on a graded scale from dark to light. The gaps in the individual lines illustrate where the pacemaker cannot maintain excitability.
The relationship between connectivity and the frequency of oscillations of the pacemaker cell is shown in figure 12b, calculated as an average of simulations in which the pacemaker continues to cycle at a finite frequency. As the connectivity p increases from 0 to 1, the frequency of oscillations of the pacemaker cell decreases, owing to the drain of current to the surrounding connections. At high coupling strength values of κ = 5 and κ = 10, connectivity has no effect on frequency since the only way for a pacemaker to retain a finite frequency at these coupling strengths is to be essentially isolated in the network. This is illustrated in electronic supplementary material, figure S7 that shows the topology of a sample pacemaker network with finite frequency, and the topology of a sample network where the pacemaker's frequency decays.
The key results presented in this paper are summarized in table 3.
4. Discussion
It is well known that an increase in the number of gap junctions in myometrial tissue is indicative of the onset of labour [1]. While the number of connections increases, little is known about the strength and local structure of these connections. The main finding of this study is that heterogeneity of the coupling structure of a network of excitable elements allows the system to respond in a graded manner to a wide range of stimuli. For instance, reduced connectivity results in a gradual increase in cluster size in response to stimulation, resulting in a smooth transition between an unexcited and globally excited state, which enhances the scope for precise regulation. Physiological evidence suggests that the transition from quiescence to excitation is gradual [16]; this may be explained in part by the results presented here.
Relatively little is known about the effect of heterogeneity in myocyte connections on the excitability of the network as pregnancy progresses. Our analysis of the pregnant mouse data confirms the importance of heterogeneity and demonstrates that the network evolves towards global excitability as labour approaches.
A homogeneous lattice (fully connected with identical couplings) cannot achieve global excitation when the coupling is too strong: neighbouring cells can too readily absorb the membrane charge associated with the stimulus. When heterogeneity is introduced, whether by removing selected couplings at random or by varying the coupling values at random, the ability to achieve global excitation is restored. An intuitive explanation is that heterogeneity creates local ‘pockets’ of excitability where the initially stimulated cell is less hampered by the charge drain imposed by its neighbours. Moreover, heterogeneity smoothes out the sudden transition between an unexcited network and a globally excited one (§3.3). This is consistent with the finding that in the days and hours leading up to labour, contractions spread further throughout the uterus [29]. Finally, spatial heterogeneity regulates the ability of pacemaker cells to drive the network, again in a graded fashion.
Simulations on a fully connected square lattice (§3.1) indicate that there exist minimum and maximum coupling values between which global excitation of the network is possible. These thresholds were found to be dependent on the initial perturbation. Whereas the homogeneous lattice cannot exhibit global excitation, the heterogeneous lattice formed by removing couplings is able to exhibit excitation. In the heterogeneous system, the wave of excitation generated by the central cell has to overcome a lower threshold to excite neighbouring cells. Therefore, the system can achieve global excitation even with a smaller inciting stimulus.
Investigation of the variability of the couplings surrounding the excited cell in a lattice with couplings drawn from a uniform distribution indicates that global excitation is affected by the variance of the coupling strengths to neighbouring cells and is not solely dependent upon total coupling. The effect of coupling variance displayed a lower and upper threshold for global excitation of the network. Therefore, a variance within these bounds is optimal for network excitation. Outside this region, excitability does not spread across the whole network. It appears that when the variance of connections is too high, a fragmented network results, which does not allow for propagation of excitability. Overall, it appears that variation of coupling allows for a larger cluster size at high connectivity. This result was supported by similar simulations run for an anisotropic lattice (see the electronic supplementary material, table S2), where the horizontal and vertical coupling strengths were drawn from distinct uniform distributions.
The importance of heterogeneity was demonstrated by the correlation between cells at increasing distance from the central cell, and the central cell itself. At full connectivity, there was no discernible difference in correlation. For networks with a lower probability of connection, a much larger correlation was observed in networks with fewer than 10 per cent of cells becoming excited when compared with networks with more than 90 per cent of cells becoming excited. This effect was more pronounced in lower connectivities, reaffirming the importance of heterogeneity. This supports the notion of excitation pockets, where a cluster of cells that are too well-connected act as a current sink and prevent the excitation from spreading further through the network. The main determinant of global excitation is the local spatial correlation around the excited cell.
Data for resting membrane potential in mice at 15-day and 18-day gestational age indicate an increase in depolarization of the cell membrane with increased gestation length, confirming the findings of Lodge & Sproat [13]. The statistical variation in resting membrane potential among cells also increases with gestational age. With resting membrane potential as the only form of variability in the model, full excitation could not be reached. However, when the resting membrane potential's variability is combined with capacitance variation, the optimum excitability at intermediate connectivity is restored.
Results were consistent over a range of lattice sizes; from 9 × 9 to 25 × 25. Larger lattices were not investigated due to computational restrictions. Simulations were also run for hexagonal lattices to investigate effects of network structure on excitability. Similar qualitative results were obtained. However, the hexagonal lattice displayed a wider window of global excitability when compared with a square lattice with the same number of nodes. An increase in spatial heterogeneity enables the system to achieve global excitation more easily. Networks with stochastically varying node degrees will be investigated in future research.
The resting membrane potential values were taken from recordings of isolated myometrial cells. However, a system of connected cells settles into a different resting states. To verify that the experimental data were representative of networked cells, simulations were run in which the cells where allowed to equilibrate, and differences were found to be negligible.
Preliminary observational data (shown in the electronic supplementary material, section 10.1 and figure S8) suggest that an increase in heterogeneity increases the frequency of the oscillations of the pacemaker. This was confirmed by our simulations in which the pacemaker cell's ability to drive the system is modulated by connectivity. With increased heterogeneity, the drain of current to surrounding cells has a smaller effect, causing the frequency of oscillations to increase. In addition, a well-connected system makes it more probable that the pacemaker is not able to remain active, and its oscillations stop altogether. Maximal excitability is associated with a moderate degree of spatial heterogeneity. This would suggest that a way in which a cell can develop pacemaker activity is to downregulate its gap junctions to partially isolate itself in the network. The suggestion of cell isolation is supported by preliminary experimental data (not shown) in which individual cells can oscillate but still participate in a global action potential.
Propagation waves in excitable media have been examined extensively using cellular automata [30–34]. This approach was then extended to show how the cellular automata models could be matched to systems such as the FitzHugh–Nagumo set of equations [35,36]. A cellular automata model also exists that describes the uterine network using Hodgkin–Huxley physiology [37]. Here, we have opted to use the FitzHugh–Nagumo model to represent the excitation and recovery of a myometrial cell. Since the primary aim of the present study was to explore the consequences of spatial heterogeneity per se, we have used a two-dimensional minimal model to represent the excitable element without being too computationally expensive. This FitzHugh–Nagumo model captures the qualitative dynamics of propagation through excitable systems. It does, however, still have its limitations. The model considers only one activation variable and one recovery variable. The minimal model can be replaced by models that take into account individual currents and the intracellular calcium stores [38–40]. Future work will focus on these more detailed models to more accurately represent the calcium influx resulting in a contraction. In addition, a three-dimensional system will be considered to model the uterine network more closely.
Miyoshi et al. [41] demonstrated that gap junctional conductance between coupled cells is dependent on the trans-junctional voltage, which adds a nonlinear effect that may play an important role in the transition from the globally quiescent state to the globally excitable state. This effect has not been taken into account in this study and will be the subject of future research.
In summary, the mathematical model used here indicates that spatial heterogeneity may serve as an important modulator of excitability in uterine muscle. Spatial heterogeneity of cell-to-cell connections promotes an increase in the excitability of the network, and the ability of a network to become fully excited is governed predominantly by the local connection structure. In addition, heterogeneity in both cell capacitance and resting membrane potential also plays a role. Similarly, heterogeneity allows a pacemaker cell to drive the system.
Shifts in this heterogeneity may be a significant factor in the regulation of myometrial excitability as pregnancy progresses from conception to parturition. Pre-term labour may be associated with a premature development of spatial heterogeneity. Mapping of spatial heterogeneity may prove to be a diagnostic tool to monitor the development of excitability throughout pregnancy.
Acknowledgements
R.E.S. gratefully acknowledges funding for a studentship from the Engineering and Physical Sciences Research Council through the MOAC Doctoral Training Centre at the University of Warwick.
Appendix A
We follow the derivation provided by Keener & Sneyd [28]. Consider the circuit given in figure 2d showing a simplified model of the cell membrane. From Kirchoff's laws, one obtains
| A1 |
and
| A2 |
where I0 is the applied external current, i is the current through the resistor–inductor, V = Vi – Ve is the membrane potential, R is the resistance and V0 is the potential gain across the battery, which forms part of the excitable element representing the recovery current in figure 2d. D is the damping coefficient, which captures the inertia of the system induced by the gating kinetics, as shown by FitzHugh in 1961 [21]. R and D are incorporated into the ‘excitable element’. Here, τ represents dimensional time. The function F(V) is a cubic with three zeros: the smallest V = 0 and largest V = V1 are stable solutions of dV/dτ = –F(V). The passive resistance of the nonlinear element (defined as a tunnel diode by Nagumo [22]) is R1 = 1/F′(0).
The equations are rendered dimensionless as follows. Define v = V/V1, w = R1i/V1, f(v) = –R1F(V1v)/V1 and t = R1τ/L. Equations (A 1, A 2) can then be rewritten as follows:
| A3 |
and
| A4 |
where  , w0 = R1I0/V1, v0 = V0/V1 and γ = R/R1. The function f(v) is a cubic and can be written as follows:
| A5 |
References
- 1.Garfield RE, Sims S, Daniel EE. 1977. Gap junctions: their presence and necessity in myometrium during parturition. Science 198, 958–960. ( 10.1126/science.929182) [DOI] [PubMed] [Google Scholar]
- 2.Parkington HC, Tonta MA, Davies NK, Brennecke SP, Coleman HA. 1999. Hyperpolarization and slowing of the rate of contraction in human uterus in pregnancy by prostaglandins E2 and F2α: involvement of the Na+ pump. J. Physiol. 514, 229–243. ( 10.1111/j.1469-7793.1999.229af.x) [DOI] [PMC free article] [PubMed] [Google Scholar]
- 3.Blanks AM, Zhao Z-H, Shmygol A, Bru-Mercier G, Astle S, Thornton S. 2007. Characterization of the molecular and electrophysiological properties of the T-type calcium channel in human myometrium. J. Physiol. 581, 915–926. ( 10.1113/jphysiol.2007.132126) [DOI] [PMC free article] [PubMed] [Google Scholar]
- 4.Brody JR, Cunha GR. 1989. Histologic, morphometric, and immunocytochemical analysis of myometrial development in rats and mice: II. Effects of DES on development. Am. J. Anat. 186, 21–42. ( 10.1002/aja.1001860103) [DOI] [PubMed] [Google Scholar]
- 5.Weiss S, Jaermann T, Schmid P, Staempfli P, Boesiger P, Niederer P, Caduff R, Bajka M. 2006. Three-dimensional fiber architecture of the nonpregnant human uterus determined ex vivo using magnetic resonance diffusion tensor imaging. Anat. Rec. A Discov. Mol. Cell Evol. Biol. 288, 84–90. ( 10.1002/ar.a.20274) [DOI] [PubMed] [Google Scholar]
- 6.Challis JRG, Matthews SG, Gibb W, Lye SJ. 2000. Endocrine and paracrine regulation of birth at term and preterm. Endocr. Rev. 21, 514–550. ( 10.1210/er.21.5.514) [DOI] [PubMed] [Google Scholar]
- 7.Parkington HC, Tonta MA, Brennecke SP, Coleman HA. 1999. Contractile activity, membrane potential, and cytoplasmic calcium in human uterine smooth muscle in the third trimester of pregnancy and during labor. Am. J. Obstet. Gynecol. 181, 1445–1451. ( 10.1016/S0002-9378(99)70390-X) [DOI] [PubMed] [Google Scholar]
- 8.Duquette RA, Shmygol A, Vaillant C, Mobasheri A, Pope M, Burdyga T, Wray S. 2005. Vimentin-positive, c-kit-negative interstitial cells in human and rat uterus: a role in pacemaking? Biol. Reprod. 72, 276–283. ( 10.1095/?biolreprod.104.033506) [DOI] [PubMed] [Google Scholar]
- 9.Wolfs G, Rottinghuis H. 1970. Electrical and mechanical activity of the human uterus during labour. Archiv. Gynäkol. 208, 373–385. ( 10.1007/BF00668252) [DOI] [PubMed] [Google Scholar]
- 10.Kao CY. 1959. Long-term observations of spontaneous electrical activity of the uterine smooth muscle. Am. J. Physiol. 196, 343–350. [DOI] [PubMed] [Google Scholar]
- 11.Marshall JM, Kroeger EA. 1973. Adrenergic influences on uterine smooth muscle. Phil. Trans. R. Soc. Lond. B 265, 135–148. ( 10.1098/rstb.1973.0016) [DOI] [PubMed] [Google Scholar]
- 12.Wray S, Kupittayanant S, Shmygol A, Smith RD, Burdyga T. 2001. The physiological basis of uterine contractility: a short review. Exp. Physiol. 86, 239–246. ( 10.1113/eph8602114) [DOI] [PubMed] [Google Scholar]
- 13.Lodge S, Sproat JE. 1981. Resting membrane potentials of pacemaker and non pacemaker areas in rat uterus. Life Sci. 28, 2251–2256. ( 10.1016/0024-3205(81)90577-4) [DOI] [PubMed] [Google Scholar]
- 14.Hodgkin AL, Huxley AF. 1952. A quantitative description of membrane current and its application to conduction and excitation in nerve. J. Physiol. 177, 500–544. [DOI] [PMC free article] [PubMed] [Google Scholar]
- 15.Kumar NM, Gilula NB. 1996. The gap junction communication channel. Cell 84, 381–388. ( 10.1016/S0092-8674(00)81282-9) [DOI] [PubMed] [Google Scholar]
- 16.Garfield RE, Maner WL. 2007. Physiology and electrical activity of uterine contractions. Semin. Cell Dev. Biol. 18, 289–295. ( 10.1016/j.semcdb.2007.05.004) [DOI] [PMC free article] [PubMed] [Google Scholar]
- 17.Steinberg BE, Glass L, Shrier A, Bub G. 2006. The role of heterogeneities and intercellular coupling in wave propagation in cardiac tissue. Phil. Trans. R. Soc. A 364, 1299–1311. ( 10.1098/rsta.2006.1771) [DOI] [PubMed] [Google Scholar]
- 18.Barkley D. 1991. A model for fast computer simulation of waves in excitable media. Physica D 49, 61–70. ( 10.1016/0167-2789(91)90194-E) [DOI] [Google Scholar]
- 19.Bub G, Shrier A, Glass L. 2002. Spiral wave generation in heterogeneous excitable media. Phys. Rev. Lett. 88, 058101 ( 10.1103/PhysRevLett.88.058101) [DOI] [PubMed] [Google Scholar]
- 20.Benson AP, Clayton RH, Holden AV, Kharche S, Tong WC. 2006. Endogenous driving and synchronization in cardiac and uterine virtual tissues: bifurcations and local coupling. Phil. Trans. R. Soc. A 364, 1313–1327. ( 10.1098/rsta.2006.1772) [DOI] [PubMed] [Google Scholar]
- 21.FitzHugh R. 1961. Impulses and physiological states in theoretical models of nerve membrane. Biophys. J. 1, 445–466. ( 10.1016/S0006-3495(61)86902-6) [DOI] [PMC free article] [PubMed] [Google Scholar]
- 22.Nagumo J, Arimoto S, Yoshizawa S. 1962. An active pulse transmission line simulating nerve axon. Proc. IRE 50, 2061–2070. ( 10.1109/JRPROC.1962.288235) [DOI] [Google Scholar]
- 23.Rae J, Cooper K, Gates P. 1991. Low access resistance perforated patch recordings using amphotericin B. J. Neurosci. Methods 37, 15–26. ( 10.1016/0165-0270(91)90017-T) [DOI] [PubMed] [Google Scholar]
- 24.Hodgkin AL, Huxley AF, Katz B. 1952. Measurement of current–voltage relations in the membrane of the giant axon of Loligo. J. Physiol. 116, 442–448. [DOI] [PMC free article] [PubMed] [Google Scholar]
- 25.Hodgkin AL, Huxley AF. 1952. Currents carried by sodium and potassium ions through the membrane of the giant axon of Loligo. J. Physiol. 116, 449–472. [DOI] [PMC free article] [PubMed] [Google Scholar]
- 26.Hodgkin AL, Huxley AF. 1952. The components of membrane conductance in the giant axon of Loligo. J. Physiol. 116, 473–496. [DOI] [PMC free article] [PubMed] [Google Scholar]
- 27.Hodgkin AL, Huxley AF. 1952. The dual effect of membrane potential on sodium conductance in the giant axon of Loligo. J. Physiol. 116, 497–506. [DOI] [PMC free article] [PubMed] [Google Scholar]
- 28.Keener J, Sneyd J. 1998. Excitability. In Mathematical physiology (eds Marsden JE, Sirovich L, Wiggins S.), pp. 116–159. New York, NY: Springer. [Google Scholar]
- 29.Miller SM, Garfield RE, Daniel EE. 1989. Improved propagation in myometrium associated with gap junctions during parturition. Am. Physiol. Soc. 256, C130–C141. [DOI] [PubMed] [Google Scholar]
- 30.Markus M, Hess B. 1990. Isotropic cellular automaton for modeling excitable media. Nature 347, 56–58. ( 10.1038/347056a0) [DOI] [Google Scholar]
- 31.Gerhardt M, Schuster H, Tyson J. 1990. A cellular automaton model of excitable media including curvature and dispersion. Science 247, 1563–1566. ( 10.1126/science.2321017) [DOI] [PubMed] [Google Scholar]
- 32.Gerhardt M, Schuster H, Tyson J. 1990. A cellular automaton model of excitable media. 2. Curvature, dispersion, rotation waves and meandering waves. Physica D 46, 392–415. ( 10.1016/0167-2789(90)90101-T) [DOI] [Google Scholar]
- 33.Gerhardt M, Schuster H, Tyson J. 1990. A cellular automaton model of excitable media. III. Fitting the Belousov–Zhabotinskii reaction. Physica D 46, 416–426. ( 10.1016/0167-2789(90)90102-U) [DOI] [Google Scholar]
- 34.Gerhardt M, Schuster H, Tyson J. 1991. A cellular automaton model of excitable media. IV. Untwisted scroll rings. Physica D 50, 189–206. ( 10.1016/0167-2789(91)90175-9) [DOI] [Google Scholar]
- 35.Weimar J, Tyson J, Watson L. 1992. Diffusion and wave-propagation in cellular automaton models of excitable media. Physica D 55, 309–327. ( 10.1016/0167-2789(92)90062-R) [DOI] [Google Scholar]
- 36.Weimar J, Tyson J, Watson L. 1992. Third generation cellular automaton for modeling excitable media. Physica D 55, 328–339. ( 10.1016/0167-2789(92)90063-S) [DOI] [Google Scholar]
- 37.Barclay M, Andersen H, Simon C. 2010. Emergent behaviours in a deterministic model of the human uterus. Reprod. Sci. 17, 948–954. ( 10.1177/1933719110376544) [DOI] [PubMed] [Google Scholar]
- 38.Rihana S, Terrien J, Germain G, Marque C. 2008. Mathematical modeling of electrical activity of uterine muscle cells. Med. Biol. Eng. Comput. 47, 665–675. ( 10.1007/s11517-009-0433-4) [DOI] [PubMed] [Google Scholar]
- 39.Laforet J, Rabotti C, Terrien J, Mischi M, Marque C. 2011. Toward a multiscale model of the uterine electrical activity. IEEE Trans. Biomed. Eng. 58, 3487–3490. ( 10.1109/TBME.2011.2167970) [DOI] [PubMed] [Google Scholar]
- 40.La Rosa PS, Eswaran H, Preissl H, Nehorai A. 2012. Multiscale forward electromagnetic model of uterine contractions during pregnancy. BMC Med. Phys. 12, 1–16. ( 10.1186/1756-6649-12-4) [DOI] [PMC free article] [PubMed] [Google Scholar]
- 41.Miyoshi H, Boyle MB, MacKay LB, Garfield RE. 1996. Voltage-clamp studies of gap junctions between uterine muscle cells during term and preterm labour. Biophys. J. 71, 1324–1334. ( 10.1016/S0006-3495(96)79332-3) [DOI] [PMC free article] [PubMed] [Google Scholar]


