

Abstract
Colors from natural sources are gaining popularity because synthetic colors are carcinogenic. Natural colors are obtained from plants or microorganisms. Pigments produced by microorganisms have advantages over plant pigments, due to their ease of use and reliability. In the present study, a blue pigment producing actinomycete klmp33 was isolated from the Gulbarga region in India. The isolate was identified based on morphologic, microscopic, and biochemical characterization, and 16S rRNA sequencing. Phylogenetic analysis of the isolates showed a close relationship with Streptomyces coelicolor. Pigment produced by the isolate was analyzed using UV–visible spectroscopy, thin-layer chromatography, Fourier transform infrared and liquid chromatography/mass spectroscopy analysis, and was identified as γ actinorhodin. γ-Actinorhodin is used as a pH indicator which deviates from acid to non-acid. Moreover, it subrogates synthetic dye.
Keywords: Streptomyces coelicolor, Blue pigment, γ Actinorhodin, pH indicator, Synthetic color
1. Introduction
Color affects every bit of life, strongly influencing the clothes we wear, the furnishing in homes and the allure of foods (Downham and Collins, 2000). Colors are divided into two categories, synthetic and natural. Synthetic colors have been comprehensively employed in the textile, paper, cosmetic, pharmaceutical and food industries for many years for their cost effectiveness in synthesis, but most of the synthetic dyes are toxic, some are potentially carcinogenic (Zhang et al., 2006, Mazmanci and Unyayar, 2005) and many of them exhibit immense impact on the environment due to their long stability, as most of them are released into natural reservoirs untreated, which influence the natural flora and fauna (Dhanve et al., 2009). To counteract the deleterious effect of synthetic colors, there is a significant concern in process development for the production of pigment and colors from natural sources all around the world (Unagul et al., 2005, Gupta et al., 2011).
The main sources of natural pigments are plants and microorganisms (Chattopadhyay et al., 2008). The use of plant pigments has many drawbacks like non-availability throughout the year, pigment stability, solubility and moreover, large scale usage of plant as a source of pigment may lead to loss of valuable species, and thus the process is not economically viable (Raisainen et al., 2002). The next crucial producers of pigment are the microorganisms. They have an enormous advantage over plant pigments, which include easy and rapid growth in low cost medium, stability, easy processing and independent of weather conditions (Venil and Lakshmanaperumalsamy, 2009). The pigment production is more widely present in actinomycetes than compared with other bacterial groups (Marroquin and Zapata, 1954). Among actinomycetes Streptomyces coelicolor is well known to produce blue pigment actinorhodin (Bentley et al., 2002). Actinorhodin is an antibiotic that acts against Gram positive bacteria such as Staphylococcus aureus at a relatively high concentration but has no effect on Gram negative bacteria such as Escherichia coli (Zhang et al., 2006). During our study, the isolate did not show antifungal activity against Aspergillus flavus MTCC 277 and Aspergillus niger MTCC 281 so, we used actinorhodin as a pH indicator to detect acid production. The pigment appears blue in alkali and red in acid pH (Abbas and Edwards, 1990). The pH indicating property is mainly due to the unique structure with two naphthazarin rings connected by a direct c–c bond (Itoh et al., 2007).
This communication deals with the extraction characterization of the blue pigment produced by S. coelicolor klmp33 as a pH indicator.
2. Materials and methods
2.1. Media
The ingredients of the starch casein agar medium (SCA) were procured from Hi-media Mumbai, India. The composition of the medium was as follows (g L−1): starch 10; K2HPO4 2; KNO3 2; NaCl 2; MgSO4·7H2O 0.05; CaCO3 0.02; FeSO4·7H2O 0.01; casein 0.3; agar 15; pH 7.5.
2.2. Isolation and identification of actinomycetes
Soil samples from different areas of Gulbarga, Karnataka; India were collected and screened for pigment producing actinomycetes by serial dilution method using SCA medium and incubated at 27 °C for seven days. On the basis of the pigment production, the isolate klmp33 was selected and maintained on fresh SCA medium, checked for its purity and stored at 4 °C for further work. The morphological, microscopic and biochemical characteristics were examined according to the methods described by Shirling and Gottlieb, 1966, Williams and Sharpe, 1989.
2.2.1. 16S rRNA sequencing
The 16S rRNA sequencing of isolate klmp33 was performed at Ocimum Biosolution Pvt. Ltd. Hyderabad, India using Applied Bio systems 3730 × l DNA Analyzer. The analysis of nucleotide sequence was done at Blast-n site at NCBI server (http://www.ncbi.nlm.nih.gov/BLAST). The alignment of the sequences was done using CLUSTALW V1.82 at European Bioinformatics site (http://www.ebi.ac.uk/clustalw). The sequence was refined manually after cross checking with the raw data to remove ambiguities and submitted to the Gene Bank (Accession No. JQ27722). Phylogenetic tree was constructed using the aligned sequences by the neighbor joining method using Kimura-2-parameter distances in MEGA 5 software (Tamura et al., 2011).
2.3. Condition necessary for the production of γ actinorhodin
S. coelicolor produces metabolites like actinorhodin and its analogs which are blue in color which makes them difficult to identify, however pH plays a crucial role in their identification. For the production of γ actinorhodin pH of the medium kept neutral, at this condition γ actinorhodin produced both intracellular and extracellular. The pigment produced, was extracted and purified according to Bystrykh et al. (1996).
2.4. Pigment analysis
2.4.1. Pigment solubility
The pigment solubility was performed in various solvents like chloroform, methanol and dioxane taken in equal proportion.
2.4.2. UV–visible spectroscopy
The pigment produced by isolate klmp33 was treated with equal volume of 1 M sodium hydroxide and was centrifuged at 1100g for 5 min, the resultant supernatant was collected and monitored using UV–visible spectroscopy (double-beam UV–visible spectrophotometer 2200), at 638 nm (Coisne et al., 1999).
2.4.3. Thin layer chromatography (TLC)
The purified pigment was assayed by TLC conducted on silica-gel 60 F254 plates (Merck) with benzene-acetic acid (9:1; v/v) as solvent (Bystrykh et al., 1996).
2.4.4. Fourier transform infrared spectroscopy (FTIR)
The main goal of FTIR spectroscopic analysis is to determine chemical functional groups present in the sample. Different functional groups absorb characteristic frequencies of IR radiation. Thus, FTIR spectroscopy becomes an important tool for compound identification. The FTIR spectra were recorded on NICOLET iS5 with Diamond ATR. The FTIR peak of the pigment was determined and expressed in wave numbers (cm−1).
2.4.5. Liquid chromatography–mass spectroscopy (LC/MS)
LC/MS technique was performed to know the mass spectrum of the compound. The HPLC was executed on Thermo Finnigan Surveyor instrument using BDS HYPERSIL C18 (Reverse Phase). 10 μL of the sample was injected into the column with the aid of a micro syringe and eluted by acetonitrile and methanol taken in (3:7) ratio at a flow rate of 0.2 mL/min. The outflow of HPLC was connected to thermo LCQ Deca XP MAX Mass Spectrometer instrument with Electro Spray Ionization source operated in a positive mode.
2.4.6. Detection of acid production
The color of the blue pigment changed with pH value, the pigment became red in acidic condition and blue in basic condition (Zhang et al., 2006), this property of changing color with pH value helps to differentiate between acid and non-acid producer. For the detection of acid production the isolate klmp33 was inoculated at one end of SCA medium and incubated at 27 °C for three days.
As the pH of the medium is maintained at basic condition a blue pigment was produced on the plate. After the pigment production, the test organism was inoculated beside the pigment and incubated at the optimum temperature of the test organism and visualized for the change in color. In this study, two test organisms A. flavus MTCC 277 and A. niger MTCC 281 were used to check whether they produce acid or not. A control containing only isolate klmp33 was also kept.
3. Results
3.1. Identification and phylogenetic position of isolate klmp33
Identification of the isolate klmp33 isolated from the Gulbarga, Karnataka, India was done on the basis of morphology, microscopic, biochemical characterization (Table 1), and 16S rRNA sequencing. The isolate klmp33 was identified as S. coelicolor. The phylogenetic position of isolate klmp33 was determined (Fig. 1) shows the relationship between the isolate klmp33 and other related actinomycetes found in the Gene Bank database. The homology result showed that the isolate klmp33 was in the phylogenetic branch of S. coelicolor.
Table 1.
Microscopic, morphological and biochemical characteristics of actinomycete klmp33.
| Gram | Positive |
| Spore staining | Positive |
| Motility | Non motile |
| Soluble pigment | Blue |
| Aerial mycelium color | White |
| Substrate mycelium color | Blue |
| Catalase | Positive |
| Reduction of nitrate | Positive |
| Starch hydrolysis | Positive |
| Gelatin hydrolysis | Positive |
| Utilization of sugars | |
| Fructose | Positive |
| Dextrose | Positive |
| Mannitol | Positive |
| Mannose | Positive |
| Inulin | Positive |
| Arabitol | Positive |
| Malonate | Positive |
| Adonitol | Positive |
| Salicin | Positive |
Figure 1.
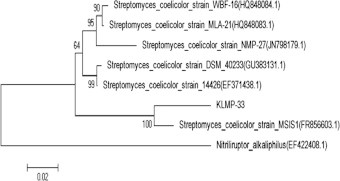
Phylogenetic tree of isolate klmp33 and related organisms was aligned based on 16S rRNA sequence (neighbor-joining tree). The sequences have been retrieved from NCBI database. The values at nod represent percentage of 1000 bootstrap replicates. Numbers in bracket represent Gene Bank accession number.
3.2. Pigment analysis
3.2.1. Pigment solubility
The pigment was soluble in chloroform and methanol but insoluble in dioxane. The solubility result correlates with γ actinorhodin (Bystrykh et al., 1996, Coisne et al., 1999).
3.2.2. UV–visible spectroscopy
According to Coisne et al. (1999), γ actinorhodin shows maximum absorption (λmax) at 638 nm when extracted with equal volume of 1 M sodium hydroxide. The pigment produced by the isolate klmp33 showed similar absorption (λmax) when extracted with equal volume of 1 M sodium hydroxide (Fig. 2).
Figure 2.
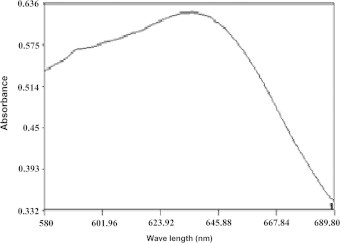
UV–visible spectroscopy of the pigment produced by isolate klmp33 showing maximum absorption at 638 nm.
3.2.3. TLC
TLC assay of the pure pigment on silica-gel 60 F254 plate yielded a single spot with an Rf value of 0.28 indicating the presence of γ actinorhodin (Bystrykh et al., 1996).
3.2.4. FTIR
FTIR of pigment exhibited absorption peaks at 1152, 1598, 1645 and 3320 cm−1 due to cyclic C–O–C, C O and OH functional groups respectively (Fig. 3) this corresponds to γ actinorhodin functional group.
Figure 3.
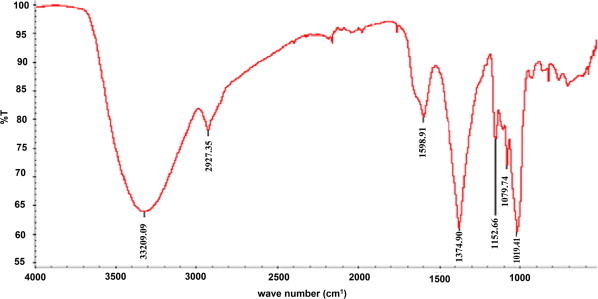
FT-IR spectra of the pigment produced by isolate klmp33.
3.2.5. LC/MS
LC/MS analysis was carried out to analyze the mass spectrum of the pigment. The pigment displayed the m/z value at 634 (Fig. 4) agreeing to data for authentic γ actinorhodin.
Figure 4.
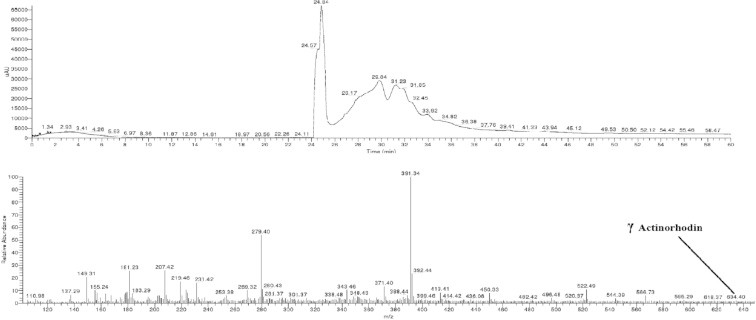
LC/MS analysis of the pigment produced by isolate klmp33.
On the basis of pigment solubility, UV–visible spectroscopy, TLC, FTIR and LC/MS analysis the pigment was analyzed as γ actinorhodin (Fig. 5).
Figure 5.
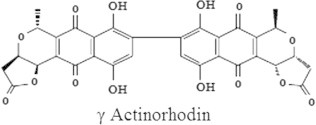
Structure of γ actinorhodin.
3.3. Detection of acid production
The acid production was detected by visualizing the change in color, if the test organism is an acid producer the pigment color changes from blue to red. The color remains the same if it is a non acid producer. Of the two test organisms used A. niger MTCC 281 was found as an acid producer as the pigment color transits from blue to red, while A. flavus MTCC 277 established as a non-acid producer, because the color remained the same. The control plate, also further incubated along with the test organism; it was observed that the color (blue) remained the same indicating the color change in case of A. niger MTCC 281 is due to acid production (Fig. 6).
Figure 6.
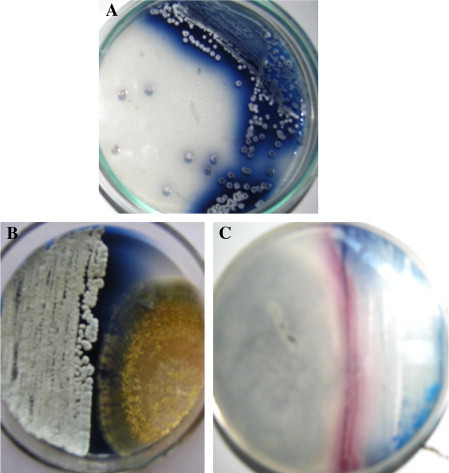
(A) Control plate inoculated with isolate klmp33 producing blue pigment in basic condition. (B) The pigment remains the same when the test organism is a non-acid producer (Aspergillus flavus MTCC 277). (C) The pigment changes from blue to red when the test organism is an acid producer (Aspergillus niger MTCC 281). (For interpretation of color in this figure, the reader is referred to the web version of this article).
3.4. Toxicological study of γ actinorhodin
As reported by Ling et al. (2002) γ actinorhodin is non toxic (LD50 > 15 mg/g) so, it is safe to use γ actinorhodin in place of synthetic dye.
4. Discussion
Biochemical reactions serve as a thumbprint for the identification of microorganism. To characterize a natural isolate, sometimes it is important to identify the end products of metabolism presenting different media. This can be done by adding an indicator to the medium that will react specifically with the end product, producing some visible reaction such as color change. The results of these on the suspected microorganisms are compared to known result to confirm its identification (Harish, 2008). Based on the biochemical reaction, microorganisms are classified as acid or non-acid producer depending on the ability to secrete acid into the surrounding which alters the pH of the medium, the alteration of pH was detected by adding pH indicating synthetic dyes like Congo red, phenol red, methyl red etc. that mainly belong to azo dye and changes according to the pH (Aneja, 2003). Nevertheless, usages of such dyes in gigantic scale, and for other various uses cause considerable environmental pollution and health problems (Anjaneya et al., 2011) as their precursor, and a number of their reaction products are carcinogenic (Brown and De Vito, 1993). It is very difficult to treat such water waste practicing traditional biological processes (Poon et al., 1999). However, various physicochemical decolorization technique guidelines were reported. Few however, been accepted by the industries to treat dye water waste, but lack to implement due to the high cost and low efficiency (Asgher et al., 2007).
Many bacteria are capable to degrade such type of dyes, aerobically and anaerobically but often the metabolic products, usually aromatic amines are noxious or even more dangerous than the starting dye (Dawkar et al., 2009), so natural pigments are required, which substitute synthetic dye. Many of the natural pigments have been used from antiquity like red pigment produced by Monascus purpureus, but the pigment fails to transit according to the pH (Kim et al., 1977). In the present study, isolate klmp33 produced a blue pigment. The pigment was identified as γ actinorhodin, served to detect acid production, as it is blue in basic and red in acidic condition. As reported, the change in color is due to change in H-ion concentration (Conn and Conn, 1941). Many studies have been reported on growth and nutritional parameters for the production of actinorhodin (Bystrykh et al., 1996, Coisne et al., 1999, Hobbs et al., 1990), but no reports on the usage of γ actinorhodin as a pH indicator which differentiates between acid and non-acid producer, as the pigment obtained from the natural source is safe and attorney for synthetic dyes.
Acknowledgement
Authors acknowledge Prof.A.Venktaraman, Chairman, Department of Materials Science, Gulbarga University, Gulbarga for providing FTIR facility.
Footnotes
Peer review under responsibility of King Saud University.

References
- Abbas A., Edwards C. Effects of metals on Streptomyces coelicolor growth and actinorhodin production. Appl. Environ. Microbiol. 1990;3:675–680. doi: 10.1128/aem.56.3.675-680.1990. [DOI] [PMC free article] [PubMed] [Google Scholar]
- Aneja K.R. New Age International Publishers; India: 2003. Experiments in Microbiology, Plants Pathology and Biotechnology. [Google Scholar]
- Anjaneya O., YogeshSouche S., Santoshkumar M., Karegoudar T.B. Decolorization of sulfonated azo dye Metanil Yellow by newly isolated bacterial strains: Bacillus sp. strain AK1and Lysinibacillus sp. strain AK2. J. Hazard. Mater. 2011;190:351–358. doi: 10.1016/j.jhazmat.2011.03.044. [DOI] [PubMed] [Google Scholar]
- Asgher M., Bhatti H.N., Shah S.A.H., Asad M.J., Legge R.L. Decolorization potential of mixed microbial consortia for reactive and disperse textile dyestuff. Biodegradation. 2007;18:311–316. doi: 10.1007/s10532-006-9065-7. [DOI] [PubMed] [Google Scholar]
- Bentley S.D., Chater K.F., Cerdeno-Tarraga A.M., Challis G.L., et al. Complete genome sequence of the model Actinomycete Streptomyces coelicolor A3(2) Nature. 2002;417:141–147. doi: 10.1038/417141a. [DOI] [PubMed] [Google Scholar]
- Brown M.A., De Vito S.C. Predicting azo dye toxicity. Crit. Rev. Environ. Sci. Technol. 1993;23:249–324. [Google Scholar]
- Bystrykh L.V., Fernandez-Moreno M.A., Herrema J.K., Malpartida F., Hopwood D.A. Production of actinorhodin-related blue pigments by Streptomyces coelicolor A3(2) J. Bacteriol. 1996;178:2238–2244. doi: 10.1128/jb.178.8.2238-2244.1996. [DOI] [PMC free article] [PubMed] [Google Scholar]
- Chattopadhyay P., Chatterjee S., Sen S.K. Biotechnological potential of natural food grade biocolorants. Afr. J. Biotech. 2008;17:2972–2985. [Google Scholar]
- Coisne S., Bechet M., Blondeau R. Actinorhodin production by Streptomyces coelicolor A3(2) in iron-restricted media. Lett. Appl. Microbiol. 1999;28:199–202. doi: 10.1046/j.1365-2672.1999.00509.x. [DOI] [PubMed] [Google Scholar]
- Conn H.J., Conn J.E. Value of pigmentation in classifying Actinomycetes: a preliminary note. J. Bacteriol. 1941;6:791–799. doi: 10.1128/jb.42.6.791-799.1941. [DOI] [PMC free article] [PubMed] [Google Scholar]
- Dawkar V.V., Jadhav U.U., Ghodake G.S., Govindwar S.P. Effect of inducers on the decolorization and biodegradation of textile azo dye navy blue 2GL by Bacillus sp. VUS. Biodegradation. 2009;20:777–787. doi: 10.1007/s10532-009-9266-y. [DOI] [PubMed] [Google Scholar]
- Dhanve R.S., Kalyani D.C., Phugare S.S., Jadhav J.P. Coordinate action of exiguobacterial oxidoreductive enzymes in biodegradation of reactive yellow 84A dye. Biodegradation. 2009;20:245–255. doi: 10.1007/s10532-008-9217-z. [DOI] [PubMed] [Google Scholar]
- Downham A., Collins P. Coloring our foods in the last and next millennium. Int. J. Food Sci. Tech. 2000;35:5–22. [Google Scholar]
- Gupta C., Amar P.G., Prakash D., Goyal S., Gupta S. Microbes as potential source of biocolors. Pharmacol. Online. 2011;2:1309–1318. [Google Scholar]
- Harish S. Infinity science press llc; Boston: 2008. Biotechnology Procedures and Experiments Handbook. [Google Scholar]
- Hobbs G., Frazer C.M., Gardner D.C.J., Flett F., et al. Pigmented antibiotic production by Streptomyces coelicolor A3(2): kinetics and the influence of nutrients. J. Gen. Microbiol. 1990;136:2291–2296. [Google Scholar]
- Itoh T., Taguchi T., Kimberley M.R., Milburn K.B., Stephenson G.R., Ebizuka Y., Ichinose K. Actinorhodin biosynthesis: structural requirements for post-PKS tailoring intermediates revealed by functional analysis of ActVI-ORF1 reductase. Biochemistry. 2007;46:8181–8188. doi: 10.1021/bi700190p. [DOI] [PubMed] [Google Scholar]
- Kim S.S., Rhee S.H., Kim I. Studies on production and characteristics of edible red color pigment produced by mold. Kor. J. Appl. Microbiol. Bioeng. 1977;11:277–283. [Google Scholar]
- Ling L., Cut H.L., Chen Y.N., Yuan S. Isolation and identification of Streptomyces sp. and assay of its exocellular water-soluble blue pigments. Folia Microbiol. 2002;5:493–498. doi: 10.1007/BF02818787. [DOI] [PubMed] [Google Scholar]
- Marroquin A.S., Zapata M. Observations on the pigment of Streptomyces coelicolor. Appl. Microbiol. 1954:102–107. doi: 10.1128/am.2.2.102-107.1954. [DOI] [PMC free article] [PubMed] [Google Scholar]
- Mazmanci M.A., Unyayar A. Decolorization of reactive black 5 by Funalia trogii immobilised on Luffa cylindrica sponge. Process Biochem. 2005;40:337–342. [Google Scholar]
- Poon C.S., Huang Q.P., Fung C. Degradation of cuprophenyl yellow RL by UV/H2O2/Ultrasonication (US) process in aqueous solution. Chemosphere. 1999;38:1005–1014. [Google Scholar]
- Raisainen R., Nousiainen P., Hynninen P.H. Dermorubin and 5-chlorodermorubin natural anthraquinone carboxylic acids as dyes for wool. Text. Res. J. 2002;72:2002973–2002976. [Google Scholar]
- Shirling E.B., Gottlieb D. Methods for characterization of Streptomyces species. Int. J. Syst. Evol. Microbiol. 1966;16:313–340. [Google Scholar]
- Tamura K., Peterson D., Peterson N., Stecher G., Kumar S. MEGA5: molecular evolutionary genetics analysis using maximum likelihood, evolutionary distance, and maximum parsimony methods. Mol. Biol. Evol. 2011;28:2731–2739. doi: 10.1093/molbev/msr121. [DOI] [PMC free article] [PubMed] [Google Scholar]
- Unagul P., Wongsa P., Kittakoop P., Intamas S., Kulchai P.S., Tanticharoen M. Production of red pigments by the insect pathogenic fungus Cordyceps unilateralis BCC 1869. J. Ind. Microbiol. Biotechnol. 2005;32:135–140. doi: 10.1007/s10295-005-0213-6. [DOI] [PubMed] [Google Scholar]
- Venil C.K., Lakshmanaperumalsamy P. An insightful overview on microbial pigment, prodigiosin. Elect. J. Biol. 2009;3:49–61. [Google Scholar]
- Williams S.T., Sharpe M.E. vol. 4. Williams and Wilkins; Baltimore: 1989. (Bergey’s Manual of Systematic Bacteriology). [Google Scholar]
- Zhang H., Zhan J., Keman S.U., Zhang Y. A kind of potential food additive produced by Streptomyces coelicolor: characteristics of blue pigment and identification of a novel compound, λ-actinorhodin. Food Chem. 2006;95:186–192. [Google Scholar]