

Abstract
The goal of controlling ovarian cancer metastasis formation has elicited considerable interest in identifying the tissue microenvironments involved in cancer cell colonization of the omentum. Omental adipose is a site of prodigious metastasis in both ovarian cancer models and clinical disease. This tissue is unusual for its milky spots, comprised of immune cells, stromal cells, and structural elements surrounding glomerulus-like capillary beds. The present study shows the novel finding that milky spots and adipocytes play distinct and complementary roles in omental metastatic colonization. In vivo assays showed that ID8, CaOV3, HeyA8, and SKOV3ip.1 cancer cells preferentially lodge and grow within omental and splenoportal fat, which contain milky spots, rather than in peritoneal fat depots. Similarly, medium conditioned by milky spot–containing adipose tissue caused 75% more cell migration than did medium conditioned by milky spot–deficient adipose. Studies with immunodeficient mice showed that the mouse genetic background does not alter omental milky spot number and size, nor does it affect ovarian cancer colonization. Finally, consistent with the role of lipids as an energy source for cancer cell growth, in vivo time-course studies revealed an inverse relationship between metastatic burden and omental adipocyte content. Our findings support a two-step model in which both milky spots and adipose have specific roles in colonization of the omentum by ovarian cancer cells.
CME Accreditation Statement: This activity (“ASIP 2013 AJP CME Program in Pathogenesis”) has been planned and implemented in accordance with the Essential Areas and policies of the Accreditation Council for Continuing Medical Education (ACCME) through the joint sponsorship of the American Society for Clinical Pathology (ASCP) and the American Society for Investigative Pathology (ASIP). ASCP is accredited by the ACCME to provide continuing medical education for physicians.
The ASCP designates this journal-based CME activity (“ASIP 2013 AJP CME Program in Pathogenesis”) for a maximum of 48 AMA PRA Category 1 Credit(s)™. Physicians should only claim credit commensurate with the extent of their participation in the activity.
CME Disclosures: The authors of this article and the planning committee members and staff have no relevant financial relationships with commercial interests to disclose.
It is estimated that 22,240 women will be diagnosed with and 14,030 women will die of cancer of the ovary in 2013 (http://seer.cancer.gov/csr/1975_2009_pops09, last accessed June 18, 2013). The majority of patients present with metastases or eventually die of metastatic disease within the abdominal cavity. After escape from the primary tumor, ovarian cancer cells in the peritoneal fluid have access to and can potentially lodge within a variety of tissues.1,2 In both clinical disease and experimental models, however, the omentum is the site of prodigious metastasis formation.3–6 Thus, attachment of ovarian cancer cells to the omentum represents an early step in the development of widespread peritoneal disease.7,8 Although the importance of the omentum is widely acknowledged, there still is no consensus on its role in metastasis formation. This raises the question of what components of the omental tissue microenvironment participate in, or facilitate, ovarian cancer metastatic colonization.
Studies of omental function date back to the early 19th century. Jobert de Lamballe, a 19th-century surgeon in France, was reportedly the first to recognize the curious ability of this organ to fight infection and form adhesions to help control injuries.9 After nearly two centuries of investigation, a great deal is known about the physiology and surgical applications of the omentum.9–12 As the central regulator of peritoneal homeostasis, its functions include regulating fluid and solute transport, sensing and repairing injuries, promoting angiogenesis, fighting infection, serving as a source of stem cells, producing regulatory molecules, and storing and supplying lipids. These diverse functions are conferred by the cellular composition and architecture characteristic of human omenta.
Aside from the clear collagenous membrane that acts as a scaffold for the organ, the majority of the omentum is composed of bands of adipose tissue that contain adipocytes, blood and lymph vessels, immune cells, stromal cells, and connective matrix components that lie beneath an irregular mesothelium.13 In general, adipocytes have a variety of functions, ranging from lipid storage to production of endocrine molecules, and can serve as an integrating hub for inflammation, metabolism, and immunity.2,14–23 A distinctive feature of the omental vasculature is the presence of numerous branching blood vessels ending in tortuous glomerulus-like capillary beds near the tissue periphery.24–28 Immune cells aggregate around and within these capillary beds to form milky spots, which are the major immune structure for host defense of the peritoneal cavity.24,29–36 In milky spots, both the endothelial lining of the capillaries and the overlying mesothelium are specially adapted to facilitate transmigration of immune cells.24,37,38 Additional structural elements include plasmocytes, fibroblasts, and mesenchymal cells, as well as collagen and reticular and elastic fibers.29,34,37,39
A comprehensive literature review showed that studies examining the role of the omentum in metastasis focus on the contribution of its individual components, and not on the tissue as a whole. In our view, results from the majority of studies support models in which ovarian cancer metastatic colonization is driven either purely by milky spots or purely by adipocytes. The milky spot–driven model is based on a large body of in vivo data showing that, on intraperitoneal injection, cancer cells rapidly and specifically localize, invade, and proliferate within omental milky spots.3,6,24,28,40–44 In contrast, the adipocyte-driven model is based on the observation that, in its resting state, the omentum is composed predominantly of adipose and that cultured adipocytes can produce adipokines capable of promoting ovarian cancer cell migration and invasion in vitro.45 Adipocytes can also provide a proliferative advantage by transferring fatty acids to ovarian cancer cells.45 Although both models have clear strengths, neither addresses the intimate and dynamic interaction among milky spots, surrounding adipocytes, and other components of omental tissues.
Taking tissue architecture and function as a guide, we propose that an alternative, more fully integrated model of metastatic colonization is needed. To test this idea, we identified peritoneal fat depots (omentum, mesentery, and uterine, gonadal, and splenoportal fat) that are accessible to ovarian cancer cells after intraperitoneal injection.2 Of these, the omentum and splenoportal fat are reported to contain milky spot structures.24,46 We reasoned that a comparison of peritoneal adipose that either contains or lacks milky spots could be used to determine the contributions of adipocytes and milky spots to the lodging and progressive growth of ovarian cancer cells in physiologically relevant tissues. In vivo studies using a panel of ovarian cancer cell lines showed that milky spots dramatically enhance early cancer cell lodging on peritoneal adipose tissues. Consistent with this finding, conditioned medium from milky spot–containing adipose tissue had a significantly increased ability to direct cell migration, compared with conditioned medium from milky spot–deficient adipose tissue. Studies using a panel of immunodeficient mice showed that the number and size of omental milky spots is not dependent on the mouse genetic background and, similarly, that ovarian cancer cell colonization does not depend on the immune composition of the milky spot. Finally, consistent with the role for lipids as an energy source for ovarian cancer cell growth, in vivo time-course studies revealed an inverse relationship between metastatic burden and adipocyte content in the omentum. Our findings support a two-step model in which both milky spots and adipose have specific roles in colonization of the omentum by ovarian cancer cells.
Materials and Methods
Cell Lines
The SKOV3ip.1 human ovarian carcinoma cell line47 was generously supplied by Dr. Gordon Mills (MD Anderson Cancer Center, Houston, TX). These cells were maintained in standard growth medium [Dulbecco’s modified Eagle’s medium (DMEM) containing 4.5 g/L d-glucose, 584 mg/L l-glutamine, and 110 mg/L sodium pyruvate (Mediatech, Manassas, VA), supplemented with 5% fetal bovine serum (Atlanta Biologicals, Lawrenceville, GA), and 1% penicillin/streptomycin (P/S) solution (a mixture of 5000 IU/mL penicillin and 5000 μg/mL streptomycin), 1× nonessential amino acids, and 2× minimum essentials medium vitamin solution (all from Mediatech)]. The HeyA8 human ovarian carcinoma cell line (ATCC, Manassas, VA) was maintained in standard growth medium [DMEM supplemented with 5% fetal bovine serum, 1% P/S, 1× nonessential amino acids, and 1× minimum essentials medium vitamin solution]. The CaOV3 human ovarian carcinoma cell line (ATCC) was maintained in standard growth medium [DMEM supplemented with 8% fetal bovine serum and 1% P/S]. The ID8 mouse ovarian carcinoma cell line, derived from and syngeneic to mice of the C57BL/6 background,4 was generously provided by Dr. Katherine Roby (University of Kansas Medical Center, Kansas City, KS). These cells were maintained in a standard growth medium [DMEM supplemented with 4% fetal bovine serum, 1% P/S solution, and 5 μg/mL insulin-transferrin-sodium selenite (Roche Diagnostics, Indianapolis, IN)]. ID8 cells that stably express tdTomato (ID8-tdTomato) were constructed by lentiviral delivery of pLVX-tdTomato expression vector (Clontech, Mountain View, CA) followed by selection for puromycin resistance. In brief, 3 μg of pLVX-tdTomato and 9 μg of ViraPower lentiviral packaging mix (Life Technologies–Invitrogen, Carlsbad, CA) was transfected into HEK293T cells to generate the viral conditioned medium. The ID8 cells were transduced with the viral medium and established by selection in medium containing 0.6 μg/mL puromycin. Fluorescence-activated cell sorting using a BD FACSAria II system (BD Biosciences, San Jose, CA) at the University of Chicago Flow Cytometry Core Facility was used to select for high tdTomato-expressing cells. All cells were maintained under standard tissue culture conditions (ie, in a humidified incubator at 37°C supplemented with 5% CO2).
Mice
All mice were housed, maintained, and euthanized according to Institutional Animal Care and Use Committee guidelines and under the supervision of the University of Chicago Animal Resource Center. Outbred CD1 mice were obtained from Charles River Laboratories International (Wilmington, MA). Inbred B6 (C57BL/6NHsd; immunocompetent), Nude (Athymic Nude-Foxn1nu; T-cell deficient), and BN XID (Hsd:NIHS-LystbgFoxn1nuBtkxid; NK-cell and T-cell deficient) mice were obtained from Harlan Laboratories (Indianapolis, IN). Rag1 (B6.129S7-Rag1tm1Mom/J; with no mature T or B cells, no CD3-positive cells, and no T cell receptor α-β–positive cells) and Igh6 (B6.129S2-Ighmtm1Cgn/J; lacking mature B cells) mice were obtained from Jackson Laboratories (Bar Harbor, ME).
Harvesting Mouse Tissues
The locations of the well-defined adipose depots used for the present studies have been described previously.2 Omenta were harvested as described by Khan et al.6 Splenoportal fat bands were collected by isolating the thin fatty band of tissue connecting the hilum of the spleen to the pancreas,46 releasing it from the pancreas, and then carefully dissecting it from the spleen. Uterine fat was excised from the uterine horns using dissecting scissors; gonadal fat was similarly excised from the ovaries. Mesenteries were collected by first cutting the junction between the small intestine and the pylorus, firmly gripping the free end of the small intestine with forceps, peeling the small intestine from the mesentery by pulling the tissue slowly, and finally releasing the mesentery from the mesentery root using dissecting scissors.
Preparation of Tissues for Standard Histological Evaluation
Tissues were processed for histological evaluation immediately after harvest or ex vivo culture. Larger tissues (whole gonadal fat, uterine fat, and mesentery) were fixed in 10% neutral buffered formalin (Sigma-Aldrich, St. Louis, MO) for 48 hours at 4°C. Smaller tissues (whole omentum, splenoportal fat, and tissue equivalents of uterine fat and mesentery) were fixed overnight (12 to 16 hours) in 5% neutral buffered formalin (Sigma-Aldrich) at 4°C. Fixed tissue was stored in 70% ethanol at 4°C until paraffin embedding. Tissues were sectioned (4 μm thick) and stained with H&E at the University of Chicago Human Tissue Resource Center. Histological evaluation of tissues was performed by a pathologist (M.C.) under masked conditions.
Immunohistochemistry
Tissue sections were deparaffinized in xylenes and rehydrated through serial dilutions of ethanol to distilled water. Sections were subsequently incubated in antigen retrieval buffer (Dako, Carpinteria, CA) and heated in a steamer to 97°C for 20 minutes. Primary antibodies were diluted in Tris-buffered saline and Tween 20 with 0.025% Triton X-100. Pancytokeratin (clone H-240; sc-15367; Santa Cruz Biotechnology, Santa Cruz, CA) and CD45 (clone H130; 14-0459-82; eBioscience, San Diego, CA) were applied to tissue sections at a 1:100 dilution and incubated for 1 hour at room temperature. After application of primary antibody, slides were rinsed in Tris-buffered saline, and then biotinylated secondary antibody diluted in Tris-buffered saline and Tween 20 (with 10% mouse serum; Jackson ImmunoResearch, West Grove, PA) was applied to the slides. For pancytokeratin staining, sections were incubated with goat anti-rabbit IgG (1:200 dilution; BA-1000; Vector Laboratories, Burlingame, CA) for 30 minutes at room temperature. For CD45 staining, sections were incubated with anti-mouse IgG (1:100 dilution; BA-2001; Vector Laboratories) for 30 minutes at room temperature. The biotinylated secondary antibody was detected using a Vectastain Elite ABC kit (Vector Laboratories) and 3,3′-diaminobenzidine (DAB; Dako) peroxidase substrate. Cytokeratin 8/18 (TROMA-1; Developmental Studies Hybridoma Bank, University of Iowa, Iowa) was applied undiluted on tissue sections for 1 hour. Antigen–antibody binding was detected using a Bond Polymer Refine Detection system (DS9800; Leica Biosystems, Buffalo Grove, IL).
Cytokeratin 8/18–stained slides were scanned using an Aperio ScanScope XT instrument (Aperio Technologies, Vista, CA) at ×20 magnification. An Aperio color deconvolution algorithm (Color Deconvolution version 9.1; Aperio Technologies) was used for analyzing each omentum for oxidized DAB intensity. The input parameters for each channel (hematoxylin and DAB) were separately calibrated before the analysis. Digital scan of each omentum was selected using the pen tool within the ImageScope viewing software version 11.1.2.752 (Aperio) and analyzed for intensity levels on a four-point scale (3 = strong staining, 2 = medium staining, 1 = weak staining, and 0 = no staining). Intensity was reported as percentage of cells with strong plus medium DAB staining, normalized to the total stained area.
Peritoneal Metastasis Assay
Exponentially growing SKOV3ip.1, HeyA8, CaOV3, or ID8 cells were trypsinized and prepared as a single-cell suspension at a concentration of 2 × 10⁶ cells/mL in ice-cold PBS. Animals were injected intraperitoneally with 500 μL of the cell suspension (1 × 10⁶ cells) at a point equidistant between the inguinal papillae. For all experiments, 500 μL of ice-cold PBS was injected as a negative control in a parallel group of control mice. At the experimental endpoint of each assay, mice were sacrificed via CO2 asphyxiation and vital organs were removed. Tissues were then harvested, processed, sectioned, and stained as described above.
Tissue Dissociation and Flow Cytometry
B6 mice were injected intraperitoneally with either PBS or 1 × 10⁶ ID8-tdTomato cells. At 7 days post injection (dpi), animals were sacrificed and peritoneal fat depots were excised and immediately placed in ice-cold PBS. Tissues were subsequently transferred to separate 5-mL Eppendorf tubes containing 3 mL of serum-free (SF) DMEM containing 0.2% (w/v) collagenase I (Worthington Biochemical, Lakewood, NJ) and 0.1% (w/v) bovine serum albumin (Sigma-Aldrich). The tissues were then minced using surgical scissors, and the tissue suspension was incubated at 37°C for 30 minutes with rotational mixing. To enhance tissue dissociation, the digested tissue was transferred to a microstomacher bag and masticated in a Stomacher 80 Biomaster system (Seward, Worthing, UK) on low for 10 minutes, rotating bags after 5 minutes.
To ensure a sufficient yield of cells for flow cytometry, cell suspensions prepared from tissues harvested from three independent mice were pooled to form one sample. Pooled samples were filtered through a nylon mesh filter (60-μm pore) to remove larger debris. To collect the cellular component of the digestion, the filtrate was centrifuged at 250 × g for 5 minutes; the supernatant fraction was removed and discarded. To lyse RBCs, the cell pellet was resuspended in 100 μL PBS combined with 900 μL ACK lysing buffer (Invitrogen) and was incubated at room temperature for 1 minute. Cells were collected for flow cytometric analysis by centrifugation at 250 × g for 5 minutes; the supernatant fraction was removed and discarded. The remaining pelleted cells were resuspended in 250 μL ice-cold PBS. Finally, to ensure that no clumped cells remained, the cell suspension was passed through a filter (60-μm pore) and the filter was rinsed with 250 μL ice-cold PBS. The cell suspension was analyzed for the presence of tdTomato-labeled cells using an LSRII flow cytometer (BD Biosciences) equipped with a 561-nm yellow-green laser and a 585 nm/15 nm bandpass filter. The tdTomato-positive gate was based on analysis of parental ID8 cells. Data are expressed as fold change in ID8-tdTomato cell-injected mice relative to PBS-injected control mice (n = 3 pooled samples for control mice and n = 5 pooled samples for ID8-tdTomato cell–injected mice).
Preparation of Tissue-Conditioned Medium
Tissues harvested under sterile conditions were immediately placed in ice-cold, sterile PBS. After collection, tissue equivalents were prepared by first weighing the omentum from an individual mouse and then excising a strip of uterine fat or branch of mesentery of equivalent weight. In our studies, a single band of splenoportal fat weighed 2.90 ± 0.62 mg (means ± 2 SD). Given that this is approximately one half the weight of an omentum (6.72 ± 2.82 mg), two fat bands were combined to make one tissue equivalent. Each tissue equivalent was placed in its own well of a polystyrene 12-well plate containing 1.25 mL DMEM/F-12 medium supplemented with 20% fetal bovine serum and 1% P/S and was incubated at 37°C in a 5% CO2–enriched atmosphere, as described by Khan et al.6 Tissues were allowed to acclimate to these ex vivo conditions for 24 hours, after which the serum-containing medium was removed; the tissues were then carefully rinsed with PBS and placed in 1.25 mL SF DMEM/F-12 medium (containing 1% P/S). After 24 hours of conditioning, the SF medium was collected and used for Transwell migration assays (described below).
For longer ex vivo culture, the medium was changed to fresh SF DMEM/F-12 medium at subsequent 24-hour intervals, such that the tissues were fed for the first 24 hours and starved for the remainder of the assay. Conditioned medium from each 24-hour interval was collected. To ensure that stimulatory activity in the conditioned medium was due to secretion of chemotactic factors and not to cellular breakdown, tissue integrity was assessed by H&E staining and light microscopy, as described by Khan et al.6 Tissue function was also confirmed by measuring IL-6 levels in the conditioned medium. IL-6 is produced by adipose, mesothelial cells, and immune cells and is immediately secreted into the microenvironment.48 Specifically, enzyme-linked immunosorbent assays (ELISA) for IL-6 were performed on tissue-conditioned medium using a Mouse IL-6 Platinum ELISA kit (eBioscience, San Diego, CA) according to the manufacturer’s instructions.
Transwell Migration Assay
All migration assays used the same physical setup, with 1 mL of conditioned or control medium (unconditioned SF culture medium) to be tested for chemoattractant activity placed in a well of a 12-well plate acting as the lower chamber. Cancer cells were placed in the upper chamber consisting of a PET 8 μm pore membrane in a suspended from an insert scaffold (Corning Life Sciences, Lowell, MA). Exponentially growing SKOV3ip.1 or ID8 cells were trypsinized and resuspended in SF DMEM at a concentration of 3.33 × 10⁵ cells/mL or 2.50 × 10⁵ cells/mL, respectively. In each case, 600 μL of cell suspension (SKOV3ip.1, 2.0 × 10⁵ total; ID8, 1.5 × 10⁵ total) was added to the upper chamber. Cells were allowed to migrate in response to signals from conditioned or control medium for 6 hours under standard tissue culture conditions.
After incubation, medium was aspirated from both chambers, and the upper and lower surfaces of the membrane were washed once with ice-cold PBS. The membrane was fixed in 10% buffered formalin for 10 minutes at room temperature. Residual formalin was removed by washing with ice-cold PBS. Both sides of the membrane were subsequently stained with 0.05% crystal violet solution (Thermo Fisher Scientific, Waltham, MA) for 30 minutes at room temperature and then washed once with tap water. Cells that had not migrated through the membrane were removed by gently wiping the upper membrane surface with a cotton swab; the membrane was then allowed to air-dry overnight. Finally, the membrane was removed from the Transwell scaffold using a scalpel and was mounted with the top surface facing up onto a slide using Permount mounting medium (Thermo Fisher Scientific). Five random images were captured per slide at ×100 magnification with a Zeiss Axiovert 200M inverted microscope (Carl Zeiss, Jena, Germany) at the University of Chicago Integrated Microscopy Core Facility, and the number of cells that had migrated through the membrane was quantified. ImageJ 64 software version 1.45s (NIH, Bethesda, MD) was used to quantitate the total number of migrated cells present in each image. The counts from each of the five images were summed to give the number of migrated cells for each sample (n = 5 for all conditions).
Milky Spot Identification Using Carbon Nanopowder Uptake
Carbon nanopowder was used to visualize omental milky spots, essentially as described previously.29 In brief, carbon nanopowder (<50-nm particle size; Sigma-Aldrich) was mixed with PBS at a concentration of 5 mg/mL and was sonicated for 20 minutes to produce a homogenous suspension. The suspension was autoclaved, allowed to cool to room temperature, and resonicated for 20 minutes immediately before injection. Mice were intraperitoneally injected with 800 μL of the carbon suspension. At 14 dpi, mice were euthanized. Omenta were harvested and fixed in 10% formalin for 2 hours at room temperature. Whole fixed tissue was dehydrated through increasing concentrations of ethanol (70%, 90%, 100%, and 100%; 10 minutes each) and was cleared in xylene for 10 minutes. Tissues were then whole-mounted between a slide and coverslip using Permount medium. Images of the whole-mounted tissues were captured using a CRi Pannoramic Scan Whole Slide Scanner at the University of Chicago Light Microscopy Core Facility, and images were processed with Pannoramic Viewer software version 1.15.2 (3DHistech, Budapest, Hungary).
Milky Spot Identification Using Giemsa Staining
Excised omenta were prepared for standard histological evaluation, with careful orientation of the tissues during paraffin embedding to produce longitudinal sections. The whole omentum was serially sectioned at 4-μm thickness, and every third section was Giemsa stained (Fluka; Sigma-Aldrich). Slides were deparaffinized in xylenes and rehydrated through serial dilutions of ethanol to water. Slides were stained in 5% Giemsa solution (prepared in tap water) for 4 minutes, rinsed in tap water for 60 seconds, allowed to air-dry, and mounted using Permount. Images of the stained slides were captured using a CRi Pannoramic Scan Whole Slide Scanner and were processed with Pannoramic Viewer software (3DHistech).
Three-Dimensional Rendering of Giemsa-Stained Omentum
ImageJ software was used to render a three-dimensional image of a B6 omentum. Imaged, Giemsa-stained omentum sections from an entire omentum were aligned using the StackReg plug-in.49 The resulting stack was inverted and the 3D Project tool, with the Interpolate function set to a slide spacing of 4 μm, was used to render a three-dimensional image. This was converted to 8-bit grayscale and was false-colored using the Union Jack color scheme.
Milky Spot Identification and Quantitation in Giemsa-Stained Omentum
ImageJ software was used to quantify milky spot volume in Giemsa-stained omental sections. Images were converted to 8-bit grayscale and inverted. The color balance was adjusted to increase the contrast between the milky spots and surrounding tissue. The image was converted to binary format, to reduce background noise, and then was inverted again. The threshold was set using the Auto function, resulting in an image in which milky spots are pure black and the rest of the tissue is pure white. The immune aggregates were measured using the Analyze Particles function. This was repeated for each of the Giemsa-stained sections from each omentum. For each omentum, milky spot areas per section were multiplied by 4 μm and summed to yield a total milky spot volume.
The whole omentum volume was measured by adjusting the brightness and contrast of the grayscale image to darken the immune aggregates. The threshold was set to include the entire tissue, and the image was converted to a pure black mask. To make a cohesive border for the omentum, the Find Edges tool was applied, and the image was again converted to a mask and the Fill Holes function was selected. Again, the omentum was quantified using the Analyze Particles function. Particles smaller than 25 pixels were excluded from the analysis, to reduce background noise. Areas for each omentum were multiplied by 4 μm and then were summed to yield a total whole omentum volume (n = 5 omenta per mouse strain).
Quantitation of Adipocyte Area in Omentum Over the Time Course of Metastatic Colonization
Omenta were harvested from mice at 1, 3, 6, and 9 weeks after ID8 cancer cell injection into B6 mice, and tissues were prepared for standard histological evaluation. H&E-stained sections were imaged using a CRi Pannoramic Scan Whole Slide Scanner. With ImageJ software, section images were converted to 8-bit grayscale, the brightness and contrast were adjusted to darken the nonadipocyte tissue, and the image threshold was set (using the Auto function) such that only nonadipocyte structures were transformed to pure black. These structures were measured using the Analyze Particles function, with particles smaller than 25 pixels excluded. Resulting areas were summed to produce a total nonadipocyte area. The whole omentum was measured by adjusting the threshold of a brightness- and contrast-adjusted grayscale image such that the whole area was converted to pure black. Again, the omentum was quantified using the Analyze Particles function, excluding particles smaller than 25 pixels and with the Include Holes option selected. Resulting areas were summed to yield a total omentum area. The percentage of adipocytes was calculated by subtracting the total nonadipocyte area from the total omentum area and dividing that difference by the total omentum area. Three sections were quantified per mouse, with n = 5 mice per time point.
Macros for the several image processing steps are provided in Supplemental Table S1.
Statistical Analysis
All statistical analyses were performed using GraphPad Prism software version 5.0f (GraphPad Software, La Jolla, CA). Statistical significance was determined using one-way analysis of variance followed by Tukey–Kramer multiple comparison tests. Data are expressed as means ± SEM of biological replicates.
Results
Several Sources of Adipose Tissue Are Accessible to Ovarian Cancer Cells in the Peritoneal Cavity
The organ-specificity of ovarian cancer metastasis is often explained by the anatomical location and tissue composition of the omentum.5,44 To our knowledge, however, these assertions have not been tested in vivo by evaluating ovarian cancer cell lodging or growth in other adipose depots that are also accessible during peritoneal dissemination. There are five major adipose depot structures in the peritoneal cavity.2 A lateral view of a ventral dissection allows visualization of the omentum, gonadal fat, uterine fat, and mesentery (Figure 1A). Further dissection allows for clear visualization of the splenoportal fat, which surrounds the splenic artery and connects the hilum of the spleen to the celiac artery (Figure 1B), and of the omentum, isolated from the pancreas (Figure 1C). The gross structure and relative size of these tissues can be seen in Figure 1D.
Figure 1.

Relative locations of the main peritoneal adipose depots, with ovary, uterine horn, and small intestine indicated as points of reference. A: Left view of the peritoneal cavity of a B6 mouse, exposed via a ventral incision. This gross anatomical dissection shows the relative location of four of the five primary sources of peritoneal fat: the omentum (OM; outlined), located above the stomach and spleen; the gonadal fat (GF), surrounding the left ovary (ov); the uterine fat (UF), attached to the left uterine horn (uh); and the mesentery (MY), attached to the small intestine (si). B: The fifth source of peritoneal adipose is the splenoportal fat, which can be exposed by lifting the spleen with forceps (SP; outlined). C: To improve visualization, the mouse omentum here is dissected free from the pancreas. Although analogous to the human omentum in composition and tissue architecture, the mouse omentum consists of a single ribbon of fat attached to the pancreas. D: The five sources of peritoneal fat are excised, to show relative size. The mesentery is shown with attached mesenteric root. The scale is marked in centimeters.
Interestingly, in 1995 Takemori et al46 reported the presence of milky spots in the splenoportal fat of New Zealand Black mice that are similar in structure and composition to omental milky spots previously reported in the literature. The authors did not, however, examine cancer cell localization to these structures. Our histological evaluation showed that both the omentum and splenoportal fat have archetypal milky spot structures, but these structures were not observed in uterine, gonadal, or mesenteric fat (Figure 2A). Furthermore, at 7 days after intraperitoneal injection of SKOV3ip.1 cells, similar cancer cell lesions were observed in both omental and splenoportal fat (Figure 2B), but not in other fat depots. IHC using a human pancytokeratin antibody showed that the lesions were composed of epithelial (SKOV3ip.1) cells intermingled with the immune cells. The specificity of IHC staining was confirmed using an IgG control for the pancytokeratin antibody (Figure 2B).
Figure 2.

Ovarian cancer cells preferentially colonize peritoneal adipose that contains milky spots. A: Milky spots (MS) are observed in the adipose (A) of the omentum and splenoportal fat of PBS-injected and naïve mice. In contrast, no milky spots were detected in the uterine fat, gonadal fat, or mesentery (each of which is composed mostly of adipocytes). Images are representative of PBS-injected B6 mice. Blood vessels are indicated by arrows. B: Examination of tissues by both standard histology (H&E) and IHC [pancytokeratin (pan-CK)] shows similar colonization of milky spots in both omentum and splenoportal fat (after injection of 1 × 10⁶ SKOV3ip.1 cells into Nude mice). Sections were first evaluated by H&E staining. The presence of epithelial (cancer) cells within the lesions was confirmed by IHC detection of cytokeratin using a pancytokeratin antibody. IHC using an IgG isotype antibody for pancytokeratin was used as a control for staining specificity. C: Evaluation of ID8, CaOV3, and HeyA8 ovarian cancer colonization of peritoneal fat depots at 7 dpi. Large cancer cell lesions in the milky spots of both the omentum and splenoportal fat are outlined. Representative examples of the cancer lesions occasionally seen in uterine, gonadal, and mesenteric fat are shown in the corresponding insets. D: Flow cytometric analyses of omentum, uterine fat, gonadal fat, and mesentery harvested from mice at 7 dpi of ID8-tdTomato cells. The quantified flow cytometry data are expressed as means ± SEM for fold change increase of tdTomato-positive events (grey bars) relative to PBS-injected mice (white bars). ∗∗P < 0.01 versus PBS controls. Original magnification: ×400 (A and C); ×100 (B).
Ovarian Cancer Cells Preferentially Colonize Peritoneal Adipose That Contains Milky Spots
A review of the literature showed that the predilection of ovarian cancer for omental metastasis formation can be ascribed to either adipose-driven or milky spot–driven mechanisms. However, these models are based on studies focusing on either structural features (ie, milky spots) or cellular components (ie, adipocytes) of omental tissue.28,42,45 The availability of peritoneal fat depots that contain or lack milky spot structures enabled us to distinguish experimentally between the two models in the physiologically relevant setting of the peritoneal cavity. We reasoned that if colonization were purely adipocyte-driven, then ovarian cancer cells would colonize the various peritoneal adipose depots to a similar extent after intraperitoneal injection. In contrast, if milky spots drive this process, then the omentum and splenoportal fat would have cancer cell foci in their numerous milky spots, whereas uterine, gonadal, and mesenteric fat would essentially be free of cancer cell colonies. Although our studies using SKOV3ip.1 cells support this latter model, determining the generalizability of these findings requires further study using additional ovarian cancer cell lines. To this end, the ability of ID8, CaOV3, and HeyA8 cells to form cancer cell foci in the five distinct peritoneal fat depots after intraperitoneal injection into B6 mice (ID8) or Nude mice (CaOV3, HeyA8) was assessed by histology. The average number of cancer cells in a representative section of tissue was determined and expressed as foci per slide (Supplemental Table S2). At 7 dpi, numerous large foci of ID8 cells were seen within the milky spots of both the omentum (mean, 48 foci per slide) and splenoportal fat (mean, 5 foci per slide) (Figure 2C). No ovarian cancer cells were detected in the uterine or gonadal fat (Figure 2C). In the mesentery, small clusters (<10 cells) of cancer cells were observed (mean, 2 foci per slide) on the tissue periphery (Figure 2C). In accord with these findings, CaOV3 cells showed similar pattern and extent of foci formation in the peritoneal adipose (Figure 2C and Supplemental Table S2). Interestingly, HeyA8 cells had a greater ability to form surface foci on uterine fat, with a mean of 8 foci per slide (Figure 2C and Supplemental Table S1).
Finally, to complement our findings from our histological analyses and to enable further studies, we developed a protocol to quantitate the number of cancer cells present in peritoneal adipose depots. ID8-tdTomato cells were prepared and injected intraperitoneally into B6 mice. At 7 dpi, the adipose organs were harvested and dissociated into a single-cell suspension. The number of tdTomato cells present in the population of remaining cells (eg, fibroblasts and immune, endothelial, and mesothelial cells) was quantified via flow cytometry. Splenoportal fat was excluded because its small size prohibited reliable cell recovery. Omental tissue preparations contained a significant population of tdTomato-positive cells (Figure 2D). The omentum showed an approximately 12-fold increase in the number of tdTomato-positive events, relative to PBS-injected controls (Figure 2D), but there was no significant increase in cell preparations from the gonadal fat, uterine fat, or mesentery. These data support our histological finding that ovarian cancer cells preferentially colonize milky spot–containing adipose and provide an additional quantitative method for further studies by our research group and others.
Omental Tissues Secrete a Factor or Factors That Can Promote Ovarian Cancer Cell Migration
Ovarian cancer cells specifically localize to the omentum within minutes after intraperitoneal injection.3,6,40 This suggests that omental tissue produces a factor or factors that promote cancer cell homing; however, previous studies have examined only the contribution of isolated adipocytes.45 To address this gap in knowledge, we first tested the ability of omentum-conditioned medium to promote directed cancer cell migration. Using a modification of our published method for ex vivo organ culture,6 omenta were excised and allowed to normalize in DMEM/F12 medium containing 20% fetal calf serum for 24 hours. Tissues were then rinsed with PBS, placed in SF DMEM/F-12 medium, and maintained for up to 5 days ex vivo. Tissue integrity was assessed both histologically, by visually evaluating intact (round, continuous cell membrane) versus necrotic (stellate, discontinuous cell membrane) adipocytes, and functionally, by measuring the level of IL-6 in the conditioned medium every 24 hours. In accord with our previous studies,6 omental tissues did not show loss of integrity or function under these conditions (Supplemental Figure S1).
After normalization in DMEM/F-12 medium containing 20% fetal calf serum, omenta were rinsed with PBS and allowed to condition SF DMEM/F-12 medium for 24 hours (referred to as conditioned SF medium). Omentum maintained in SF medium is termed starved omentum. The combinations of omentum and medium used as chemoattractants for the 6-hour migration assay and representative membranes from the migration assays are summarized in Figure 3A. The number of cells that migrated to the lower side of the membrane was determined by summing the number of cells in each of five independent fields observed at ×100 magnification.
Figure 3.

Milky spot–containing adipose tissues show enhanced ability to stimulate directed migration. Transwell migration assays are used as an indicator of soluble factors that promote the directed migration of ovarian cancer cells in tissue-conditioned medium. A, top row: Migration assay setup. Cancer cells are placed in the upper chamber of the Transwell apparatus. The chemoattractant medium, with or without starved tissue, is placed in the lower chamber. A, bottom row: Representative membranes from ID8 migration assays. B: Quantitation of ID8 and SKOV3ip.1 cell migration in response to factors produced by omenta harvested from CD1 mice under the four conditions shown in panel A. C: Quantitation of ID8 and SKOV3ip.1 cell migration in response to SF medium conditioned by omentum from either B6 mice [CSF (B6)] or Nude mice [CSF (Nude)]. D: Migration assay of ID8 cells toward SF medium conditioned for 24 hours by tissue equivalents of omenta, splenoportal fat, uterine fat, and mesentery harvested from B6 mice. n = 5 for all conditions. Data are expressed as means ± SEM. ∗∗∗P < 0.001. CSF, omentum-conditioned SF medium; SOM, starved omentum.
Initial studies tested the ability of omenta harvested from CD1 mice to promote migration of both mouse ID8 and human SKOV3ip.1 cells (Figure 3B). The CD1 conditioned SF medium served as a strong chemoattractant for both ID8 and SKOV3ip.1 cells, resulting in a greater than 150-fold increase in migration relative to SF medium controls. To ensure that these results are not specific to omenta harvested from CD1 mice, conditioned SF media from B6 and Nude mouse omenta were also tested in their ability to promote ID8 and SKOV3ip.1 cell migration. Conditioned SF media prepared from B6 and Nude mouse omenta were a strong chemoattractant for ID8 cells (Figure 3C), stimulating migration on par with CD1-conditioned medium (Figure 3B). Consistent with this finding, B6 and Nude conditioned SF media also stimulated equivalent levels of migration in SKOV3ip.1 cells. Interestingly, SKOV3ip.1 cells showed a consistently lower level of migration than ID8 cells in response to medium conditioned by omenta from CD1, B6, and Nude mice. Taken together, these experiments showed that intact omental tissue can be used as a starting point for efforts to identify the secreted factor or factors that promote ovarian cancer cell homing to omental tissues.
Milky Spot–Containing Tissues Show Enhanced Ability to Stimulate Directed Migration
Nieman et al45 showed that adipocytes cultured in vitro secreted cytokines that can promote migration of SKOV3ip.1 ovarian cancer cells. This raised the possibility that migration of cancer cells toward omentum-conditioned medium could be a strictly adipose-driven process. If that were the case, medium conditioned by adipose tissue lacking milky spots should promote migration of ovarian cancer cells to the same extent as medium conditioned by milky spot–containing adipose tissue. Alternatively, if milky spots play a key role in organ-specific homing, conditioned medium from tissues containing milky spots should have an enhanced ability to promote migration.
To distinguish between these possibilities, conditioned SF medium prepared using weight-matched tissue equivalents of omentum, splenoportal fat, uterine fat, and mesentery was used as a chemoattractant in Transwell migration assays. Tissues did not show loss of integrity or function for the duration of the migration assay; however, IL-6 production of the cultured uterine fat dropped significantly at 3 days in culture (Supplemental Figure S1). The migration-promoting activity of conditioned SF medium prepared from each of these tissues is summarized in Figure 3D. The medium conditioned by omenta or by splenoportal fat caused a 95-fold increase in cell migration, compared with control SF medium. In contrast, the absence of milky spots in uterine fat and mesentery corresponded with a 75% reduction in the migration-stimulatory activity in their conditioned medium (Figure 3D). Taken together, these functional studies bridge the adipocyte-driven and milky spot–driven models and argue that the presence of milky spots increases the chemoattractive potential of peritoneal fat depots.
The Number and Size of Omental Milky Spots Is Not Dependent on the Mouse Genetic Background
Immune cells, including macrophages, lymphocytes, and mast cells, are integral to both the composition and function of omental milky spots.29,34,37,39 There is a common view that omenta from immunodeficient mice will either have no milky spots or significantly fewer milky spots than omenta from immunocompetant mice. To test this notion, we sought to quantitate the number and/or size of milky spots in omenta from a panel of immunodeficient mice. The majority of published studies use two standard methods to identify milky spots. The first uses a nonspecific esterase stain, which colors macrophages and T-lymphocytes dark red.29 In our hands, this method yielded highly variable results that were not of sufficient quality or resolution for quantitative analyses (data not shown). The second method uses intraperitoneal injection of a carbon nanopowder suspension, which is phagocytosed by peritoneal macrophages over a period of days and thus highlights milky spots.29 Tissues are subsequently harvested, whole-mounted, and the number and/or area of the black-staining macrophages are used as a measure of milky spot number and size. When this method works correctly, the milky spot structures are crisp and well defined, and they can be visualized and counted under light microscopy (Figure 4A). Nonetheless, this technique can give inconsistent results, because carbon plaques often form on various peritoneal surfaces (Figure 4B). This plaque formation prevents both precise isolation (excision) of the omentum and accurate evaluation of milky spot area in the whole-mounted tissue.
Figure 4.

An alternative protocol for labeling milky spots in mouse omenta. A: A rare example of a whole mount of a B6 omentum with clear milky spot labeling after carbon staining. B: A more typical case of a B6 omentum ineffectively stained, with several carbon plaques (arrows) obstructing milky spot visualization. C: As an alternative to carbon labeling, we developed a method in which naïve mouse omenta were paraffin-embedded, sectioned at 4 μm, and stained with Giemsa. Dark staining regions indicate dense areas of immune aggregates. D: Image of omental tissue section stained with Giemsa. Milky spots are indicated with arrowheads. E: Image of omental tissue section adjacent to that shown in panel D, stained with H&E. F: Image of omental tissue section adjacent to that shown in panel E, evaluated by IHC using anti-CD45 antibody to identify lymphocytes within the milky spot structure. G: Mask of the omentum section shown in panel C, processed so that milky spots are specifically converted to pure black pixels. H: Mask of the omentum section shown in panel C, processed so that the entire area of the omentum is converted to pure black pixels. Scale bars: 1.0 mm (A–C, G, and H); 100 μm (D–F).
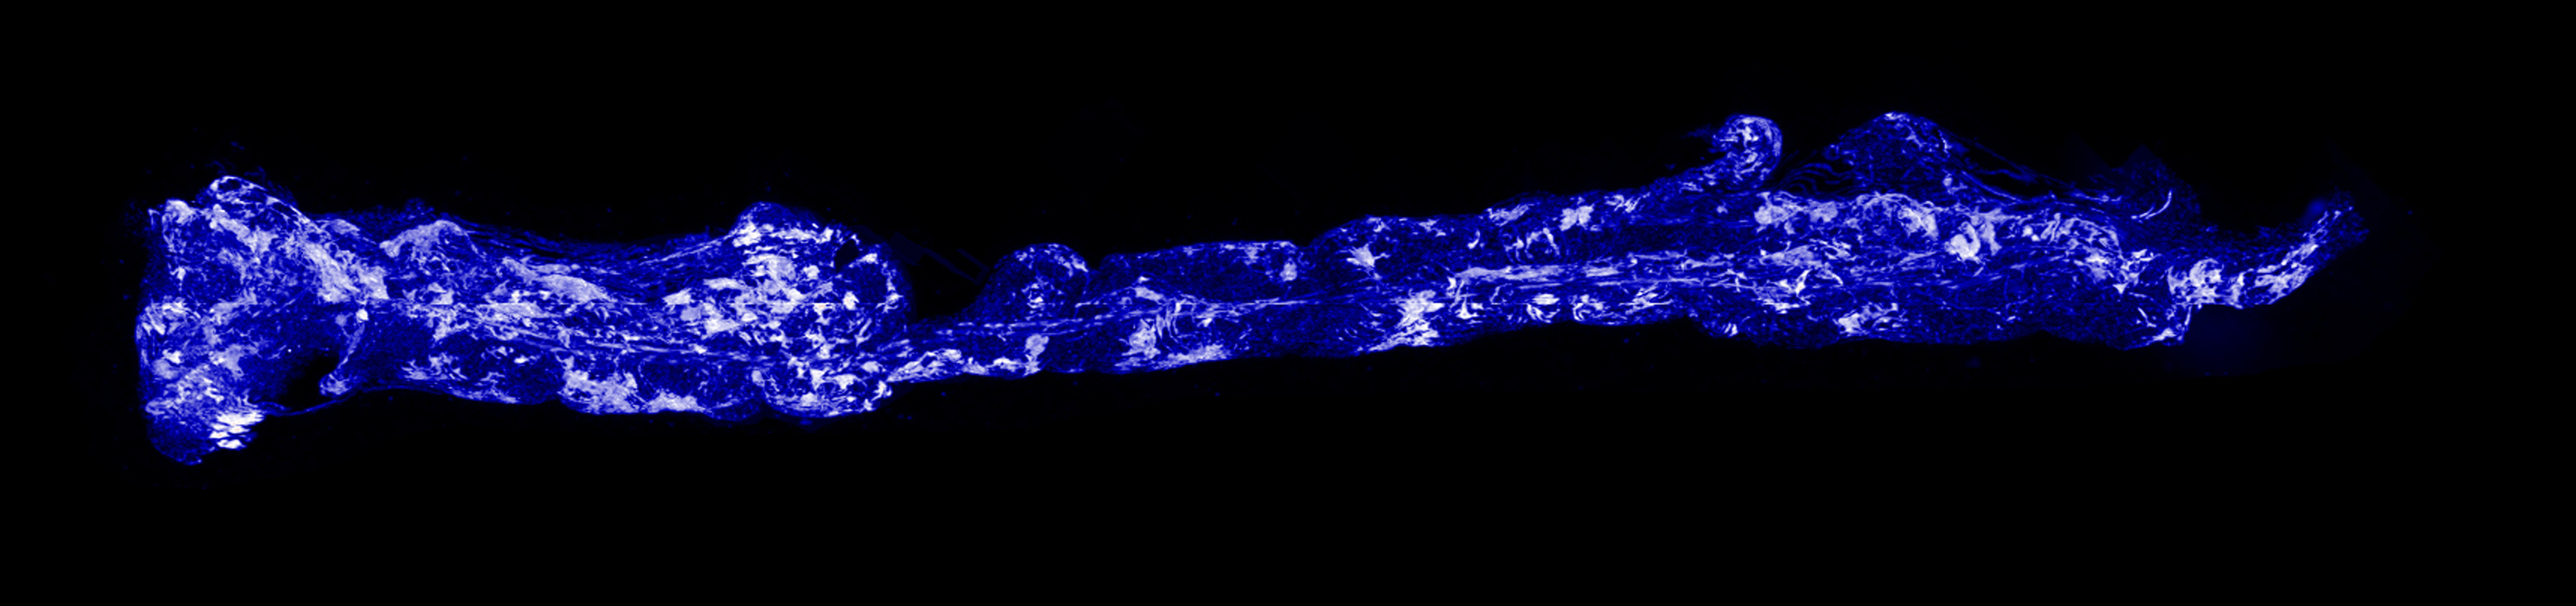
To circumvent this difficulty, we developed a novel technique to visualize the milky spots on a whole-mount scale using Giemsa staining. In this approach, excised omenta were paraffin-embedded and the entire organ was serially sectioned at 4 μm (resulting in approximately 30 to 60 sections). Every third section was stained in a 5% Giemsa solution, and images of the stained tissues were captured using a CRi Pannoramic Scan Whole Slide Scanner (Figure 4C). Milky spots appear as regions staining dark blue (Figure 4D). The identity of these regions as milky spots was confirmed in serial sections by both H&E staining and IHC for cells positive for CD45, a common lymphocyte marker (Figure 4, E and F, respectively). Milky spots from B6, Nude, Rag1, Igh6, and BN XID mice were successfully stained with Giemsa using this method (Supplemental Figure S2). By stacking and aligning all of the Giemsa-stained images from one omentum, we were able to produce a three-dimensional rendering of a mouse omentum that accurately depicts the tissue architecture and presents a novel view of the location and structure of milky spots (Supplemental Video S1).
We used ImageJ software to process the Giemsa-stained omentum slices to produce images that display both milky spots (Figure 4G) and the whole omentum area (Figure 4H) as pure black pixels. (The processing steps are detailed under Materials and Methods.) These black pixels were quantified using the Analyze Particles function of ImageJ software, producing a milky spot area and a whole omentum area for each slice. For each omentum, the milky spot and whole omentum areas were summed for all sections and the result was multiplied by 4 μm (the section thickness), yielding milky spot and total volume for each omentum. Surprisingly, we found no difference in the milky spot volumes (Figure 5A) or the omentum volumes (Figure 5B) for the five mouse strains. Furthermore, no significant difference was found when the milky spot volume was expressed as a percentage of the total omentum area (Figure 5C). We therefore conclude that there is no significant difference in the milky spot volume in omenta from C57BL/6, Nude, Rag1, Igh6, and BN XID mice.
Figure 5.
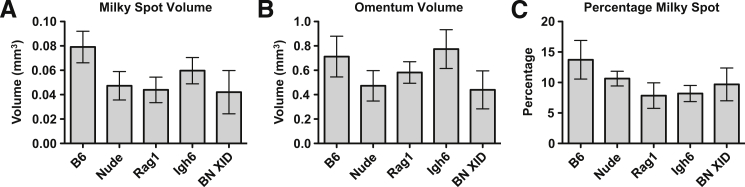
The milky spot volume of the omentum is not affected by the immune status of the host. Giemsa-stained sections of omenta harvested from B6, Nude, Rag1, Igh6, and BN XID mice were processed, sectioned, Giemsa stained, and imaged to determine the area of milky spots and the whole omenta area on each section. A: Milky spot volume per omentum, calculated by multiplying the area of each section by 4 μm and summing the sections. B: Total volume of the whole omentum. C: Milky spot volume as a percentage of the total omentum volume. For each mouse strain, milky spot and omental volumes were determined for five independent animals. No measurements differed statistically among any of the mouse strains (one-way analysis of variance). Data are expressed as means ± SEM.
In vivo colonization of omental milky spots by ovarian cancer cells is not dependent on their immune cell composition. As a first step toward understanding the effect of the immune cell composition of milky spot structures on ovarian cancer cell colonization, experimental metastasis assays were performed using immunocompetent (B6) and immunodeficient (Igh6, Nude, Rag1, and BN XID) mice. Specifically, 1 × 10⁶ ID8 ovarian cancer cells were injected intraperitoneally into mice of each of the five different strains. Cancer cell foci were observed within milky spots in each of these mouse strains at 7 dpi (Figure 6A) and were confirmed to be epithelial via positive staining for mouse cytokeratin 8/18. To determine whether the missing immune-cell types in the various immunodeficient mice alters cancer localization to milky spots, DAB area was quantified in cytokeratin 8/18–stained sections. ID8 cancer cells colonized omenta from each strain to a statistically equivalent degree (Figure 6B). In parallel, 1 × 10⁶ SKOV3ip.1 human ovarian cancer cells were injected into Nude, Rag1, and BN XID mice, and cancer foci were again observed in each mouse strain (Figure 6C). SKOV3ip.1 lesions were stained for human pancytokeratin and found to be cytokeratin-positive. Thus, ovarian cancer cell colonization of omental milky spots is not affected by deficiency or absence of T cells, B cells, and/or NK cells in these mouse strains.
Figure 6.

Colonization of omental milky spots by ovarian cancer cells is not dependent on the immune status of the host. To test the possibility that the immune composition of the milky spots has a quantitative effect on ovarian cancer cell colonization, mice with deficiencies in T cells, B cells, and/or NK cells were injected intraperitoneally with either PBS (control) or 1 × 10⁶ ovarian cancer cells. A: B6, Igh6, Nude, Rag1, and BN XID mice were injected with mouse ID8 cells (syngeneic to B6 background). Omenta were collected at 7 dpi and stained with H&E. Cancer cell foci are outlined. Immunohistochemistry (IHC) against mouse cytokeratin 8/18 (CK8/18) was used to confirm the epithelial origin of the cancer cell foci. B: DAB staining area was used as an indicator of cancer cell burden in omental tissues. Values were calculated as the percentage of area with strong plus medium intensity of cytokeratin 8/18 (DAB) staining, normalized to total stained area of the slide. C: Human SKOV3ip.1 cells were injected into Nude, Rag1, and BN XID mice. Omenta were collected at 7 dpi and stained with H&E. IHC against human pancytokeratin was used to confirm the epithelial origin of cancer cell lesions. Samples from five independent animals were evaluated for each condition of each test. Data are expressed as means ± SEM. Original magnification: ×200.
During Progressive Growth, Ovarian Cancer Cells Replace Omental Adipose
Mechanistic studies by Nieman et al45 indicated that ovarian cancer cells can use adipocytes as an energy source for tumor growth. If this holds true in vivo, we predicted that as cancer cells proliferate they interact with and consume adipocyte lipids. The ultimate outcome of this inverse relationship between cancer cell area and adipocyte area would be that, at the experimental endpoint, the omental adipose would be replaced completely with cancerous tissue. To test this notion, 1 × 10⁶ ID8 ovarian cancer cells were injected intraperitoneally into a cohort of B6 mice. Groups of five mice were euthanized and tissues were collected for histological analysis at 1, 3, 6, and 9 weeks after injection (Figure 7A). Consistent with an inverse relationship between ovarian cancer cell growth and adipocyte depletion, there was a marked reduction in the adipocyte area over time. To quantify this change, we used a pixel-based image processing protocol similar to milky spot quantification (detailed under Materials and Methods) to calculate the adipocyte area in omenta over time. This showed a linear decrease in the percentage of adipocytes in the omentum, corresponding to the expansion of ID8 cancer cell lesions (Figure 7B). These data are consistent with cancer cell utilization of lipids stored in adipocytes as an energy source for their continued growth.
Figure 7.

Adipocyte area of the omentum decreases during the time course of ovarian cancer growth. A: A representative H&E-stained section of an omentum from a naïve B6 mouse. Milky spots are seen within adipose at the tissue periphery. Images are representative of omental tissues harvested from B6 mice at 1, 3, 6, and 9 weeks after injection. B: Quantitation of adipocyte area from H&E images; the percent adipocyte area was normalized to the whole omental area. Data are expressed as means ± SEM (n = 5 independent animals per time point). A linear regression of the data points indicates a slope significantly deviant from zero (P < 0.0001; R2 = 0.8145) Original magnification: ×50.
Discussion
There is now considerable literature on the structure and function of milky spots in both the omentum and extraomental sites. Beginning in the 1970s, investigators noted that ascites tumors have a proclivity for these structures,41 and subsequent studies have confirmed and refined these findings.3,6,40 The strength of this work is that it implies a functional role for milky spots in the early steps of omental colonization. The weakness of the milky spot–driven model is the fact that the studies on which it is based do not consider the potential contributions of adipocytes and other cells within the omentum. Although the failure to consider the contribution of omental adipose in cancer metastasis is consistent with the now-antiquated view of adipocytes as an inert component of connective tissues,14,19,20 it is a fundamental oversight that must be addressed if we are to understand the organ specificity of ovarian cancer cells.
The adipocyte-driven model was prompted by the findings of Nieman et al,45 who showed that in omental metastases the ovarian cancer cells at the interface with adipocytes contain abundant lipids. Their in vitro studies showed that the adipocytes transfer to ovarian cancer cells lipid droplets containing fatty acids,45 which can be used as an energy source. The strength of their studies is that they focused on human ovarian cancers and identified a novel function for adipocytes in the progressive growth of ovarian cancer lesions, and the weakness lies in the effort to show that adipocytes drive, and are solely responsible for, early steps in omental colonization. The case for adipose as the sole determinant of the organotropic metastasis of ovarian cancer is based on an incomplete examination of the literature and on a biased approach to experimental design. As a result of the focus on adipocytes, important clues in the data were overlooked, and the potential contributions of milky spots, vasculature, or other unique characteristics of the omentum were neither tested nor discussed. Thus, like the milky spot–driven model, the adipocyte-driven model also is limited by the narrow focus of the studies on which it is based.
Despite their strengths, neither the milky spot–driven nor the adipocyte-driven model addresses the intimate and dynamic interactions among milky spot structures, adipocytes, and other omental components. Integration of these two models requires a fresh look from a different perspective. Thus, rather than taking the more traditional omentum-focused approaches, we sought to understand why ovarian cancers do not colonize other sources of peritoneal fat as extensively as they do the omentum. This led to our novel strategy of comparing colonization of peritoneal adipose that either contains or lacks milky spots. The report by Takemori et al46 showing the presence of milky spots in the splenoportal fat of New Zealand Black mice was key to our approach. To our knowledge, the splenoportal fat band has not been studied in other mouse strains, nor has its colonization by any type of cancer cells been examined previously. Our in vivo studies using a panel of ovarian cancer cell lines (ID8, SKOV3ip.1, CaOV3, and HeyA8) yielded the most comprehensive assessment of ovarian cancer cell lodging in peritoneal adipose and provided clear data showing that milky spots dramatically enhance early cancer cell lodging.
To dissect the mechanism or mechanisms by which milky spots promote colonization, we made use of the observation that, after intraperitoneal injection, ovarian cancer cells rapidly localize to omental milky spots, which suggests involvement of one or more tissue-secreted factors. Development of a quantitative Transwell migration approach (Figure 3) enabled us to assess the ability of fat tissue–conditioned medium to stimulate directed migration of ovarian cancer cells. Although milky spot–deficient tissues (uterine fat, gonadal fat, and mesentery) secrete one or more factors that promote directed migration, results from in vivo assays indicate that this signal is not sufficient for ovarian cancer cells to achieve the high level (both in number and size) of foci formation that is seen in the omentum and splenoportal fat. This suggests that colonization requires additional chemotactic signals and/or tissue structures. In support of this notion, our in vivo assays showed that ovarian cancer cells efficiently colonize milky spots in the omentum and splenoportal fat. In addition, using medium conditioned by milky spot–containing adipose yielded the novel finding that the presence of these structures caused a significant enhancement in the ability of the medium to promote directed cancer migration.
Although milky spot structures comprise a number of cell types, their importance in multiple facets of immune defense prompted us to ask what effect the host immune status has on the number of milky spots or on their ability to be colonized by cancer cells. Ostensibly, it would seem that immunodeficient mice would have fewer or smaller milky spots (because of their immunodeficiency) and that these structures would therefore be poorly colonized by cancer cells. Use of a novel virtual whole-mount technique enabled the quantitation of milky spot volume for the first time in various mouse strains. These data showed that the immune status of the host affects neither milky spot volume (in naïve omenta) nor its colonization by cancer cells (cancer burden) after intraperitoneal injection. Finally, the role of adipocytes in supplying energy for cancer cell growth is supported by the direct relationship between cancer cell growth and adipocyte depletion. Interestingly, this finding is in accord with breast cancer models in which cancer growth causes a reduction in adipocyte number and size (reducing the ratio of adipocyte-to-cancer area), implying lipolysis and possible adipocyte dedifferentiation.50
A large body of evidence has established the critical importance of milky spots to ovarian cancer cell lodging and initial colonization of peritoneal adipose3,6,24,28,40–44 and provides a foundation for studies to identify milky spot components involved in cancer cell homing and invasion. As a first step toward this goal, the use of immunodeficient mouse strains allowed us to rule out a requirement for B cells, T cells, or NK cells for ovarian cancer cell lodging within milky spots, thus confirming and expanding on the findings of Lotan et al.8 Previous studies have shown that mast cells and macrophages are frequently observed in the milky spots.30,33,34,36 Macrophages are an intriguing candidate, because they have been shown to assist the survival and growth of established tumors.51–53 Furthermore, the depletion of peritoneal macrophages has been shown to decrease ovarian cancer tumor burden on the diaphragm at the experimental endpoint.54 Milky spot macrophages are thus possible contributors to the rapid and specific colonization of omental milky spots. Another possible source of the chemotactic properties of the omentum is the abundance of endothelial cells found in the milky spots. The vessels within the dense and tangled capillary bed of the milky spots have been shown to undergo a constitutive level of active vascular remodeling.28,42 The activated endothelial cells associated with angiogenic vessels are known to support and promote metastatic disease.55,56 Either or both of those cell types could be responsible for the prolific omental metastases and warrant further study.
The growing emphasis on the role of the host tissue microenvironment in metastasis formation stems from the seminal work of Stephen Paget, who in 1889 showed that certain tumor cells (metaphorically thought of as the seed) have a proclivity for specific organ microenvironments (the soil).57–59 A powerful but often underappreciated aspect of studies by Paget and other pioneers of metastasis research was their innate appreciation of the unique tissue architecture, physiology, and function of the target organ that is essential to understanding metastatic organ specificity.60–63 With our present studies, we have sought to integrate milky spot and adipocyte function in the omentum.
We propose a two-step model for omental colonization in which the localization of disseminated cancer cells is dependent on milky spots. Adipocytes are then required for progressive growth and subsequent spread of cancer cells to other sites within the peritoneal cavity. This model is likely a more accurate representation of the overall process of ovarian metastatic colonization. It is our hope that both our findings and our discussion of the larger literature will serve as a framework for studies that will continue to refine our understanding of omental colonization. Ultimately, it is our goal to use this information to extend the duration of metastatic suppression and significantly increase the quality of life for patients diagnosed with ovarian cancer.
Acknowledgments
We thank Mr. Nathan Stadick for his critical review of the literature, which contributed to the scholarship of the manuscript, Dr. Erin Howe for her review and comments, which greatly enhanced the discussion of our results, Shirley Bond and Dr. Christine Labno (University of Chicago Integrated Microscopy Core Facility) for their assistance and expertise in the capturing and quantification of the omentum images, and Terri Lee and Christy Schmehl (University of Chicago Human Tissue Resource Center) for sectioning and staining of tissue samples.
The TROMA-1 hybridoma was developed by Philippe Brulet and Rolf Kemler and was obtained from the Developmental Studies Hybridoma Bank (established under the auspices of the NIH National Institute of Child Health and Human Development and maintained by the University of Iowa Department of Biology).
Footnotes
Supported by grants from the Department of Defense (W81XWH-09-1-0127) (C.R.-S. and R.C.), the NIH (2-R01-CA089569) (C.R.-S. and M.S.), the Elsa U. Pardee Foundation (C.R.-S.), a Marsha Rivkin Center for Ovarian Cancer Research Pilot Study Award (C.R.-S. and V.K.), and funds from the Section of Urology, University of Chicago.
R.C. and V.K. contributed equally to this work.
Current address of M.S. and I.R., Department of Natural Sciences, Stanford University, Stanford, CA.
Supplemental Data
The ex vivo culture of peritoneal fat. B6 omenta, splenoportal fat, uterine fat, and mesentery were excised, sectioned, and stained with H&E. Tissue equivalents of the same tissues were excised and cultured for 24 hours in SF DMEM/F-12 medium after a 24-hour culture in DMEM/F-12 medium with 20% fetal calf serum. Cultured tissue was then sectioned and stained with H&E. IL-6 ELISA of SF DMEM/F-12 medium conditioned by explant cultured peritoneal fat. Tissue equivalents were excised and cultured in 20% fetal calf serum DMEM/F-12 medium for 24 hours. At subsequent 24-hour intervals, culture medium was changed to fresh SF DMEM/F-12 medium (such that the tissues were fed for the first 24 hours and starved for the remaining 120 hours of the assay). IL-6 was assayed in conditioned medium from each 24-hour interval using an ELISA. *P < 0.05, **P < 0.01, and ***P < 0.001. Original magnification: ×20.
Specific labeling of milky spots by Giemsa stain in immunodeficient mice. Omenta from naïve C57BL/6, Nude, Rag1, Igh6, and BN XID mice were excised, sectioned, and stained with Giemsa. The whole-tissue images show distribution of milky spots in the omentum; the micrographs show detail of Giemsa-stained immune aggregates. Original magnification: ×20.
Three-dimensional rendering of mouse omentum. Giemsa stained sections of a naïve B6 omentum were stacked, aligned, and projected into a three-dimensional rendering of the whole tissue. This false-colored image depicts milky spots as white and stromal architecture as blue.
References
- 1.Naora H., Montell D.J. Ovarian cancer metastasis: integrating insights from disparate model organisms. Nat Rev Cancer. 2005;5:355–366. doi: 10.1038/nrc1611. [DOI] [PubMed] [Google Scholar]
- 2.Cinti S. The adipose organ. In: Fantuzzi G., Mazzone T., editors. Adipose Tissue and Adipokines in Health and Disease. Humana Press; Totowa, NJ: 2007. pp. 3–19. [Google Scholar]
- 3.Hagiwara A., Takahashi T., Sawai K., Taniguchi H., Shimotsuma M., Okano S., Sakakura C., Tsujimoto H., Osaki K., Sasaki S., Shirasu M. Milky spots as the implantation site for malignant cells in peritoneal dissemination in mice. Cancer Res. 1993;53:687–692. [PubMed] [Google Scholar]
- 4.Roby K.F., Taylor C.C., Sweetwood J.P., Cheng Y., Pace J.L., Tawfik O., Persons D.L., Smith P.G., Terranova P.F. Development of a syngeneic mouse model for events related to ovarian cancer. Carcinogenesis. 2000;21:585–591. doi: 10.1093/carcin/21.4.585. [DOI] [PubMed] [Google Scholar]
- 5.Lengyel E. Ovarian cancer development and metastasis. The Am J Pathol. 2010;177:1053–1064. doi: 10.2353/ajpath.2010.100105. [DOI] [PMC free article] [PubMed] [Google Scholar]
- 6.Khan S.M., Funk H.M., Thiolloy S., Lotan T.L., Hickson J., Prins G.S., Drew A.F., Rinker-Schaeffer C.W. In vitro metastatic colonization of human ovarian cancer cells to the omentum. Clin Exp Metastasis. 2010;27:185–196. doi: 10.1007/s10585-010-9317-0. [DOI] [PubMed] [Google Scholar]
- 7.Kenny H.A., Krausz T., Yamada S.D., Lengyel E. Use of a novel 3D culture model to elucidate the role of mesothelial cells, fibroblasts and extra-cellular matrices on adhesion and invasion of ovarian cancer cells to the omentum. Int J Cancer. 2007;121:1463–1472. doi: 10.1002/ijc.22874. [DOI] [PubMed] [Google Scholar]
- 8.Lotan T., Hickson J., Souris J., Huo D., Taylor J., Li T., Otto K., Yamada S.D., Macleod K., Rinker-Schaeffer C.W. c-Jun NH2-terminal kinase activating kinase 1/mitogen-activated protein kinase kinase 4-mediated inhibition of SKOV3ip.1 ovarian cancer metastasis involves growth arrest and p21 up-regulation. Cancer Res. 2008;68:2166–2175. doi: 10.1158/0008-5472.CAN-07-1568. [DOI] [PMC free article] [PubMed] [Google Scholar]
- 9.Liebermann-Meffert D. The greater omentum. Anatomy, embryology, and surgical applications. Surg Clin North Am. 2000;80:275–293. doi: 10.1016/s0039-6109(05)70406-0. xii. [DOI] [PubMed] [Google Scholar]
- 10.Collins D., Hogan A.M., O’Shea D., Winter D.C. The omentum: anatomical, metabolic, and surgical aspects. J Gastrointest Surg. 2009;13:1138–1146. doi: 10.1007/s11605-009-0855-1. [DOI] [PubMed] [Google Scholar]
- 11.Platell C., Cooper D., Papadimitriou J.M., Hall J.C. The omentum. World J Gastroenterol. 2000;6:169–176. doi: 10.3748/wjg.v6.i2.169. [DOI] [PMC free article] [PubMed] [Google Scholar]
- 12.Goldsmith H.S., editor. The Omentum: Research and Clinical Application. 1st ed. Springer Verlag; New York: 1990. [Google Scholar]
- 13.Wilkosz S., Ireland G., Khwaja N., Walker M., Butt R., de Giorgio-Miller A., Herrick S.E. A comparative study of the structure of human and murine greater omentum. Anat Embryol (Berl) 2005;209:251–261. doi: 10.1007/s00429-004-0446-6. [DOI] [PubMed] [Google Scholar]
- 14.Wozniak S.E., Gee L.L., Wachtel M.S., Frezza E.E. Adipose tissue: the new endocrine organ? A review article. Dig Dis Sci. 2008;54:1847–1856. doi: 10.1007/s10620-008-0585-3. [DOI] [PubMed] [Google Scholar]
- 15.Trayhurn P., Beattie J.H. Physiological role of adipose tissue: white adipose tissue as an endocrine and secretory organ. Proc Nutr Soc. 2001;60:329–339. doi: 10.1079/pns200194. [DOI] [PubMed] [Google Scholar]
- 16.Hauner H. The new concept of adipose tissue function. Physiol Behav. 2004;83:653–658. doi: 10.1016/j.physbeh.2004.09.016. [DOI] [PubMed] [Google Scholar]
- 17.Scherer P.E. Adipose tissue: from lipid storage compartment to endocrine organ. Diabetes. 2006;55:1537–1545. doi: 10.2337/db06-0263. [DOI] [PubMed] [Google Scholar]
- 18.Kershaw E.E., Flier J.S. Adipose tissue as an endocrine organ. J Clin Endocrinol Metab. 2004;89:2548–2556. doi: 10.1210/jc.2004-0395. [DOI] [PubMed] [Google Scholar]
- 19.Wang P., Mariman E., Renes J., Keijer J. The secretory function of adipocytes in the physiology of white adipose tissue. J Cell Physiol. 2008;216:3–13. doi: 10.1002/jcp.21386. [DOI] [PubMed] [Google Scholar]
- 20.Conde J., Scotece M., Gómez R., López V., Gómez-Reino J.J., Lago F., Gualillo O. Adipokines: biofactors from white adipose tissue. A complex hub among inflammation, metabolism, and immunity. Biofactors. 2011;37:413–420. doi: 10.1002/biof.185. [DOI] [PubMed] [Google Scholar]
- 21.Frühbeck G., Gómez-Ambrosi J., Muruzábal F.J., Burrell M.A. The adipocyte: a model for integration of endocrine and metabolic signaling in energy metabolism regulation. Am J Physiol Endocrinol Metab. 2001;280:E827–E847. doi: 10.1152/ajpendo.2001.280.6.E827. [DOI] [PubMed] [Google Scholar]
- 22.Tilg H., Moschen A.R. Adipocytokines: mediators linking adipose tissue, inflammation and immunity. Nat Rev Immunol. 2006;6:772–783. doi: 10.1038/nri1937. [DOI] [PubMed] [Google Scholar]
- 23.Rajala M.W., Scherer P.E. Minireview: the adipocyte–at the crossroads of energy homeostasis, inflammation, and atherosclerosis. Endocrinology. 2003;144:3765–3773. doi: 10.1210/en.2003-0580. [DOI] [PubMed] [Google Scholar]
- 24.Michailova K.N., Usunoff K.G. The milky spots of the peritoneum and pleura: structure, development and pathology. Biomed Rev. 2004;15:47–66. [Google Scholar]
- 25.Simer P.H. On the morphology of the omentum, with especial reference to its lymphatics. Am J Anat. 1934;54:203–228. [Google Scholar]
- 26.Ackermann P.C., De Wet P.D., Loots G.P. Microcirculation of the rat omentum studied by means of corrosion casts. Acta Anat (Basel) 1991;140:146–149. doi: 10.1159/000147051. [DOI] [PubMed] [Google Scholar]
- 27.Shimotsuma M., Shields J., Simpson-Morgan M., Sakuyama A., Shirasu M., Hagiwara A., Takahashi T. Morpho-physiological function and role of omental milky spots as omentum-associated lymphoid tissue (OALT) in the peritoneal cavity. Lymphology. 1993;26:90–101. [PubMed] [Google Scholar]
- 28.Gerber S.A., Rybalko V.Y., Bigelow C.E., Lugade A.A., Foster T.H., Frelinger J.G., Lord E.M. Preferential attachment of peritoneal tumor metastases to omental immune aggregates and possible role of a unique vascular microenvironment in metastatic survival and growth. Am J Pathol. 2006;169:1739–1752. doi: 10.2353/ajpath.2006.051222. [DOI] [PMC free article] [PubMed] [Google Scholar]
- 29.Shimotsuma M., Kawata M., Hagiwara A., Takahashi T. Milky spots in the human greater omentum. Macroscopic and histological identification. Acta Anat (Basel) 1989;136:211–216. doi: 10.1159/000146888. [DOI] [PubMed] [Google Scholar]
- 30.Shimotsuma M., Simpson-Morgan M.W., Takahashi T., Hagiwara A. Activation of omental milky spots and milky spot macrophages by intraperitoneal administration of a streptococcal preparation, OK-432. Cancer Res. 1992;52:5400–5402. [PubMed] [Google Scholar]
- 31.Litbarg N.O., Gudehithlu K.P., Sethupathi P., Arruda J.A.L., Dunea G., Singh A.K. Activated omentum becomes rich in factors that promote healing and tissue regeneration. Cell Tissue Res. 2007;328:487–497. doi: 10.1007/s00441-006-0356-4. [DOI] [PubMed] [Google Scholar]
- 32.Rangel-Moreno J., Moyron-Quiroz J.E., Carragher D.M., Kusser K., Hartson L., Moquin A., Randall T.D. Omental milky spots develop in the absence of lymphoid tissue-inducer cells and support B and T cell responses to peritoneal antigens. Immunity. 2009;30:731–743. doi: 10.1016/j.immuni.2009.03.014. [DOI] [PMC free article] [PubMed] [Google Scholar]
- 33.Wijffels J.F., Hendrickx R.J., Steenbergen J.J., Eestermans I.L., Beelen R.H. Milky spots in the mouse omentum may play an important role in the origin of peritoneal macrophages. Res Immunol. 1992;143:401–409. doi: 10.1016/s0923-2494(05)80072-0. [DOI] [PubMed] [Google Scholar]
- 34.Shimotsuma M., Takahashi T., Kawata M., Dux K. Cellular subsets of the milky spots in the human greater omentum. Cell Tissue Res. 1991;264:599–601. doi: 10.1007/BF00319049. [DOI] [PubMed] [Google Scholar]
- 35.Cranshaw M.L., Leak L.V. Milky spots of the omentum: a source of peritoneal cells in the normal and stimulated animal. Arch Histol Cytol. 1990;53 Suppl:165–177. doi: 10.1679/aohc.53.suppl_165. [DOI] [PubMed] [Google Scholar]
- 36.Beelen R.H., Fluitsma D.M., Hoefsmit E.C. The cellular composition of omentum milky spots and the ultrastructure of milky spot macrophages and reticulum cells. J Reticuloendothel Soc. 1980;28:585–599. [PubMed] [Google Scholar]
- 37.Krist L.F., Eestermans I.L., Steenbergen J.J., Hoefsmit E.C., Cuesta M.A., Meyer S., Beelen R.H. Cellular composition of milky spots in the human greater omentum: an immunochemical and ultrastructural study. Anat Rec. 1995;241:163–174. doi: 10.1002/ar.1092410204. [DOI] [PubMed] [Google Scholar]
- 38.Mironov V.A., Gusev S.A., Baradi A.F. Mesothelial stomata overlying omental milky spots: scanning electron microscopic study. Cell Tissue Res. 1979;201:327–330. doi: 10.1007/BF00235068. [DOI] [PubMed] [Google Scholar]
- 39.Dux K., Janik P., Szaniawska B. Kinetics of proliferation, cell differentiation, and IgM secretion in the omental lymphoid organ of B10/Sn mice following intraperitoneal immunization with sheep erythrocytes. Cell Immunol. 1977;32:97–109. [Google Scholar]
- 40.Krist L.F., Kerremans M., Broekhuis-Fluitsma D.M., Eestermans I.L., Meyer S., Beelen R.H. Milky spots in the greater omentum are predominant sites of local tumour cell proliferation and accumulation in the peritoneal cavity. Cancer Immunol Immunother. 1998;47:205–212. doi: 10.1007/s002620050522. [DOI] [PMC free article] [PubMed] [Google Scholar]
- 41.Green J.A., Williams A.E. The relationship between inflammatory responses and WBP1 tumour cell attachment to the rat omentum. Eur J Cancer. 1978;14:1153–1155. doi: 10.1016/0014-2964(78)90072-5. [DOI] [PubMed] [Google Scholar]
- 42.Sorensen E.W., Gerber S.A., Sedlacek A.L., Rybalko V.Y., Chan W.M., Lord E.M. Omental immune aggregates and tumor metastasis within the peritoneal cavity. Immunol Res. 2009;45:185–194. doi: 10.1007/s12026-009-8100-2. [DOI] [PMC free article] [PubMed] [Google Scholar]
- 43.Tsujimoto H., Takhashi T., Hagiwara A., Shimotsuma M., Sakakura C., Osaki K., Sasaki S., Shirasu M., Sakakibara T., Ohyama T. Site-specific implantation in the milky spots of malignant cells in peritoneal dissemination: immunohistochemical observation in mice inoculated intraperitoneally with bromodeoxyuridine-labelled cells. Br J Cancer. 1995;71:468–472. doi: 10.1038/bjc.1995.95. [DOI] [PMC free article] [PubMed] [Google Scholar]
- 44.Tsujimoto H., Hagiwara A., Shimotsuma M., Sakakura C., Osaki K., Sasaki S., Ohyama T., Ohgaki M., Imanishi T., Yamazaki J., Takahashi T. Role of milky spots as selective implantation sites for malignant cells in peritoneal dissemination in mice. J Cancer Res Clin Oncol. 1996;122:590–595. doi: 10.1007/BF01221190. [DOI] [PMC free article] [PubMed] [Google Scholar]
- 45.Nieman K.M., Kenny H.A., Penicka C.V., Ladanyi A., Buell-Gutbrod R., Zillhardt M.R., Romero I.L., Carey M.S., Mills G.B., Hotamisligil G.S., Yamada S.D., Peter M.E., Gwin K., Lengyel E. Adipocytes promote ovarian cancer metastasis and provide energy for rapid tumor growth. Nat Med. 2011;17:1498–1503. doi: 10.1038/nm.2492. [DOI] [PMC free article] [PubMed] [Google Scholar]
- 46.Takemori N., Hirai K., Onodera R., Saito N., Namiki M. Light and electron microscope study of splenoportal milky spots in New Zealand black mice: comparison between splenoportal milky spots and aberrant spleens. J Anat. 1995;186:287–299. [PMC free article] [PubMed] [Google Scholar]
- 47.Yu D., Wolf J.K., Scanlon M., Price J.E., Hung M.C. Enhanced c-erbB-2/neu expression in human ovarian cancer cells correlates with more severe malignancy that can be suppressed by E1A. Cancer Res. 1993;53:891–898. [PubMed] [Google Scholar]
- 48.Kishimoto T: Interleukin-6 (IL-6). The Cytokine Handbook. 4th ed. Boston, Academic Press, 2003, 1:281–304
- 49.Thévenaz P., Ruttimann U.E., Unser M. A pyramid approach to subpixel registration based on intensity. IEEE Trans Image Process. 1998;7:27–41. doi: 10.1109/83.650848. [DOI] [PubMed] [Google Scholar]
- 50.Dirat B., Bochet L., Dabek M., Daviaud D., Dauvillier S., Majed B., Wang Y.Y., Meulle A., Salles B., Le Gonidec S., Garrido I., Escourrou G., Valet P., Muller C. Cancer-associated adipocytes exhibit an activated phenotype and contribute to breast cancer invasion. Cancer Res. 2011;71:2455–2465. doi: 10.1158/0008-5472.CAN-10-3323. [DOI] [PubMed] [Google Scholar]
- 51.Qian B.Z., Pollard J.W. Macrophage diversity enhances tumor progression and metastasis. Cell. 2010;141:39–51. doi: 10.1016/j.cell.2010.03.014. [DOI] [PMC free article] [PubMed] [Google Scholar]
- 52.Tlsty T.D., Coussens L.M. Tumor stroma and regulation of cancer development. Annu Rev Pathol. 2006;1:119–150. doi: 10.1146/annurev.pathol.1.110304.100224. [DOI] [PubMed] [Google Scholar]
- 53.Coussens L.M., Werb Z. Inflammation and cancer. Nature. 2002;420:860–867. doi: 10.1038/nature01322. [DOI] [PMC free article] [PubMed] [Google Scholar]
- 54.Robinson-Smith T.M., Isaacsohn I., Mercer C.A., Zhou M., Van Rooijen N., Husseinzadeh N., McFarland-Mancini M.M., Drew A.F. Macrophages mediate inflammation-enhanced metastasis of ovarian tumors in mice. Cancer Res. 2007;67:5708–5716. doi: 10.1158/0008-5472.CAN-06-4375. [DOI] [PubMed] [Google Scholar]
- 55.Orr F.W., Wang H.H., Lafrenie R.M., Scherbarth S., Nance D.M. Interactions between cancer cells and the endothelium in metastasis. J Pathol. 2000;190:310–329. doi: 10.1002/(SICI)1096-9896(200002)190:3<310::AID-PATH525>3.0.CO;2-P. [DOI] [PubMed] [Google Scholar]
- 56.Chouaib S., Kieda C., Benlalam H., Noman M.Z., Mami-Chouaib F., Rüegg C. Endothelial cells as key determinants of the tumor microenvironment: interaction with tumor cells, extracellular matrix and immune killer cells. Crit Rev Immunol. 2010;30:529–545. doi: 10.1615/critrevimmunol.v30.i6.30. [DOI] [PubMed] [Google Scholar]
- 57.Paget S. The distribution of secondary growths in cancer of the breast. Lancet. 1889;133:571–573. [reproduced in Cancer Metastasis Rev 1989, 8:98–101] [PubMed] [Google Scholar]
- 58.Kenny P.A., Bissell M.J. Tumor reversion: correction of malignant behavior by microenvironmental cues. Int J Cancer. 2003;107:688–695. doi: 10.1002/ijc.11491. [DOI] [PMC free article] [PubMed] [Google Scholar]
- 59.Bissell M.J., Radisky D.C., Rizki A., Weaver V.M., Petersen O.W. The organizing principle: microenvironmental influences in the normal and malignant breast. Differentiation. 2002;70:537–546. doi: 10.1046/j.1432-0436.2002.700907.x. [DOI] [PMC free article] [PubMed] [Google Scholar]
- 60.Nicolson G.L. Organ specificity of tumor metastasis: role of preferential adhesion, invasion and growth of malignant cells at specific secondary sites. Cancer Metastasis Rev. 1988;7:143–188. doi: 10.1007/BF00046483. [DOI] [PubMed] [Google Scholar]
- 61.Fidler I.J. The pathogenesis of cancer metastasis: the ‘seed and soil’ hypothesis revisited. Nat Rev Cancer. 2003:453–458. doi: 10.1038/nrc1098. [DOI] [PubMed] [Google Scholar]
- 62.Hart I.R., Fidler I.J. Role of organ selectivity in the determination of metastatic patterns of B16 melanoma. Cancer Res. 1980;40:2281–2287. [PubMed] [Google Scholar]
- 63.Sugarbaker E.V. Cancer metastasis: a product of tumor-host interactions. Curr Probl Cancer. 1979;3:1–59. doi: 10.1016/s0147-0272(79)80008-2. [DOI] [PubMed] [Google Scholar]
Associated Data
This section collects any data citations, data availability statements, or supplementary materials included in this article.
Supplementary Materials
The ex vivo culture of peritoneal fat. B6 omenta, splenoportal fat, uterine fat, and mesentery were excised, sectioned, and stained with H&E. Tissue equivalents of the same tissues were excised and cultured for 24 hours in SF DMEM/F-12 medium after a 24-hour culture in DMEM/F-12 medium with 20% fetal calf serum. Cultured tissue was then sectioned and stained with H&E. IL-6 ELISA of SF DMEM/F-12 medium conditioned by explant cultured peritoneal fat. Tissue equivalents were excised and cultured in 20% fetal calf serum DMEM/F-12 medium for 24 hours. At subsequent 24-hour intervals, culture medium was changed to fresh SF DMEM/F-12 medium (such that the tissues were fed for the first 24 hours and starved for the remaining 120 hours of the assay). IL-6 was assayed in conditioned medium from each 24-hour interval using an ELISA. *P < 0.05, **P < 0.01, and ***P < 0.001. Original magnification: ×20.
Specific labeling of milky spots by Giemsa stain in immunodeficient mice. Omenta from naïve C57BL/6, Nude, Rag1, Igh6, and BN XID mice were excised, sectioned, and stained with Giemsa. The whole-tissue images show distribution of milky spots in the omentum; the micrographs show detail of Giemsa-stained immune aggregates. Original magnification: ×20.
Three-dimensional rendering of mouse omentum. Giemsa stained sections of a naïve B6 omentum were stacked, aligned, and projected into a three-dimensional rendering of the whole tissue. This false-colored image depicts milky spots as white and stromal architecture as blue.