

Abstract
Introduction
Increased glucose uptake and glycolysis are main metabolic characteristics of malignant cells. A family of glucose transporters (GLUTs) facilitates glucose movement across the plasma membranes in a tumor-specific manner. Glucose transporter-1 (GLUT-1), GLUT-3 and recently GLUT-12, have been previously shown in breast cancer cells and are found to be associated with poor prognosis. In addition, it has been shown that estrogen plays critical roles in GLUT regulation, however, the stage-specific GLUT regulation of mammary carcinogenesis is unclear.
Methods
GLUT expression patterns were investigated in an in vitro–in vivo progressive, estrogen-induced, mammary carcinogenesis model which consisted of four cell lines, with same genetic background. In this model, different stages of tumor initiation and progression are represented, MCF-10F being the normal stage, E2 cells the transformed stage by estrogen, C5 cells, the invasive stage, and T4 cells the tumorigenic stage. In addition, loss of ductulogenesis and solid mass formation in collagen matrix and invasiveness of the cells were counted.
Results
Real time PCR showed that GLUT1 expression was downregulated in MCF10F after treatment with 17β-estradiol (E2), and in the invasive cell type (C5), but not in the tumor cells (T4), which had no changes compared to MCF10F. C5 and T4 cells showed the highest rate of GLUT-3 expression. These cells were also found to be associated with loss of ductulogenesis, solid mass formation and higher invasive capacity, whereas, GLUT-12 was downregulated in C5 and T4 cells.
Conclusion
Estrogen-induced malignant transformation is associated with remarkable and progressive GLUT-3 expression, GLUT-1 re-expression at further stages, as well as GLUT-12 downregulation.
Keywords: GLUT, Estrogen, Breast Cancer
Introduction
Mammalian cells use a wide variety of plasma-membrane transport systems in order to translocate several substrates into the cell. Apart from the Na+-dependent symport system commonly used by intestinal and renal tubular cells, glucose and the other energy substrates are translocated by passive transport from extracellular space in all the tissues [1]. A family of glucose transporters (GLUTs) facilitates the movement of glucose across the plasma membranes in a tissue-specific manner, dependent on concentration gradient. The properties of glucose transporters differ between tissues, reflecting the function of their monosaccharide metabolism [2]. For example, Glut1 is a main isoform on erythrocytes and brain cell membranes, whereas Glut5 of sarcolemmal membranes are used mainly for fructose transport into skeletal muscle cells [1, 2]. Additionally, liver cells commonly use Glut2 for glucose transportation. So far, 14 different GLUT isoforms are established and classified.
Cancer cells, similar to non-tumoral mammalian cells, utilize glucose as main energy substrate using only these facilitative transport systems (GLUTs) depending on their increased metabolic activity and rapid proliferation [3, 4]. Cellular transformation under several oncogenic stimuli and carcinogenic progression lead to altered substrate metabolism, increased aerobic glycolysis and excessive glucose consumption [5, 6]. This phenomenon was observed for the first time by biochemist Otto Warburg in 1924 [3, 7]. He hypothesized that cancer cells may be caused by increased glycolysis and impaired respiration due to defective mitochondrial function and thus, cancer cells tend to convert most glucose to lactate even in the normoxic conditions. The glycolytic phenotype (or Warburg effect) is not only associated with excessive glucose consumption by overexpression of different Glut isoforms, but also increased activity of enzymes involved in glycolysis [5, 8]. It has been also observed that more advanced tumor stages are associated with more increased glucose uptake. For example, hexokinase and other glycolytic enzymes were found to be higher in metastasis than in primary breast tumors [9].
Especially within the last decade, expression patterns of GLUT isoforms (mostly Glut1–5) have been studied in several tumor cell lines and tumor tissue specimens [4]. Glut1 overexpression has been widely observed in many cancers including breast, lung, renal cell (RCC), colorectal and pancreas carcinoma specimens; some, (mostly Glut1, 3) are being found to be related to metastasis and poor prognosis [4, 10]. Although complete expression patterns of GLUT isoforms have not been evaluated in most cases, diversity of expression types have been appearing in “tumor-specific” manners. For example, Suganuma et al. [9] have studied complete expression patterns in normal and renal tumor tissues and found that normal kidney tissues express all GLUT isoforms, however, in clear cell RCC, Glut1 expression remarkably increased while Glut4, 9, 12 decreased, whereas in chromophobe RCC the expression of Glut4 increased and Glut2, 5 decreased. On an in vitro basis, GLUT expression patterns have been most extensively studied in breast cancer cell lines [4]. Glut1 expression is being consistently observed in all breast tumors, but the expressions of Glut3, 5 and more recently Glut12 have been reported in several cultured breast cancer cells [4, 10–12].
Switching of preinvasive characteristics into invasive tumors or gaining of “invasive” (glycolytic) phenotype have been found to be related to GLUT expressions and alterations during the malignant transformation [6, 13–15]. Tumor hypoxia, another hallmark of malignant progression, up-regulates glucose transporter proteins. There is growing evidence that hypoxia inducible factor (HIF) system plays a critical role in the gain of GLUT expression characteristics. Under the hypoxic conditions, oncogenic signals activate a transcription factor (HIF-1 complex) that controls the cellular adaptation of transformed cells to low oxygen. The stabilized HIF-1α subunit binds to hypoxia responsive elements (HRE) in promoters of target genes and this transcriptional regulation results in the activation of some glycolytic genes (i.e., Glut1, Glut3 expressions, several glycolytic enzymes including pyruvate kinase, phosphofructokinase, aldolase, LDHA) as well as angiogenic gene activation [13, 16, 17]. Some oncogenes c-Myc, Ras and Src have been shown to activate HIF-1 system as well as glucose transporters [18, 19]. Also, Glut1 expression and at least one isoform of glycolytic enzymes are transcriptionally increased by HIF-1 following hypoxic conditions. In concordance with these findings, HIF-1 proteins and Glut1 expression have been extensively observed in aggressive phenotypes and metastatic breast tumors [16, 20–22]. In the ER(+) breast cancer cell MCF-7, it has been shown that knockdown of HIF-1α results in reduced tumor growth and increased sensitivity to chemotherapeutics as well as attenuated Glut1 expression and phosphoglycerate kinase enzyme activity [23]. In addition, the same cell line exhibits increased 3H-FDG uptake and Glut1/Glut3 overexpression when exposed to acute hypoxia [24]. Reduced tumorigenicity and metastasis have also been observed in HIF-1α knockout MMTV–PyMY transgenic mice [25]. Therefore, specific Glut overexpression and HIF-1 activation seems to be responsible for more aggressive phenotypes in mammary carcinogenesis.
It has been well known that prolonged estrogenic exposure, such as early menarche, late menopause or hormone replacement therapy, have been considered main risk factors for the development of human breast cancer [26, 27]. In our previous studies, we have demonstrated that estrogen and its metabolites initiate malignant transformation in normal breast epithelial cells (MCF10F) showing early hallmarks of carcinogenesis, i.e., anchorage-independent cellular growth in agar methocel, loss of ductulogenesis as well as solid mass formation in collagen matrix and epithelial mesenchymal transition (EMT) [28–30]. This hormone is also particularly effective in further stages, for example acceleration of the cellular growth and progression of the premalignant xenografts [31]. In addition, tumoral tissue continues its own estrogen production by increasing intra-tumoral aromatase activity [32]. Therefore, estrogenic dependence is obvious in almost all steps of mammary carcinogenesis. On the other hand, estrogenic action on breast cancer progression and malignant transformation have been found to be related to the regulation of glucose transporter proteins [4]. For example, treatment of breast cancer cell lines with 17β-estradiol (E2) stimulates glucose metabolism via increased glycolysis, tricarboxylic acid cycle as well as increased Glut1 expression [33, 34]. Significant Glut12 expression has been observed after E2 treatment in several ER(+) cell lines [4]. Similarly, Glut3 expression is observed in the ZR-75 (ER+) cell line [35]. In addition, it has been shown that intermittent hypoxia and hypoxic environmental conditions induce down-regulation of estrogen receptor α and reduced hormone responsiveness in several breast cancer cell lines [36, 37].
Taken together, Glut1, 3, and 12 seem to be relevant to estrogen-induced mammary carcinogenesis and malignant transformation. However, under the estrogenic exposure specific selection of GLUT isoforms depending on tumor stage as well as their metabolic importance during the mammary carcinogenesis have yet to be elucidated. In the present study, we aimed to investigate the expression patterns of three GLUT isoforms in the E2-induced in vitro mammary carcinogenesis model.
Materials and methods
The experimental model of transformation of MCF-10F cells by 17-β estradiol treatment
In this study, our previously defined cell lines, the spontaneously immortalized ER-α and progesterone receptor (PgR) negative human breast epithelial cell line MCF-10F (passage 136), its transformed sequence using by 17-β estradiol E2 (passage 25), its invasive sequence C5 (passage 21) and finally its tumorigenic phenotype T4 (passage 10) were used [29, 30].
Schematic presentation of the previous experimental protocol and genomic characteristics of the cell lines used are summarized in Fig. 1. Briefly, the MCF-10F cell line was cultured in Dulbecco’s modified Eagle medium (DMEM):F12 containing 1.05 Calcium, antibiotics, hormones, growth factors and equine serum, and treated with 70 nM 17-β-estradiol (E2) (Sigma Chemical Co., St. Louis, MO, USA) or DMSO (control) for 24-h periods twice a week for 2 weeks; 24 h after the last treatment the cells were plated and maintained in culture for ten additional passages. Transformed cells were seeded onto Matrigel invasion chambers and at the end of a 22-h incubation period. Cells which had crossed the membrane were collected and identified as C5. Thereafter, tumorigenic ability of MCF-10F, E2 and C5 cells was tested by mammary fat pad inoculation in 45-day-old SCID mice. Tumorigenic response was observed only in four C5 inoculated mice. T4-cancer cells were then isolated from these tumors [38].
Figure 1.
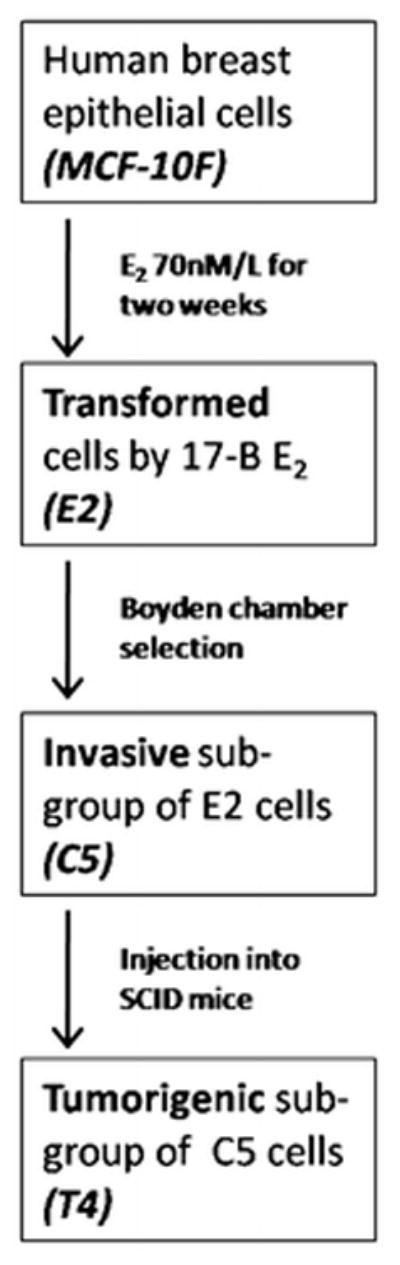
Experimental protocol and harvesting of transformed cells
Three-dimensional growth in type 1 collagen matrix: loss of ductulogenesis and solid mass formation
Ductulogenic capacity and solid mass formation were evaluated as previously described [28, 30]. Briefly, the cells were suspended in collagen matrix consisting of 2.68 mg/ml (89.3 %) type 1 collagen (PureCol, Inamed Biomaterials Co, Fremont CA), 8 % 12.5 X DMEM-F12 with antibiotics, 0.1 mg/ml insulin, 14 mM NaHCO3 and 0.01 N NaOH. Thereafter, the mixture was plated into four wells of a 24-well chamber (3,000 cells per well) pre-coated with 89.3 % of collagen base. After the solidification of collagen, the cells were fed with DMEM medium with daily intervals for 8 days. The cells were examined under an inverted microscope (Nikon Eclipse, TS100, Japan).
Invasion assay
Invasion assay was performed using 24-well plate Matrigel invasion chambers (BD Biosciences, Bedford, MA) fitted with cell culture inserts (Falcon Cell Culture Inserts) closed with an 8 μm pore-size PET membrane coated with a uniform Matrigel basement membrane matrix. Chambers were stored at 20 °C and brought to room temperature in a laminar flow hood for 2 h, and the insert chambers were hydrated by placing 500 μl of culture medium containing 5 % horse serum at 37 °C for 2 h in a humidified tissue culture incubator. Then the medium was removed from the inserts and 500 μl of 20 % horse serum was added to each well as chemoattractant. Then all cells were trypsinized, and each cell line was seeded in triplicate in the upper chamber at a concentration of 2, 5 × 10⁴ cells/well and incubated at 37 °C in a 5 % carbon dioxide incubator for 22 h. At the end of this period, the membranes of each chamber were fixed with Diff-Quick fixative and stained with DiffQuick solutions I and II (Sigma), cut out with a sharp scalpel, and mounted onto glass slides. The total number of cells that invaded through the membrane was counted under a light microscope and the invasion index was expressed as the mean ± SEM.
Colony formation in agar-methocel
Control and treated cells were suspended at a density of 2 × 10⁴ cells/ml in 2 ml of 0.8 % methocel (Sigma) dissolved in DMEM:F-12 (1:1) medium containing 20 % horse serum. Cells from each treatment group were plated in eight 24-well chambers pre-coated with 0.5 ml 5 % agar base in DMEM: F-12 medium. Cells were fed fresh medium twice a week. To evaluate colony efficiency, the total number of viable cells was counted at 10× magnification in four wells that were stained with neutral red (1:300) after 24 h post-plating and in four additional wells after 21 days in culture. Three weeks after, each colony was measured using a graduated eyepiece fitted in a transmission light microscope at 10× magnification. Colonies >50 μm in diameter were counted and results of colony efficiency were expressed as a percentage of the original number of viable cells after 24 h of plating.
Gene expression
Total RNA from cultured cells was extracted using the RNAeasy Mini kit (Qiagen Inc., Valencia, CA) according to the manufacturer’s instructions. The quality and quantity of each sample were verified by spectrophotometry using NanoDrop 3.3.0 (NanoDrop Technologies, Wilmington, DE) and by capillary electrophoresis using Agilent 2100 Bioanalyzer (Agilent Technologies, Palo Alto, CA). Relative quantification was performed through Real time RT-PCR. The reactions were performed on the ABI Prism 7000 Sequence Detection System (Applied Biosystems, Foster City, CA) using the fluorescent Taqman methodology (TaqMan One Step RT-PCR Master Mix Reagents, Applied Biosystems), 100 ng of total RNA and the probes (Table 1) in a total volume of 50 μl according the manufacturer’s protocol. The thermal cycling conditions comprised 30 min at 48 °C, 10 min at 95 °C, and 40 cycles of 15 s denaturation at 95 °C and 60 s annealing at 60 °C.
Table 1.
Probes used to measure the gene expression through real time RT-PCR
| Gene symbol | ABI assay ID | Alias | Gene name |
|---|---|---|---|
| 18S | Hs99999901_s1 | Eukaryotic 18S rRNA | |
| SLC2A1 | Hs00197884_m1 | GLUT1 | Solute carrier family 2 (facilitated glucose transporter), member 1 |
| SLC2A3 | Hs00359840_m1 | GLUT3 | Solute carrier family 2 (facilitated glucose transporter), member 3 |
| SLC2A12 | Hs00376943_m1 | GLUT12/GLUT8 | Solute carrier family 2 (facilitated glucose transporter), member 12 |
The end point used in the real time RT-PCR quantification were the C T values, defined as the PCR cycle number in which the fluorescence generated by the amplification crosses the threshold. Each gene was normalized using 18S as an endogenous control gene (ΔCT). The relative expression was calculated through the difference between the normalized expression of each cell type and MCF10F (ΔΔCT). The fold change for each cell type compared to the MCF10F was calculated using the formula 2−CT.
Statistical analysis
Two-tailed unpaired t test was used for gene expression analysis. Other analyses were performed using statistical software and differences were further evaluated using Holm–Sidak test for multiple pair-wise comparison procedures (SigmaStat 3.5, Systat Software Inc., San Jose, CA) and p < 0.05 was considered statistically significant.
Results
Ductulogenesis, solid mass formation, colony formation and invasiveness
In collagen matrix, the mean numbers of ductules was significantly higher in the MCF-10F group than in the other cells. E2 cells showed a higher rate of ductus formation when compared to C5 cells (p < 0.02). However, solid mass formation was only observed in the transformed cells (E2, C5 and T4). Maximum number of solid mass formation was observed in E2 group. Invasion capacity was significantly higher in C5-cells group than the others (ANOVA followed by Holm–Sidak test). Anchorage-independent growth in agar-methocel revealed that colony formation less than 250 μm is remarkable in E2 (transformed phenotype) cells, whereas, larger colony formation (>250 μm) was observed only in invasive (C5) and tumorigenic cells (T4). The mean number of bigger colonies in agar-methocel, however, was found to be higher in the C5 group (p = 0.008; Student t test). Data are summarized in Table 2.
Table 2.
| MCF-10F | E2 | C5 | T4 | p value | |
|---|---|---|---|---|---|
| Invasiveness | 162 ± 11 | 683 ± 48 | 1322 ± 145 | 503 ± 231 | ≤0.001a |
| Ductulogenesis in collagen matrix | 31.8 ± 1.4 | 5.1 ± 0.7 | 0.7 ± 0.4 | 0.7 ± 0.2 | ≤0.001b |
| Mass formation in collagen | |||||
| <250 nm | – | 334 ± 9.4 | 12 ± 2 | 41.7 ± 4 | ≤0.001c |
| >250 nm | – | 24 ± 8.6 | 1 ± 0.4 | 13.1 ± 1.9 | 0.044d |
| Colony forming in agar | |||||
| <250 μm | 191.5 ± 8.5 | 619.2 ± 53.7 | 281.7 ± 29 | 113 ± 20 | 0.01e |
| >250 μm | – | – | 175 ± 20 | 91 ± 6.6 | 0.008f |
ANOVA followed by Holm–Sidak test was used for the comparisons of above-mentioned values except colony formation (bottom line) and results were expressed as ±SEM (standard error of the mean)
C5 cells showed higher invasion rates than the others
MCF-10F cells showed higher rate of ductal formation in collagen matrix when compared to the other groups. The comparison between E2 and C5 was also significant. No mass formation was observed in cultured MCF-10F cells
The highest values observed in E2 cells. The all comparisons were significant
E2 values were higher than C5. Other comparisons were insignificant
Mean colony numbers in E2 group were significantly higher than other groups. In addition, the comparison between C5 and T4 groups was statistically significant. However, other comparisons were insignificant (ANOVA followed by Holm–Sidak test). Other group comparisons in the aspect of colony formation in agar-methocel were insignificant
Colony formation bigger than 250 μm was observed in C5 and T4 groups. Mean colony number in C5 group was statistically higher than T4 (Student t test)
Gene expression
The real time technique showed that Glut1 expression was downregulated in MCF10F after treatment with 17β-estradiol (E2) and in the invasive cell type (C5), but not in the tumor cells (T4), which had no changes compared to MCF10F. Glut3 had an increase in gene expression in all the cells derived from MCF10F. The expression of Glut3 in the E2 cell was 1.7-fold from those detected in the MCF10F cell. In C5 and T4 the expressions were 40 and 70-folds of Glut3 in the relation to the control. The expression of Glut12 was decreased in all the cell types, E2, and C5 demonstrated a reduction of 24, and 49 % of expression, respectively, while T4, had a down-regulation of 11 %, not statistically significant (Fig. 2).
Figure 2.
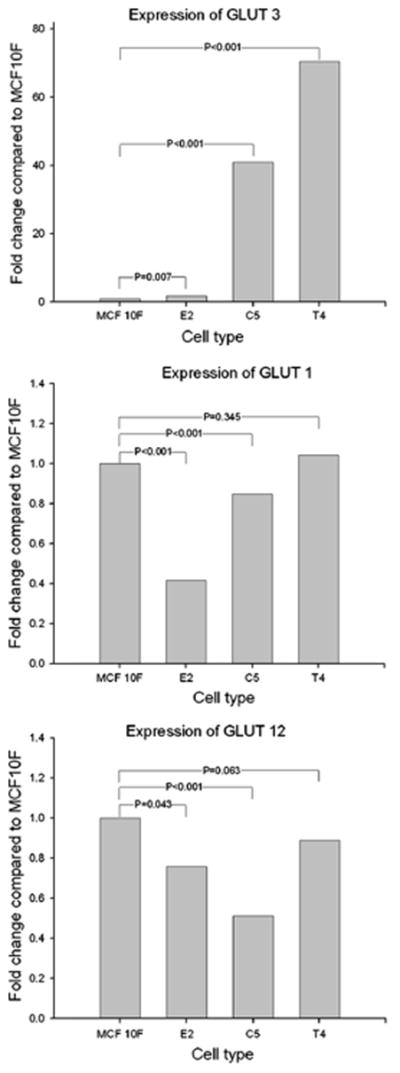
Graphics showing the expression of each gene (Glut3, Glut1 and Glut12), for each cell type (E2, C5, T4). The expression is shown in fold change related to MCF10F cells
Discussion
In the present study, we attempted to identify the gene expression profiles of particular GLUTs in an isogenic group of cell lines in order to better understand the stages of specific alterations within estrogen-induced carcinogenesis. We used our in vitro–in vivo progressive mammary carcinogenesis model which consisted of 4 cell lines, from healthy (MCF-10F) to tumorigenic cells (E2, C5, T4), with the same genetic background (Fig. 1).
The immortalized ERα and PrR negative, but ERβ-positive human breast epithelial cell line MCF-10F forms ductal-like structures under 3D cell culture conditions (Fig. 3). However, when this cell line is subjected to carcinogenic exposure (i.e., estrogen or chemical carcinogen) it starts gaining neoplastic phenotypes: i.e., loss of ductulogenic capacity but solid mass formation in collagen, invasiveness in a Matrigel basement membrane, as well as forming colonies in agar methocel [30, 39].
Figure 3.
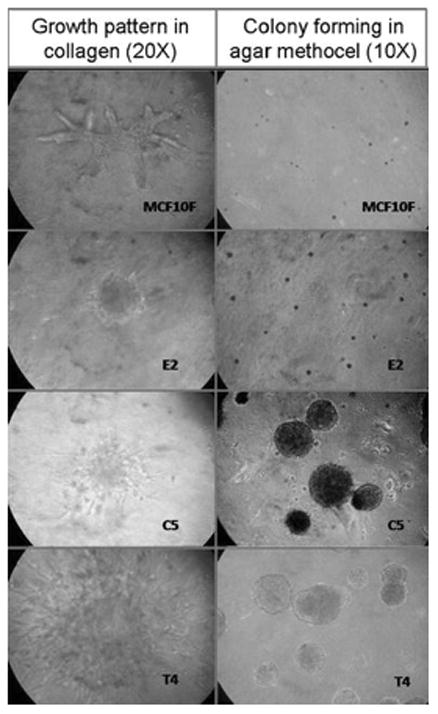
Growth patterns in 3-D conditions as indicators of malignant transformation. The transformed cells (E2, C5, T4) lost their ductulogenic capacity in collagen matrix and showed mass formation (left column). Colony formation of represented cells in Agar methocel (right column)
Our laboratory previously demonstrated that short-term (2 weeks) treatment of MCF-10F cells with estradiol and its catechol metabolites induce these phenotypes indicative of neoplastic transformation [30, 39]. In order to mimic the intermittent exposure of MCF10F to endogenous estrogens, cells were first treated with physiological doses of E2 at 72 and 120 h post-plating. Treatments were repeated during the second week, and cells were collected at the 14th day for phenotypic and genotypic analysis [39]. After treatment with E2, MCF-10F cells almost completely lost their ductulogenic capacity, while acquired solid mass formation in collagen. More importantly, the expression of these phenotypes induced by E2 were not abrogated by their simultaneous treatment with anti-estrogen ICI-182780, suggesting that the transformation of MCF-10F cells by these compounds did not require the presence of the ERα [28, 39]. In the present study, this phenotype was confirmed in all transformed cells (Fig. 3; Table 2).
In our previous studies, transforming potential of E2 on MCF10F was compared with chemical carcinogen benzo[a]pyrene (BP) by using the same in vitro model. Estradiol and BP showed similar phenotypical, but different genomic alterations [40]. For example, E2-transformed cells exhibited LOH in chromosomes 3 and 11, whereas BP did not induce genomic changes during the same period of time. In addition, E2-transformed MCF-10F cells were compared with ER(−) breast cancer cell lines BP1-Tras and MDA-MB-231 [30]. Similar to E2 cells, BP1-Tras and MDA-MB-231 exhibited a complete absence of ductule formation, forming instead solid masses in collagen whose values were not significantly different from those formed by E2-induced cells. However, when injected into SCID mice, neither MCF-10F nor E2-treated cells formed tumors after a 6 month follow-up period. Instead, BP1-Tras and MDA-MB-231 cells showed highly tumorigenic response with a short latency period [30]. In order to obtain more invasive cells among E2 transformed MCF-10F cells, cells that had crossed the reconstituted basement membrane in the Boyden Chamber were collected, expanded (C5 cells) and then injected to SCID mice (Fig. 1). From the nine tumors obtained from C5 cells, four tumoral cell lines (T4) were derived. Histopathologic analysis revealed that all C5 derived tumors were ER α (−), Progesterone receptor (−), and cErbB2 (−) poorly differentiated adenocarcinomas [30, 41]. In addition, fingerprint analysis using six different markers revealed that all the tumors and cell lines originated from MCF-10F cells and these data were also confirmed using variable number of tandem repeat (VNTR) analysis [30]. Comparative genomic hybridization (CGH) revealed cumulative genomic changes in all transformed cell lines. For example, loss of 9p11-13, LOH D13S893, Delp53 exon4, persisted in all transformed cells; complete loss of chromosome 4 was observed in C5 and T4 cells. Additionally, Gain1P, Gain5q-15qtr, Loss3-12.3-13, and Loss8p11.1-21 were observed in T4 cells [29, 30, 41].
Similar model systems that originate from the same immortal cell line (MCF10) including transformed, in situ, invasive and metastatic subgroups (named as MCF10A model) have been developed by Miller and co-workers [42, 43]. In this model, malignant transformation was initiated by H-ras oncogene transfection in non-malignant breast epithelial cells (MCF10) and estrogenic compounds were not used in any other cell lines representing further stages, whereas in our model system, malignant transformation was initiated with 17-β Estradiol. Therefore, we believe that the present model is more appropriate with regard to testing stage-specific gene expression profiles under the influence of estrogenic action. On the other hand, both carcinogenic initiators may give rise to different types of GLUT expressions. For example, malignant transformation of Rat1 fibroblasts with H-ras results in a substantial increase in glut1 mRNA levels in hypoxic conditions and thus, H-ras may specifically up-regulate Glut1 promoter [44]. In addition, it has been shown that transfection of the MCF10A cell line with V12-ras causes HIF-1α and VEGF overexpression (a hallmark of glycolytic phenotype) under hypoxic conditions [45], whereas ovarian hormones, particularly estrogen, seem to be effective in GLUT regulation [4, 10]. Although, estrogenic regulation of glucose transporters on mammary epithelium is unclear. The mouse mammary epithelial cell line, COMMA-D, isolated from pregnant Balb/c mice shows Glut-1 expression, but not Glut3 or Glut-4. During pregnancy, the expression of Glut4 decreased progressively, whereas that of Glut1 increased [46]. In malignant conditions, it has also been shown that 17-β estradiol (E2) treatment stimulates glucose utilization [33]. In addition, E2 and progesterone differentially regulate Glut1-4 expression correlated with glucose uptake in ER(+) ZR-75 cell line [15]. Similarly, in a study, long-term treatment with E2 showed increased Glut12 levels in MCF-7 cells [4].
In the present study, Glut-1 and Glut-12 overexpression have not been observed in more-progressed (tumorigenic-T4) cells (Fig. 2). This result may be related to lack of a metastatic cell line in our model. Increased expression levels, particularly for Glut1, could be observed in metastatic stages. For example, Alo and co-workers [47] reported that Glut-1 staining has been identified in 36 % of hyperplastic breast lesions and 74 % of invasive breast carcinoma specimens. They observed progressive increase of Glut-1 positive cell content in immunohistochemical sections according to tumor grade and stage. Recently, high correlations between the primary tumors and metastatic lymph nodes with respect to Glut1 expression have been observed in several invasive tumors [48, 49]. Similar results have been observed in normal and malignant breast tissues with respect to Glut12 expression. For example, Rogers and co-workers [50], reported that Glut12 staining has been found in 90 % of invasive tumors and 60 % of DCIS sections. They also found very weak Glut12 staining in 60 % of normal breast epithelium.
On the other hand, down-regulation of Glut-1 in E2 and C5 cells in comparison with normal breast epithelial cells may also be related to tissue-specific endothelial differentiation response to 17-β Estradiol. For example, Glut-1 is extensively expressed in brain tissues under the normal circumstances [10]. In vivo treatment of blood–brain-barrier (BBB) endothelium with E2 resulted in Glut-1 mRNA over-expression [51]. Whereas, it has been shown that during the development and differentiation of the mammary gland, from the virgin rat to pregnancy period, the amount of Glut4 mRNA is decreased by 90 %, but the amount of Glut1 mRNA is increased by eightfold [46]. Interestingly, Glut12 co-expression has been observed as a second transporter with Glut1 in mammary epithelial cells during pregnancy and lactation [52]. We have previously postulated that differentiation of mammary gland determines the susceptibility to carcinogenesis [53]. For example, following early-full term pregnancy and lactation periods, terminally differentiated breast epithelium becomes resistant to E2-induced carcinogenesis [30, 54]. Therefore, differentiation of mammary epithelium may be reversely associated with Glut1 and Glut12 expression. Concordant with this suggestion, Rivenzon-Segal and co-workers [55] have found that differentiation of the breast cancer cell line T47D with retinoic acid led to a reduction in Glut-1 and to an increase in cytoplasmic Glut-3 as well as decreased glycolysis.
Here, we have demonstrated for the first time that estrogen-induced malignant progression is associated with progressive Glut3 over-expression. This isoform is commonly expressed in neuronal tissues under normal physiological conditions and therefore, known as a neuron-specific glucose transporter [56]. In a reported series exploring Glut1-6,9 immunostaining in normal and tumoral tissues, Glut3 expression was not encountered in any of the normal breast tissue, whereas it was found in 33 % of invasive breast tumor specimens [57]. In other series, Glut3 expression is relatively high in aggressive tumors including breast, choriocarcinoma and lung tumors [4, 10]. However, the expression pattern of Glut3, particularly in preneoplastic and proliferative lesions, are unknown. On the other hand, quite a few data have been published about the role of estrogens on Glut3 expression in tumoral cell lines. For example, Medina and co-workers [58] investigated the effects of estrogen and progesterone (P) Glut1-4 expression and glucose transport in ER(+) breast cancer cell line ZR-75-1. They found that there was no induction of Glut1-4 mRNA levels in the presence of 17-β estradiol (E2), whereas P and the combination E2 caused an increment in Glut1 and weakly Glut3 mRNA levels. A similar study design was applied into the Ishikawa endometrial cancer cell line and the Glut1 over-expression pattern was observed after estrogen and progesterone treatment individually [59]. Recently, Meneses and co-workers [35] demonstrated that 8-br-cAMP, an analog of cAMP is capable of activating both cAMP-dependent protein kinase Type I and Type II (PKA), in particular transcriptional Glut3 regulation, in breast cancer cell line ZR-75. This signal transduction pathway can also be initiated by Epithelial growth factor receptor activation (EGFR/PKA) [60]. It is well known that the members of EGFR family play important role in regulating a number of cellular processes, differentiation and malignant transformation [61]. This system is commonly activated by several growth factor ligands including TGF-α, EGF and hepatocyte growth factor (HGF) and responsible for the generation of more aggressive and more invasive phenotypes which are resistant to anti-estrogen treatment [62]. For example, TGFα-induced activation of EGFR signaling pathway greatly enhances invasion and motility of tamoxifen-resistant cells [63]. Also, estrogen itself, and homo/heterodimerization of the members of EGFR family initiates several well-known protein kinase-mediated signal transduction cascades including Ras-Raf-MAPK, PI-3K-Akt-GSK, PLC-γ-CaMK/PKC and STAT pathways [64–66]. Recently, cross-talk between the EGFR and HIF-α signal pathways has been defined on apoptotic resistance by up-regulating survivin gene expression in several breast cancer cell lines including MCF-7, SK-BR-3, MDA-MB-231, but not in MCF10A [67]. Interestingly, it has been shown that EGF and TGF-α were able to induce PKA expression in MCF10A cells [68].
Although increased glucose metabolism and overexpression of Gluts in cancer are well known, reasons for tumor and stage-specific alterations (as seen at Fig. 2) on Glut isoform expressions and their importance in cancer biology have not been completely understood. These alterations are appearing related to metabolic rates of transformed cells or tumors and their aggressive behavior. For example, it has been shown that differentiation to less aggressive phenotype led to a 33 % decrease of Glut1 expression and a 35–40 % reduction in the glucose consumption [55].
Breast tumor tissue specimens and cultured breast carcinoma cells are often associated with the overexpression of Gluts, particularly Glut1 and less frequently Glut3 [4, 10]. Glut12 was recently identified in MCF7 cells and detected in eight of ten invasive breast tumors [50]. Therefore, we selected and studied 3 isoforms (Glut1, 3, 12) among the identified members of facilitative glucose transporter family. Expression analyses of the other isoforms in tumor tissues appeared less consistent. For example, in a reported series of 30 patients, 57 % of the breast cancer tissues showed positivity for Glut1, 43 % for Glut4 but Glut2 activity could not be detected [69]. However, Godoy et al. [57] have shown moderate immunoreactivity for Glut2 and Glut5(90 %), weak immunostaining for Glut3 (9 %) and Glut4 (6 %).
Undoubtedly, besides Glut1, 3 and 12, other isoforms need to be analyzed using our model system in further studies for better understanding of estrogen induced tumor biology and defining novel molecular targets. The overexpressed Glut isoforms can be considered as molecular target for personalized cancer treatment. For example, Young and co-workers have shown that modulation of Glut1 expression levels alters mouse mammary tumor cell growth in the in vivo and in vitro conditions [70]. In addition, monoclonal Glut-1 antibody treatment has been found to be effective against ER-positive breast carcinoma cells MCF-7 and T47D [71]. Similar results can be obtained using Glut-3 antibodies or Glut-3 modulation methods in our model system.
Consequentially, increased intracellular cAMP production due to glycolytic phenotype may involve cAMP-dependent PKA activation and transcriptional regulation of Glut3. Thus, under the estrogenic exposure, progressive Glut3 expression may be a result of activated EGFR/PKA signal transduction pathway in our study.
Acknowledgments
This work was supported by grant R21 ES015894 from the NIEHS.
Footnotes
Conflict of interest
The authors have nothing to disclose.
References
- 1.Devlin TM. Biological membranes: structure and membrane transport. In: Devlin TM, editor. Textbook of biochemistry. 6. Wiley-Liss; Hoboken, NJ: 2006. pp. 443–487. [Google Scholar]
- 2.Lieberman M, Marks AD. Marks’ basic medical biochemistry a clinical approach. 3. Wolters Kluwer, LWW; Baltimore MD: 2009. Digestion, absorption, and transport of carbohydrates; pp. 499–517. [Google Scholar]
- 3.Warburg O. On the origin of cancer cells. Science. 1956;123:309–314. doi: 10.1126/science.123.3191.309. [DOI] [PubMed] [Google Scholar]
- 4.Macheda ML, Rogers S, Best JD. Molecular and cellular regulation of glucose transporter (Glut) proteins in cancer. J Cell Physiol. 2005;202:654–662. doi: 10.1002/jcp.20166. [DOI] [PubMed] [Google Scholar]
- 5.Gatenby RA, Gawlinski ET. The glycolytic phenotype in carcinogenesis and tumor invasion: insights through mathematical models. Cancer Res. 2003;63:3847–3854. [PubMed] [Google Scholar]
- 6.Gillies R, Gatenby RA. Hypoxia and adaptive landscapes in the evaluation of carcinogenesis. Cancer Metastasis Rev. 2007;26:311–317. doi: 10.1007/s10555-007-9065-z. [DOI] [PubMed] [Google Scholar]
- 7.Warburg O. On respiratory impairment in cancer cells. Science. 1956;124:269–270. [PubMed] [Google Scholar]
- 8.Hennipman A, van Oirschot BA, Smitz J, et al. Glycolytic enzyme activities in breast cancer metastasis. Tumour Biol. 1988;9:241–248. doi: 10.1159/000217568. [DOI] [PubMed] [Google Scholar]
- 9.Suganuma N, Segade F, Matsuzu K, Bowden DW. Differential expression of facilitative glucose transporters in normal and tumour kidney tissues. BJU Int. 2007;99:1143–1149. doi: 10.1111/j.1464-410X.2007.06765.x. [DOI] [PubMed] [Google Scholar]
- 10.Medina RA, Owen GI. Glucose transporters: expression, regulation and cancer. Biol Res. 2002;35:9–26. doi: 10.4067/s0716-97602002000100004. [DOI] [PubMed] [Google Scholar]
- 11.Rogers S, Macheda ML, Docherty SE, et al. Identification of a novel glucose transporter-like protein GLUT-12. Am J Physiol Endocrinol Metab. 2002;282:733–738. doi: 10.1152/ajpendo.2002.282.3.E733. [DOI] [PubMed] [Google Scholar]
- 12.Stackhouse BL, Williams H, Berry P, et al. Measurement of Glut-1 expression using tissue microarrays to determine a race specific prognostic marker for breast cancer. Breast Cancer Res Treat. 2005;93:247–253. doi: 10.1007/s10549-005-5158-y. [DOI] [PubMed] [Google Scholar]
- 13.Gatenby RA, Smallbone K, Maini PK, et al. Cellular adaptations to hypoxia and acidosis during somatic evaluation of breast cancer. Brit J Cancer. 2007;97:646–653. doi: 10.1038/sj.bjc.6603922. [DOI] [PMC free article] [PubMed] [Google Scholar]
- 14.Robey IF, Stephen RM, Brown KS, et al. Regulation of Warburg effect in early-passage breast cancer cells. Neoplasia. 2008;10:745–756. doi: 10.1593/neo.07724. [DOI] [PMC free article] [PubMed] [Google Scholar]
- 15.Fang JS, Gillies RD, Gatenby RA. Adaptation to hypoxia and acidosis in carcinogenesis and tumor progression. Semin Cancer Biol. 2008;18:330–337. doi: 10.1016/j.semcancer.2008.03.011. [DOI] [PMC free article] [PubMed] [Google Scholar]
- 16.Airley RE, Mobasheri A. Hypoxic regulation of glucose transport, anaerobic metabolism and angiogenesis in cancer: novel pathways and targets for anticancer therapeutics. Chemotherapy. 2007;53:233–256. doi: 10.1159/000104457. [DOI] [PubMed] [Google Scholar]
- 17.Ortega AD, Sanchez-Arago M, Giner-Sanchez D, et al. Glucose avidity of carcinomas. Cancer Lett. 2009;276:125–135. doi: 10.1016/j.canlet.2008.08.007. [DOI] [PubMed] [Google Scholar]
- 18.Flier JS, Mueckler MM, Usher P, Lodish HF. Elevated levels of glucose transport and transporter messenger RNA are induced by ras or src oncogenes. Science. 1987;235:1492–1495. doi: 10.1126/science.3103217. [DOI] [PubMed] [Google Scholar]
- 19.Gillies RJ, Robey I, Gatenby RA. Causes and consequences of increased glucose metabolism of cancers. J Nucl Med. 2008;49:24S–42S. doi: 10.2967/jnumed.107.047258. [DOI] [PubMed] [Google Scholar]
- 20.Semenza GL, Roth PH, Fang HM, Wang GL. Transcriptional regulation of genes encoding glycolytic enzymes by hypoxia-inducible factor 1. J Biol Chem. 1994;269:23757–23763. [PubMed] [Google Scholar]
- 21.Zhong H, De Marzo AM, Laughner E, et al. Overexpression of hypoxia-inducible factor 1 α in common human cancers and their metastasis. Cancer Res. 1999;59:5830–5835. [PubMed] [Google Scholar]
- 22.Robey IF, Lien AD, Welsh SJ, et al. Hypoxia inducible factor-1 alpha and the glycolytic phenotype in tumors. Neoplasia. 2005;7:324–330. doi: 10.1593/neo.04430. [DOI] [PMC free article] [PubMed] [Google Scholar]
- 23.Li J, Shi M, Cao Y, et al. Knockdown of hypoxia-inducible factor-1α in breast cancer cells results in reduced tumor growth and increased sensitivity to methotrexate. Biochem Biophy Res Commun. 2006;342:1341–1351. doi: 10.1016/j.bbrc.2006.02.094. [DOI] [PubMed] [Google Scholar]
- 24.Burgman P, O’Donoghue JA, Humm JL, Ling CC. Hypoxia-induced increases in FDG uptake in MCF 7 cells. J Nucl Med. 2001;42:170–175. [PubMed] [Google Scholar]
- 25.Liao D, Corle C, Seagroves TN, Johnson RS. Hypoxia-inducible factor-1α is a key regulator of metastasis in a transgenic model of cancer initiation and progression. Cancer Res. 2007;67:563–572. doi: 10.1158/0008-5472.CAN-06-2701. [DOI] [PubMed] [Google Scholar]
- 26.Toniolo PG, Levitz M, Zeleniuch-Jacquotte A, et al. A prospective study of endogenous estrogens and breast cancer in postmenopausal women. J Natl Cancer Inst. 1995;87:190–197. doi: 10.1093/jnci/87.3.190. [DOI] [PubMed] [Google Scholar]
- 27.Greenlee RT, Murray T, Bolden S, Wingo PA. Cancer statistics. CA Cancer J Clin. 2000;50:7–33. doi: 10.3322/canjclin.50.1.7. [DOI] [PubMed] [Google Scholar]
- 28.Lareef MH, Garber J, Russo PA, et al. The estrogen antagonist ICI-182-780 does not inhibit the transformation phenotypes induced by 17-β-estradiol and 4-OH estradiol in human breast epithelial cells. Int J Oncol. 2004;26:423–429. [PubMed] [Google Scholar]
- 29.Russo J, Russo IH. The role of estrogen in the initiation of breast cancer. J Steroid Biochem Mol Biol. 2006;102:89–96. doi: 10.1016/j.jsbmb.2006.09.004. [DOI] [PMC free article] [PubMed] [Google Scholar]
- 30.Russo J, Fernandez SV, Russo PA, et al. 17-Beta-estradiol induces transformation and tumorigenesis in human breast epithelial cells. FASEB J. 2006;20:1622–1634. doi: 10.1096/fj.05-5399com. [DOI] [PubMed] [Google Scholar]
- 31.Shekhar MP, Nangia-Makker P, Wolman SR, et al. Direct action of estrogen on sequence of progression of human preneoplastic breast disease. Am J Pathol. 1998;152:1129–1132. [PMC free article] [PubMed] [Google Scholar]
- 32.Yamaguchi Y. Microenvironmental regulation of estrogen signals in breast cancer. Breast Cancer. 2007;14:175–181. doi: 10.2325/jbcs.975. [DOI] [PubMed] [Google Scholar]
- 33.Neeman M, Degani H. Metabolic studies of estrogen and tamoxifen-treated human breast cancer cells by nuclear magnetic resonance spectroscopy. Cancer Res. 1989;49:589–594. [PubMed] [Google Scholar]
- 34.Rivenzon-Segal D, Boldin-Adamsky S, Seger D, et al. Glycolysis and glucose transporter 1 as markers of response to hormonal therapy in breast cancer. Int J Cancer. 2003;107:177–182. doi: 10.1002/ijc.11387. [DOI] [PubMed] [Google Scholar]
- 35.Meneses AM, Medina RA, Kato S, et al. Regulation of GLUT 3 and glucose uptake by cAMP signalling pathway in the breast cancer cell line ZR-75. J Cell Physiol. 2008;214:110–116. doi: 10.1002/jcp.21166. [DOI] [PubMed] [Google Scholar]
- 36.Kurebayashi J, Otsuki T, Moriya T, Sonoo H. Hypoxia reduces hormone responsiveness of human breast cancer cells. Jpn J Cancer Res. 2001;92:1093–1101. doi: 10.1111/j.1349-7006.2001.tb01064.x. [DOI] [PMC free article] [PubMed] [Google Scholar]
- 37.Cooper C, Liu GY, Niu YL, et al. Intermittent hypoxia induces proteasome-dependent down-regulation of estrogen receptor α in human breast carcinoma. Clin Cancer Res. 2004;10:8720–8727. doi: 10.1158/1078-0432.CCR-04-1235. [DOI] [PubMed] [Google Scholar]
- 38.Russo J, Balogh GA, Chen J, et al. The concept of stem cell in mammary gland and its implication in morphogenesis, cancer and prevention. Front Biosci. 2006;11:151–172. doi: 10.2741/1788. [DOI] [PubMed] [Google Scholar]
- 39.Russo J, Lareef MH, Balogh G, et al. Estrogen and its metabolites are carcinogenic agents in human breast epithelial cells. J Steroid Biochem Mol Biol. 2003;87:1–25. doi: 10.1016/s0960-0760(03)00390-x. [DOI] [PubMed] [Google Scholar]
- 40.Russo J, Lareef MH, Tahin Q, et al. 17β-Estradiol is carcinogenic in human breast epithelial cells. J Steroid Biochem Mol Biol. 2002;80:149–162. doi: 10.1016/s0960-0760(01)00183-2. [DOI] [PubMed] [Google Scholar]
- 41.Huang Y, Fernandez SV, Goodwin S, et al. Epithelial to mesenchymal transition in human breast epithelial cells transformed by 17beta-estradiol. Cancer Res. 2007;67:11147–11157. doi: 10.1158/0008-5472.CAN-07-1371. [DOI] [PubMed] [Google Scholar]
- 42.Miller FR. Xenograft models of premalignant breast disease. J Mammary Gland Biol Neopl. 2000;5:379–391. doi: 10.1023/a:1009577811584. [DOI] [PubMed] [Google Scholar]
- 43.Worsham MJ, Pals G, Schouten JP, et al. High-resolution mapping of molecular events associated with immortalization, transformation, and progression to breast cancer in MCF10 model. Breast Cancer Res Treat. 2006;96:177–186. doi: 10.1007/s10549-005-9077-8. [DOI] [PubMed] [Google Scholar]
- 44.Chen C, Pore N, Behrooz A, et al. Regulation of glut1 mRNA by Hypoxia- inducible factor-1. J Biol Chem. 2001;276:9519–9525. doi: 10.1074/jbc.M010144200. [DOI] [PubMed] [Google Scholar]
- 45.Blancher C, Moore JW, Robertson N, Harris AL. Effects of ras and von Hippel-Lindau (VHL) gene mutations on hypoxia-inducible factor (HIF)-1, HIF-2, and vascular endothelial growth factor expression and their regulation by the phosphatidylinositol 3′-kinase/Akt signaling pathway. Cancer Res. 2001;61:7349–7355. [PubMed] [Google Scholar]
- 46.Burnol AF, Leturque A, Loizeau M, et al. Glucose transporter expression in rat mammary gland. Biochem J. 1990;270:277–279. doi: 10.1042/bj2700277. [DOI] [PMC free article] [PubMed] [Google Scholar]
- 47.Alo PL, Visca P, Botti C, et al. Immunohistochemical expression of human erythrocyte glucose transporter and fatty acid synthase in infiltrating breast carcinomas and adjacent typical/atypical hyperplastic or normal breast tissue. Am J Clin Pathol. 2001;116:129–134. doi: 10.1309/5Y2L-CDCK-YB55-KDK6. [DOI] [PubMed] [Google Scholar]
- 48.Nguyen XC, So Y, Chung JH, et al. High correlations between primary tumours and loco-regional metastatic lymph nodes in non-small-cell lung cancer with respect to glucose transporter type 1-mediated 2-deoxy-2F18-fluoro-d-glucose uptake. Eur J Cancer. 2008;44:692–698. doi: 10.1016/j.ejca.2008.02.009. [DOI] [PubMed] [Google Scholar]
- 49.Zhou S, Wang S, Wu Q, et al. Expression of glucose transporter-1 and -3 in the head and neck carcinoma—the correlation of the expression with the biological behaviors. ORL J Otorhinolaryngol Relat Spec. 2008;70:189–194. doi: 10.1159/000124293. [DOI] [PubMed] [Google Scholar]
- 50.Rogers S, Docherty SE, Slavin JL, et al. Differential expression of GLUT12 in breast cancer and normal breast tissue. Cancer Lett. 2005;193:225–233. doi: 10.1016/s0304-3835(03)00010-7. [DOI] [PubMed] [Google Scholar]
- 51.Shi J, Simpkins JW. 17 beta-Estradiol modulation of glucose transporter 1 expression in blood-brain barrier. Am J Physiol. 1997;272:E1016–E1022. doi: 10.1152/ajpendo.1997.272.6.E1016. [DOI] [PubMed] [Google Scholar]
- 52.Macheda ML, Williams ED, Best JD, et al. Expression and localization of Glut1 and Glut 12 glucose transporters in the pregnant and lactating rat mammary gland. Cell Tissue Res. 2003;311:91–97. doi: 10.1007/s00441-002-0661-5. [DOI] [PubMed] [Google Scholar]
- 53.Russo J, Lareef H, Tahin Q, Russo IH. Pathways of carcinogenesis and prevention in the human breast. Eur J Cancer. 2002;38:S31–S32. doi: 10.1016/s0959-8049(02)00276-9. [DOI] [PubMed] [Google Scholar]
- 54.Russo J, Mailo D, Hu YF, et al. Breast differentiation and its implication in cancer prevention. Clin Cancer Res. 2005;11:931s–936s. [PubMed] [Google Scholar]
- 55.Rivenzon-Segal D, Rushkin E, Polak-Charcon S, Degani H. Glucose transporters and transport kinetics in retinoic acid-differentiated T47D human breast cancer cells. Am J Physiol Endocrinol Metab. 2000;279:E508–E519. doi: 10.1152/ajpendo.2000.279.3.E508. [DOI] [PubMed] [Google Scholar]
- 56.Zhao F-Q, Keating AF. Functional properties and genomics of glucose transporters. Curr Genomics. 2007;8:113–128. doi: 10.2174/138920207780368187. [DOI] [PMC free article] [PubMed] [Google Scholar]
- 57.Godoy A, Ulloa V, Rodriguez F, et al. Differential subcellular distribution of glucose transporters Glut1-6 and Glut9 in human cancer: ultrastructural localization of Glut1 and Glut5 in breast tissues. J Cell Physiol. 2006;207:614–627. doi: 10.1002/jcp.20606. [DOI] [PubMed] [Google Scholar]
- 58.Medina RA, Meneses AM, Vera JC, et al. Estrogen and progesterone up-regulate glucose transporter expression in ZR-75-1 human breast cancer cells. Endocrinology. 2003;144:4527–4535. doi: 10.1210/en.2003-0294. [DOI] [PubMed] [Google Scholar]
- 59.Medina RA, Meneses AM, Vera JC, et al. Differential regulation of glucose transporter expression by estrogen and progesterone in Ishikawa endometrial cancer cells. J Endocrinol. 2004;182:467–478. doi: 10.1677/joe.0.1820467. [DOI] [PubMed] [Google Scholar]
- 60.Ciardiello F, Tortora G. Interactions between the epidermal growth factor receptor and Type I protein kinase A: biological significance and therapeutic implications. Clin Cancer Res. 1998;4:821–828. [PubMed] [Google Scholar]
- 61.Troyer K, Lee DC. Regulation of mammary gland development and tumorigenesis by the ERBB signalling network. J Mammary Gland Biol Neoplasia. 2001;6:7–21. doi: 10.1023/a:1009560330359. [DOI] [PubMed] [Google Scholar]
- 62.Nicholson RI, Hutcheson IR, Harper ME, et al. Modulation of epidermal growth factor receptor in endocrine- resistant, oestrogen receptor-positive breast cancer. Endocr Relat Cancer. 2001;8:175–182. doi: 10.1677/erc.0.0080175. [DOI] [PubMed] [Google Scholar]
- 63.Nicholson RI, Hutcheson IR, Britton JM, et al. Growth factor signalling networks in the breast cancer and resistance to endocrine agents: new therapeutic strategies. J Steroid Biochem Mol Biol. 2005;93:257–262. doi: 10.1016/j.jsbmb.2004.12.006. [DOI] [PubMed] [Google Scholar]
- 64.Murphy L, Cherlet T, Lewis A, et al. New insights into estrogen receptor function in human breast cancer. Ann Med. 2003;35:614–631. doi: 10.1080/07853890310014579. [DOI] [PubMed] [Google Scholar]
- 65.Likhite VS, Stossi F, Kim K, et al. Kinase-specific phosphorylation of the estrogen receptor changes receptor interactions with ligand, deoxyribonucleic acid, and coregulators associated with alterations in estrogen and tamoxifen activity. Mol Endocrinol. 2006;20:3120–3132. doi: 10.1210/me.2006-0068. [DOI] [PubMed] [Google Scholar]
- 66.Lo HW, Hsu SC, Hung MC. EGFR signaling pathway in breast cancers: from traditional signal transduction to direct nuclear translocation. Breast Cancer Res Treat. 2006;95:211–218. doi: 10.1007/s10549-005-9011-0. [DOI] [PubMed] [Google Scholar]
- 67.Peng XH, Karna P, Cao Z, et al. Cross-talk between epidermal growth factor receptor and hypoxia-inducible factor-1α signal pathways increases resistance to apoptosis by up-regulating survivin gene expression. J Biol Chem. 2006;281:25903–25914. doi: 10.1074/jbc.M603414200. [DOI] [PMC free article] [PubMed] [Google Scholar]
- 68.Tortora G, Pepe S, Bianco C, et al. The RIα subunit of protein kinase A controls serum dependency and entry into cell cycle of human mammary epithelial cells. Oncogene. 1994;9:3233–3240. [PubMed] [Google Scholar]
- 69.Binder C, Binder L, Marx D, et al. Deregulated simultaneous expression of multiple glucose transporter isoforms in malignant cells and tissues. Anticancer Res. 1997;17(6):4299–4304. [PubMed] [Google Scholar]
- 70.Young CD, Lewis AS, Rudolph MC, et al. Modulation of glucose transporter1 (Glut1) expression levels alters Mouse mammary tumor cell growth in vitro and in vivo. PLoS One. 2011;6(8):e23205. doi: 10.1371/journal.pone.0023205. [DOI] [PMC free article] [PubMed] [Google Scholar]
- 71.Rastogi S, Banerjee S, Chellappan S, Simon GR. Glut-1 antibodies induce growth arrest and apoptosis in human cancer cell lines. Cancer Lett. 2007;257:244–251. doi: 10.1016/j.canlet.2007.07.021. [DOI] [PubMed] [Google Scholar]