

Abstract
Introduction
Evidence suggests that FOXP3+CD25highCD4+ regulatory T cells (Treg) which accumulate in cancer may have beneficial or unfavorable effects on prognosis. The presence in tumor-associated inflammatory infiltrates of two subsets of Treg with distinct phenotypic and functional profiles might explain these conflicting observations.
Areas covered
Human inducible (i) Treg arising by tumor-driven conversion of conventional CD4+ T cells are highly suppressive, therapy-resistant Treg which down-regulate anti-tumor immune responses, promoting tumor growth. Natural (n) Treg, normally responsible for maintaining peripheral tolerance, control cancer-associated inflammation, which favors tumor progression. This division of labor between nTreg and iTreg is not absolute, and overlap may be common. Nevertheless, iTreg play a critical and major role in cancer and cancer therapy. The tumor microenvironment determines the type, frequency and suppression levels of accumulating Treg.
Expert opinion
In cancer, a selective removal or silencing of iTreg and not of nTreg should be a therapeutic goal. However, the implementation of this challenging strategy requires further studies of cellular and molecular crosstalk among immune cells in the tumor microenvironment.
Keywords: cancer, inducible (i) regulatory T cells (iTreg), natural (n) regulatory T cells (nTreg), Treg depletion, tumor microenvironment
1. Introduction
In the last decade, regulatory T cells (Treg) have become a focus of multiple studies, and their importance in immune regulation has been extensively examined [1,2]. There is little doubt that this small subset of CD4+ T cells plays a critical role in maintaining the immune balance in health, and that disturbances in Treg are associated with various diseases. For example, it is well established that Treg are essential for the control of autoimmune responses [3,4], and that their accumulations in tissues or peripheral blood of patients with cancer are responsible for suppression of anti-tumor immune effector Tcell functions [5]. However, the more information about Treg accumulates, the more difficult it is to define their precise phenotypic and functional profiles and to sort out the mechanisms these cells use to mediate suppression. It may be that the difficulties we are faced with are related to the tremendous plasticity of CD4+ T cells in general [6] and of Treg in particular [7]. Current evidence suggests that environmental factors play a critical role in the generation, activation and functions of Treg [7].
Attributes of Treg present in cancer patients and Treg significance in cancer progression have been recently reviewed [1,5]. The picture that emerges is by no means clear, however. Much of what we now know of Treg and their role in cancer comes from in vivo studies in tumor-bearing mice. Indeed, the knowledge of surface markers, transcription factors and molecular as well as cellular pathways engaged by Treg mediating immune suppression in the tumor microenvironment is largely a result of in vivo analyses in various mouse models of tumor progression or therapy-induced tumor regression. Not surprisingly, studies of human Treg have been limited by considerable difficulties with their isolation from tumor tissues or patients’ peripheral blood. Treg purification and functional characterization require cell numbers that are difficult to routinely procure from cancer patients. Nevertheless, as our expertise in characterizing the phenotype and functions of human Treg grew, so did our insights into the complexity of their interactions with other immune and non-immune cells. It is becoming evident that murine studies may not be adequately informative about human Treg. This is because each human tumor creates its own unique microenvironment and organizes its own immune milieu. Since the local tumor microenvironment determines the role of Treg in human cancer, Treg found in an environment dominated by immunosuppressive human tumors represent distinct populations of Treg that acquire properties necessary for the control of immune interactions taking place in situ.
The purpose of this review is to present evidence indicating that subsets of Treg present in cancer are distinct from thymus-derived FOXP3+ natural (n) Treg responsible for maintaining peripheral tolerance in healthy individuals. These tumor-induced suppressor cells, called adaptive or inducible Treg (iTreg, Tr1) arise and differentiate in the periphery in response to environmental signals, e.g., tumor-derived antigens, cytokines or other soluble factors, and mediate powerful suppression of anti-tumor effector T cell (Teff) functions by a variety of mechanisms [8,9]. Further, iTreg can assume functions that either favor tumor growth by down-regulating activity of anti-tumor immune cells or inhibit tumor progression by suppressing inflammation, which is thought to contribute to cancer development [10]. Therefore, the consequences of iTreg presence and activity in cancer and pre-cancerous inflammatory lesions may be profound. Their depletion may or may not be beneficial to cancer patients, depending on the environmental context.
2. Diversity of human Treg parallels that of Teff
It has been appreciated for sometime now that human CD4+ effector T cells (Teff) are functionally heterogenous and can be categorized into several subsets based on transcription factors they utilize for differentiation, cytokines they produce and pathogens they can control [11]. While IFN-γ-producing T helper Type-1 (Th1) cells require Tbet transcription factor for differentiation and removal of intracellular pathogens, IL-4-producing Th2 cells express GATA-3 and handle large extracellular parasites. The transcription factors RORγt and RORα are necessary for differentiation of Th17 cells which produce IL-17 and mediate responses targeting extracellular bacteria and fungi. The IL-22-producing Th22 cells reside in the skin and appear to be responsible for immune and inflammatory reactions at this location [12–14]. Further, these various subsets of CD4+ Teff express different chemokine receptors and presumably differentially migrate to distinct inflammatory sites [15]. Thus, recent data clearly indicate that Teff represent not one but many different subsets of cells, each responsible for a specific activity [11]. The question, therefore, arises as to how functions of these various subsets of Teff are regulated by Treg. One possible option is that like conventional Teff, Treg can also differentiate into specialized subsets equipped to control various types of immune responses. A recently performed phenotypic and functional analysis of FOXP3+ Treg in the peripheral circulation of normal donors revealed the presence of four distinct Treg subpopulations [14]. Largely based on the chemokine receptor expression, expression of Th-associated transcription factors and a different cytokine profile as well as a distinct ability to respond by proliferation to recall antigens, human Treg were shown to possess a remarkable degree of specialization. A phenotypic and functional concordance between different Teff and Treg subsets was demonstrated, so that Treg subsets shared transcriptional and chemokine receptor profiles with Th subsets they regulated [14]. The discovery of this concordance implies that Treg specialize in their ability to control only Teff subsets that they phenotypically mimic and that like CD4+ Th cells, Treg represent a diverse population of lymphocytes [14].
Given this recently described and previously unappreciated degree of phenotypic and functional diversity of human Treg in healthy donors, it becomes critical to ask whether this division of labor is maintained in disease and whether Treg that expand and accumulate under specific pathologic conditions are uniquely equipped to regulate immune responses in situ. More relevant to the topic at hand is the question of whether Treg in the peripheral circulation and at tumor sites of patients with cancer differ from those seen in healthy donors. To address this issue, we are limited to proposing a simpler view of the Treg diversity than that featured by Duhen and colleagues as described above [14]. At this time, there is a conspicuous lack of evidence for phenotypic and functional concordance between Treg and Teff subsets in cancer. Based on available insights and in part supported by our data discussed below, it seems reasonable to assume that Treg circulating in the blood of healthy donors largely represent thymus-derived nTreg responsible for maintaining peripheral tolerance, while those present in cancer patients are enriched in adaptive or iTreg. Although this paradigm might be simplistic, it allows for an initial discrimination between Treg subsets in health and disease using the data accumulated so far.
3. Phenotypic characteristics of human Treg
Ever since nTreg have been first described in 1990s by Sakaguchi and colleagues [16] as a subset of CD4+ T lymphocytes (about 5% of total CD4+ T cells) constitutively expressing low affinity IL-2R alpha chain (CD25) and capable of inhibiting immune responses to self and non-self antigens, the phenotypic characteristics of these cells have been debated. To begin with, murine, and later human, nTreg were characterized by expression of FOXP3, a transcription factor forkhead box p3, belonging to the forkhead/winged-helix family [17,18]. The development of Treg depends on FOXP3, and its expression is required for the ability of CD4+ T-cell populations to mediate immune suppression by inhibiting proliferation and IL-2 production in Teff [19]. The absence of FOXP3+ Treg was shown to result in autoimmune disease [18,19]. In man, CD4+ Treg which suppressed proliferation of other T lymphocytes in CFSE-based assays were also shown to express FOXP3 [20]. To date, FOXP3 expression is considered a correlate of suppressor function, and FOXP3 remains in use as the specific marker of Treg in man. However, evidence that FOXP3 is detectable by flow cytometry or RT-PCR methods in other cells, including activated CD4+ T lymphocytes and even some tumor cells [21–23], suggested a need for a more stringent examination of FOXP3 expression in Treg. It was discovered that its stable expression in Treg depends on the demethylation status of the foxp3 gene [24,25]. The relevant sequence of the foxp3 gene is called “Treg-specific demethylated region” or TSDR. Sequencing is now available to precisely discriminate Treg from activated non-Treg [25]. Nevertheless, intracellular localization of FOXP3 in Treg makes it unsuitable for their isolation.
The IL-2 receptor alpha chain (CD25) has also been a commonly used marker for Treg discrimination. CD25 is expressed on the cell surface and has been successfully used for Treg isolation from tissues and peripheral blood. However, only CD4+CD25high T cells are considered as immuno-suppressive Treg [26], so that it is the level of CD25 expression and not its presence that discriminates Treg from conventional T cells (Tconv). Because CD25 is also expressed in activated CD4+ or CD8+ T cells which have no suppressive activity [27], gating on CD4+CD25high T cells has to be used for Treg selection. Defining the cut-off level for CD25high Treg is often arbitrary, and because of this, Treg discrimination based on the mean fluorescence intensity of CD25 has not been entirely reliable. Other surface molecules expressed on Treg have been considered as cell markers able to reliably identify Treg and allow for their isolation The cytotoxic T lymphocyte antigen-4 (CTLA-4, CD152), the glucocorticoid-induced tumor necrosis factor receptor (GITR) and ICOS as well as Programmed-death-1 (PD-1) [28–31] are all expressed on human Treg, but neither is specific for Treg. Similarly, the Treg-associated chemokine receptors CCR4 (CD194), CCR6 (CD196), and CCR7 (CD197) are also found on other T cells [32–35]. While these various surface markers cannot be used to distinguish or isolate Treg, their presence endows Treg with special functions, which are important for Treg-mediated suppression. For example, the chemokine receptors are critical for Treg migration [35]. GITR is a co-stimulatory molecule involved in the regulation of Treg functions [36], including activation, cytokine/chemokine production and migration [37]. A relatively new marker, HELIOS, an Ikaros family transcription factor, is said to be present on nTreg but not on iTreg [38,39]. However, more recent data indicate that HELIOS may not be as reliable in discriminating nTreg from iTreg as originally reported [40].
The absence from Treg surface of certain markers such as the IL-7-receptor, CD127, and an integrin alpha subunit, CD49d, that are expressed on Tconv has been utilized for Treg isolation from PBMC by negative selection [41–43]. Confirmatory expression of FOXP3 and/or CD25high in isolated CD4+ T cells identifies them as Treg [43]. However, this method of Treg enrichment also does not provide a distinct cut-off in expression levels between Treg and Tconv in flow cytometry, so that the gate setting for these markers is also an arbitrary decision. Treg also lack CD45RA and are CD45RO+, i.e., they belong to the memory lymphocyte subset. By ex vivo gating on CD4+CD45RO+CD25highCD127low Treg and probing their chemokine and cytokine expression, Duhen et al. identified four distinct Treg subsets which were analogous to the Th populations expressing the same chemokine receptors and producing the same cytokines thus linking Th with Treg subsets [14]. Interestingly, most (90%) of the cells within each of these Treg subset were FOXP3+ and CTLA-4+ and expressed HELIOS, potentially identifying them as nTreg [38,39].
Yet another surface marker, CD39, has been recently described in murine and human Treg [41–46]. CD39 is an ectonucleotidase which hydrolyzes exogenous ATP to ADP and 5′AMP. Further hydrolysis of 5′AMP by another ectonucleotidase, CD73, yields adenosine, a well known immunosuppressive factor [47]. CD39 was defined as a new functional surface marker for human Treg, as it defines a subset of CD4+ T cells which mediate suppression, at least in vitro [46,48]. Because of its stable surface expression on Treg, CD39 is suitable for positive selection of Treg from CD4+ T cells [46]. The absence of CD26, a dipeptidyl peptidase IV, from the surface of CD39+ Treg can further facilitate their isolation and purity by concomitant removal of CD4+CD26+ T cells, as we recently reported [49]. A method for Treg isolation based on the depletion of CD4+CD26+ T cells has been published by another group as well [50]. Importantly, CD26 is an anchor protein for adenosine deaminase (ADA), an enzyme responsible for hydrolysis of adenosine to inosine [49]. Its absence from the surface of CD39+ Treg might be an indication that Treg are resistant to suppressive effects of adenosine and, as recently reported in mice, are dependent on autocrine adenosine-mediated signals delivered via the A2AR binding for differentiation and expansion [51]. While murine Treg express CD73 in addition to CD39 on the cell surface, in human Treg, CD73 appears to be localized in the cytosol, and vigorous permeabilization is required to show its coexpression with CD39 in Treg (our unpublished data). In our hands, CD39 and CD73 were coexpressed on the surface of iTreg [52]. We recently reported that human Treg selected by surface expression of CD39 from PBMC of healthy donors consist of two closely interacting cell subsets, a subset of CD25+FOXP3+ cells, which mediate suppression, and a subset of CD25negFOXP3neg cells which are not able to suppress T cell proliferation but always accompany FOXP3+ Treg, perhaps serving as precursor cells [53,54]. Similar data were reported by others [48,55]. These FOXP3neg “precursor cells” are CD39+ and are capable of ATP-hydrolysis to AMP, which is an A1R agonist as recently reported [56] and presumably delivers a pro-inflammatory signal to A1R+ T cells. While the CD39+FOXP3+ subset can be operationally considered as suppressor cells, the role of both these subsets in mediating immunosuppression remains unclear.
Attempts to separate human CD4+ T cells into subsets of nTreg, iTreg and Tcon cells based on phenotypic markers have led to a considerable confusion. This is because these cells are composed of different subsets, which acquire or loose markers depending on the state of cellular differentiation and activation. To illustrate the problem, the following chart is provided for CD4+ T-cell populations:
Tconv: CD45RA+/−CD25+/−FOXP3−CD39−CD73+/−CD26+
nTreg: CD45RA+/−CD25hiFOXP3hiCD39+CD73+/−CD26−
iTreg: CD45RA−CD25loCD122+FOXP3loCD39+CD73+CD26−
Because the expression of phenotypic markers changes as these Treg become activated, a consistent phenotype for human Treg subsets cannot be defined at present. Nevertheless, some of the markers may be helpful in discriminating iTreg from nTreg. For example, intracytoplasmic expression of CD73 in CD39+ nTreg vs. its surface expression in iTreg could help in discriminating these cells. The presence of CD26 on Tconv and its absence on Treg may be useful. Still, the functional definition of suppression remains the only reliable distinguishing factor for human Treg at this time.
4. Phenotypic characteristics of Treg in cancer
Treg obtained from tumor tissues or the peripheral circulation of cancer patients are in many respects different from those found in the circulation of normal donors. Comparisons of the phenotypes indicate that cancer patients’ Treg look more like in vitro generated Tr1 than nTreg present in the blood of normal donors [57–59]. These comparisons were possible because of the in vitro model for the generation of iTreg (also referred to as Tr1 cells) we have established and described [59]. In this model, Tr1 cells are induced from CD4+CD25neg T cells in the presence of autologous dendritic cells (DC), lethally irradiated tumor cells and low doses of IL-2, IL-10 and IL-15 (Figure 1A). After a 10 day coculture, the phenotypic and functional characteristics of outgrowing CD4+ T cells can be determined and compared to those of Treg present in the blood of normal donors or patients with cancer [58]. The differences we observed between Tr1 cells and Treg obtained from normal donors were both qualitative (e.g., FOXP3 was not expressed in many Tr1 cells) and quantitative (e.g., upregulation or down-regulation of the surface markers characteristic of nTreg). A substantial proportion of CD39+ iTreg generated in vitro coexpressed surface CD73 as shown in Figure 2. Further, CD39+ TIL isolated from human tumors were also CD73+ (our unpublished data), suggesting that upregulation of CD73 expression occurs in the tumor milieu. These data are consistent with reports that antigenic stimulation of mouse Treg significantly upregulated CD73 expression and activity [60]. Low levels of FOXP3 expression in Tr1 corresponded to the down-regulation of CD25 (IL-2Rα) and upregulation of CD123 (IL-2Rβ) and CD132 (IL-2Rγ) expression on their surface (Figure 1B). Tr1 cells expanding in cocultures expressed IL-10 and mediated suppression of proliferation upon culture with autologous CSFE-labeled responder T cells (Figure 1C). Importantly, circulating Treg of cancer patients were found to have the same characteristics, as we previously reported [58,59] and as illustrated in Figure 3. In addition, we observed that CD39 expression on the surface of CD4+CD39+ Treg in the circulation of patients with head and neck squamous cell carcinoma (HNSCC) were significantly up-regulated relative to CD4+CD39+ Treg in normal donors (our unpublished data). In aggregate, it appears that Treg present in the peripheral blood and at tumor sites of cancer patients have phenotypic characteristics resembling those seen in Tr1 cells generated in our cocultures (Figure 3). Also, the phenotype of iTreg whether generated in cocultures or determined ex vivo in PBMC obtained from cancer patients was distinct from that of nTreg in the circulation of normal donors.
Figure 1. Inducible Treg (Tr1) generated in co-cultures with tumor cells.

A. A schematic of the co-culture of purified CD4+CD25neg T cells with autologous immature dendritic cells (iDC), irradiated HNSCC cells and cytokines used for Tr1 generation. B. Phenotypic characteristics of human Tr1 cells generated in 10 day co-cultures and compared with conventional CD4+ T cells cultured in the presence of anti-CD3/anti-CD28 mAb and IL-2 for 10 days. Asterisks indicate significant (p < 0.01) differences in the % positive cells. The data are from 5 independent experiments. C. Functional properties (proliferation or IL-10 production) by T cells expanding in co-cultures over 10 days. The data were generated with T cells from one of the co-cultures described above.
Figure 2. Expression of CD73 on Tr1 cells generated in co-cultures of CD4+CD25neg T cells with irradiated tumor cells, autologous DC and cytokines as shown in Figure 1.
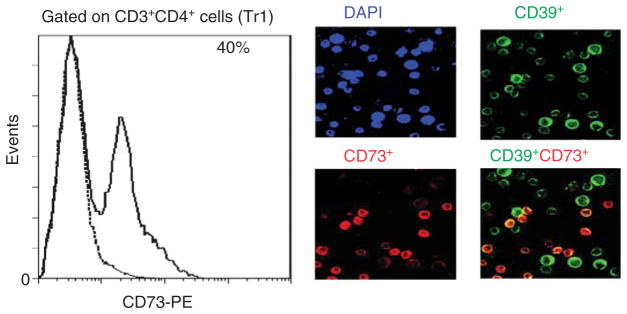
Flow cytometry shows surface expression of CD73 on 40% of Tr1 cells (solid line). Isotype control is shown as a dotted line. Tr1 cells from another co-culture were also stained with anti-CD39 (FITC) and anti-73 (PE) antibodies and examined for co-expression of the two ectonucleotidases in a wet mount by fluorescence microscopy. In A, DAPI control; B, CD39+ cells; C, CD73+ cells; D. merged view with a yellow color identifying Tr1 cells co-expressing CD39 and CD73. Original mag × 400. Courtesy of Drs. M. Mandapathil (flow cytometry) and M. Harasymczuk (fluorescence microscopy).
Figure 3. The presence of Tr1-like cells at tumor sites and in the peripheral circulation of patients with cancer.

A. Expression of CD4+ T cells co-expressing CD132 and TGF-β infiltrating human HNSCC. A frozen tumor section stained with mAbs to CD4; CD132 and TGF-β and examined in a fluorescence microscope. Mag × 600. B. Flow cytometry data (reproduced with permission from ref. 57 by Bergmann et al.) for expression of CD132, TGF-β, IL-10 and IL-4 in CD3+CD4+ lymphocytes in PBMC or TIL of a representative HNSCC patient.
Our results suggest that iTreg (Tr1) may be the major suppressor cell subset present in the cancer patients’ peripheral circulation and at tumor sites [58,61]. The two subsets of regulatory cells, nTreg and iTreg, represent distinct lineages of CD4+ T cells, and since in the tumor microenvironment rich in TGF-β as well as adenosine, iTreg differentiation appears to be favored, they outnumber nTreg. They also acquire capabilities to suppress and are characterized by high levels of suppressor functions. If iTreg are the major CD4+ cell subset mediating suppression in cancer, their phenotypic and functional features are of special interest. It is, therefore, critical to monitor not nTreg but iTreg in patients with cancer, bearing in mind that these two Treg subsets have distinct phenotypic profiles.
5. Treg functions in cancer
The ability to mediate suppression of Tconv functions remains the key characteristic of Treg. It is always more important, although more difficult, to measure suppressor function in addition to phenotyping Treg. It is also important to remember that several different molecular pathways responsible for suppression exist [62–65] and may or may not be utilized by Treg present in cancer patients’ blood or tissues. Suppressor cell assays usually measure inhibition of responder T-cell proliferation or cytokine production and involve coculture of Treg with Tconv at different Treg/Tconv cell ratios. These cocultures require large numbers of preferably freshly-harvested cells, which are often not available. More recently, the proliferation inhibition assays have been replaced by flow cytometry-based cytokine assays, which can be performed with relatively few cryopreserved and thawed lymphocytes [66,67]. Assays for intracytoplasmic cytokine expression have been successfully used as surrogate functional markers for iTreg in our laboratory [54]. For example, the frequency of iTreg which use TGF-β or IL-10 for suppression and express TGF-β-associated membrane-associated GARP (gar-pin) and LAP (latency-associated peptide) has been measured by flow cytometry [54]. We have previously reported that, iTreg generated in cocultures in the presence of COX-2+ tumor cells were COX-2+, produced PGE2 and expressed CD73 on the cell surface [61]. This allowed for the discrimination of Tr1 from IL-10+ and TGF-β+ Treg by flow cytometry [61]. With a greater emphasis on establishing the phenotype of cells mediating suppression, new methods able to measure aberrations in the T-cell receptor-induced Ca2+, NF-κB and NFAT signaling in Tconv have been recently introduced, providing a broader repertoire of suppression assays that can be used with human cells [68].
Treg obtained from human solid tumors or cancer patients’ blood, have significantly higher suppressor functions than nTreg isolated from the blood of normal donors [58,69–71]. Using CFSE-based suppression assays, we evaluated the frequency of FOXP3+CD25high Treg and their suppressor functions, respectively, in isolated tumor-infiltrating lymphocytes (TIL) obtained from tumors and the peripheral circulation of untreated patients with HNSCC [69]. The frequency and function of Treg in the tumor as well as the patients’ blood were significantly increased relative to values seen in the blood of age- and sex-matched normal donors. Treg were more numerous and mediated significantly higher suppression in HNSCC patients with T3/T4 tumors, nodal involvement and advanced disease than in patients with T1/T2 tumors and early disease [58]. The data suggested that a high frequency of FOXP3+CD25high Treg and, as shown later of CD4+CD39+ Treg, in the tumor and peripheral blood, was associated with poor prognostic parameters in HNSCC [71].
In vitro generated iTreg and those isolated from human tumors not only mediate stronger suppression than nTreg [70,71] but they also utilize a broader range of mechanisms to induce suppression than nTreg [72]. In addition to IL-10 and/or TGF-β, iTreg can employ the Fas/FasL or perforin/granzyme pathways as well as adenosine and PGE2 for suppression [63,64,72]. Preliminary data suggest that subpopulations of iTreg might “specialize” in the type of regulatory mechanisms they prefer to employ depending on the environmental context. This functional heterogeneity of iTreg may account for difficulties in assigning to them a definitive phenotype.
The origin of iTreg remains unclear, although they seem to arise by the conversion of Tconv responding to signals generated in situ. In the tumor microenvironment, these are likely to be tumor-derived signals, such as TGF-β or adenosine specifying immune suppression and conversion of Tconv into Treg [54]. Adenosine is known to down-modulate functions of a variety cell types signaling via adenosine receptors (A1, A2A, A2B, and A3) which are differentially expressed on these various cells [73]. Human iTreg express mRNA for A2AR aswell as A1 (our unpublished data). This suggests that in addition to their ability to produce adenosine, iTreg could utilize adenosine binding via A2AR and A1R as well as 5′AMP binding via A1R [56]. Although the precise nature of signals delivered via these adenosine receptors to iTreg is unknown, and the mechanisms involved in iTreg differentiation have not been defined, new data suggest that expansion of iTreg is promoted by agonists of A2A receptors, including adenosine, as reported by Sitkovsky and colleagues [51]. Working in mice, they observed that adenosine, which iTreg produce and use for inhibiton of pro-inflammatory pathways, can also act as an autocrine growth-promoting factor and a stimulator of Treg-mediated suppressor functions [51]. This finding further emphasizes the key role of the adenosinergic pathway in iTreg generation, expansion and suppressor functions in the tumor microenvironment.
CD39+ Treg are also involved in the hydrolysis of extracellular ATP, which accumulates in inflammatory sites, thus disposing of an ATP excess and attenuating its toxic effects [74]. ATP could also serve as a recruiting signal for Treg, which express purinergic P2X7 receptors [74], and this mechanism might be in part responsible for Treg accumulations at tumor sites. It is also interesting to note that CD4+ T cells with characteristics similar to those of iTreg present in cancer patients are found in chronic inflammatory lesions and chronic viral infections such as HIV-1 or HPV [75].
Together, these observations suggest that the presence of iTreg in cancer patients’ tissues and blood has to be taken into account when measurements of Treg are planned, and looking for CD4+FOXP3+ nTreg might greatly underestimate the frequency of suppressor cells. In this respect, CD26, CD39, and CD73 expression on CD4+ Treg and enzymatic activities of these proteins might be especially useful as markers of cancer-associated iTreg (Figure 4).
Figure 4.
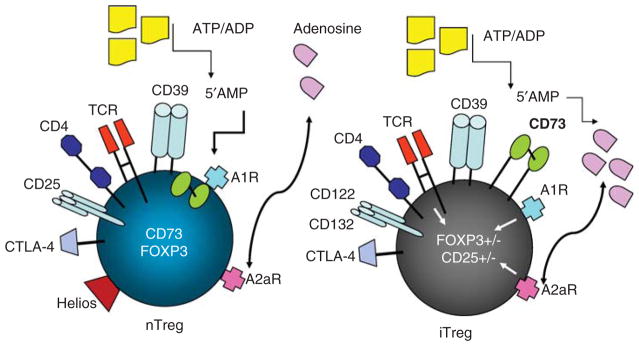
Schematic overview of human nTreg and iTreg emphasizing their distinct phenotypes and functional attributes in respect to adenosine signaling and adenosine production.
6. FOXP3+ Treg, iTreg and cancer prognosis
Since FOXP3 emerged early on as the marker of Treg, most of the investigators have depended on expression of FOXP3 mRNA to identify CD4+ T suppressor cells. With the development of FOXP3-specific antibodies suitable for immunohistochemistry (IHC) and/or flow cytometry, it became possible to convincingly document accumulations of FOXP3+ Treg in tumor tissues and blood of cancer patients. In tumors or tumor-involved lymph nodes, FOXP3+ lymphocytes were found to be prominently present [e.g., 76]. With FOXP3-specific antibodies, it has been possible to enumerate FOXP3+ Treg in human paraffin-embedded tumor tissue sections. In many instances, numbers of FOXP3+ cells in the tumor were correlated to poor prognosis [76–78]. The general conclusion of many such in situ studies was that FOXP3+ Treg accumulations in tumors predicted poor outcome, presumably because these Treg suppressed anti-tumor immune responses. However, the presence of FOXP3+ Treg in the tumor was not linked to poor prognosis in many other studies, including those by Fridman’s group in colorectal carcinoma (CRC) [79,80]. These studies suggest that in CRC, high density infiltrates of CD8+ Teff and FOXP3+ Treg are associated with improved outcome. The existing discrepancy in results of these in situ studies suggests several possibilities: (i) that not all cells mediating suppression are FOXP3+; (ii) that cells scored by IHC as FOXP3+ are not Treg but activated Teff or other cells; or (iii) that FOXP3+ Treg are not the only suppressor cells in some types of human cancer.
The frequency of FOXP3+ Treg was also found to be elevated in the peripheral blood of most cancer patients relative to normal donors (reviewed in [1]). In many but not all studies, the elevated frequency of FOXP3+ Treg in the circulation and/or tumor tissues correlated with the presence of advanced disease and predicted poor outcome [76–78]. This might be expected, as Treg are able to inhibit anti-tumor immunity and mediate immune tolerance favoring tumor growth. In this context, Treg could be viewed as the major component of tumor escape from the host immune system and thus could serve as a marker of poor prognosis and might represent a new a target for immunotherapy. However, in a handful of reports, the frequency of circulating FOXP3+ Treg was either not increased or was not associated with worse prognosis [81]. In some cancers, notably CRC, the presence of FOXP3+ Treg has been linked to an improved prognosis. Ghiringhelli and colleagues, recently examined all published studies referring to FOXP3+ T cell infiltration and prognosis in CRC [82]. They report a uniform agreement on a significant positive correlation between dense FOXP3+ T cell infiltrations and improved prognosis and/or survival in CRC [82]. In patients with head and neck cancer, infiltration by FOXP3+CD4+ Treg was positively associated with a better locoregional control of the tumor [83]. Although several explanations for such confounding results are possible, one is the reliability of FOXP3 as a specific marker for Treg. Possibly, CD4+CD25+ T cells considered to be Treg in some studies were, in fact, activated CD4+ T cells. As a specific marker for human Treg is not yet available, the studies linking the frequency of Treg with prognosis have to be viewed with caution. Another explanation may be that FOXP3 expression can be down-modulated in some circumstances. For example, studying ATP-mediated P2X7 signaling in mice, where purinergic-type P2X7 receptors are prominently expressed on Treg, Schenk and colleagues observed down-regulation of FOXP3 expression and reduced Treg-mediated suppression [74]. In human tumors, which are enriched in ATP and in expanding iTreg, conditions might favor a loss of FOXP3. Incidentally, such a loss was shown to promote conversion of Treg to IL-17+ T helper (TH17) cells in mice [74]. Overall, it appears that local environment can regulate FOXP3 expression in Treg recruited to the tumor, and since this environment is unique for each human tumor, the differences in Treg frequency and function as well as variable correlations with prognosis reported so far are not surprising and should be taken judiciously.
To date, tissue and blood studies of Treg in cancer are inconclusive in respect to the role of these cells in disease progression. It is unclear whether this role is minor or major depending on the tumor type or whether suppression of inflammation by Treg has different effects on tumor growth in different types of cancer. These studies are inconclusive perhaps because of the well-recognized biologic heterogeneity of human tumors and because in cancer, the host immune system, including Treg, may be variably modulated by tumor-derived factors. Preliminary results in mice and man suggest that FOXP3 positivity is not a specific attribute of all Treg and thus may be inadequate for discrimination of Treg in cancer.
7. FOXP3+ Treg vs. iTreg in cancer therapy
The role of Treg in cancer therapy, similar to their prognostic value, remains controversial. If Treg infiltrations are associated with better outcome in cancer, then their depletion is contraindicated. But if FOXP3+ Treg interfere with the host’s anti-tumor immunity thus promoting tumor progression, their depletion is desirable. Further, Treg presence and activities might interfere with immunotherapy. This latter view has dominated the oncology field, and it is still widely believed that in vivo elimination of Treg may restore or enhance anti-tumor immunity and increase the efficacy of immunotherapy.
Immunomodulatory properties of the low-dose cyclophosphamide regimen are well known, and Treg depletion by cyclophosphamide has been linked to the recovery of T-cell immune responses in various animal cancer models [84]. However, Treg depletion by cyclophosphamide appears to be less effective in humans, and it generally fails to enhance the potency of cancer immunotherapies [85,86]. Other Treg-depleting regimens used to improve endogenous anti-tumor immunity or the efficacy of immunotherapies include administration of daclizumab (anti-CD25 Ab), denileukin diftitox also known as ONTAK or tyrosine kinase inhibitors such as Sunitinib [87–89]. These anti-Treg regimens transiently reduce Treg numbers in the patients’ blood. In aggregate, results of clinical trials with Treg-depleting therapies in cancer patients suggest that indiscriminate elimination of CD25+ T cells especially those induced by a vaccine, interferes with anti-tumor functions of Teff without a persistent impact on CD25+ Treg. The latter appear to be resistant to these treatments, and while their frequency in the circulation initially decreases, it soon recovers to the original or even higher frequency [57,71]. The impact of the above listed Treg-depleting agents on the frequency of FOXP3+ Treg, was recently investigated in patients with melanoma treated with anti-tumor vaccines [90]. To follow the fate of circulating Treg with demethylated FOXP3 intron 1, an MS-qPCR method was used [90]. None of the three depleting strategies resulted in sustained reduction in circulating FOXP3+ Treg frequency that exceeded 50%. In most patients, this reduction was much more modest, while the treatment with IL-2 used as control, increased the frequency of circulating FOXP3+ Treg at least two fold [90].
More recent clinical studies indicate that effects of cancer therapy on FOXP3+ Treg are complex. A Phase-III study of melanoma patients treated with high-dose IL-2 alone or in combination with a peptide vaccine reported an association between the Treg frequency and clinical responses [91]. The responding patients enrolled in the IL-2 plus vaccine arm had a significantly higher Treg frequency than the patients who did not clinically respond [91]. Here, the results point to a beneficial clinical role of expanded Treg. In another study, tumor specimens obtained from colon cancer patients prior to systemic chemotherapy were evaluated for tumor infiltration by FOXP3+ Treg [92]. In patients with tumors characterized by high numbers of infiltrating Treg, overall survival, progression-free survival and treatment-relative survival were all significantly higher relative to patients whose tumors were poorly infiltrated with FOXP3+ Treg [92]. It appears that therapies inducing anti-tumor immune responses also increase the frequency of Treg and that clinical responses and prognosis in cancer may be influenced by Treg. If so, then it becomes highly important to determine whether Treg depletion is necessary or effective in improving results of cancer immunotherapy. Perhaps Treg expansion rather than depletion is advisable. The finding that not only immune therapies but also chemoradiotherapies increase the frequency of Treg [57] further emphasizes the need for a better understanding of Treg role in therapy of cancer. In the future, it will be essential to conduct carefully designed randomized clinical trials that are based on new insights into the Treg biology to confirm the impact of changes in the Treg frequency and functions on outcome in cancer.
Regarding future clinical strategies for elimination or expansion of Treg, several aspects of the Treg biology are important. First, is the question of what type of Treg should be therapeutically targeted in cancer. If iTreg (Tr1) are shown to have a major role in cancer progression, their selective depletion may become necessary. They are induced in the tumor microenvironment and empowered by the tumor to block anti-tumor immunity. Fortunately, iTreg have distinct phenotypic and functional attributes [58]. For example, human iTreg express CD39 and CD73 and effectively utilize the adenosinergic pathway [52,61]. In cancer or chronic infections, it is these iTreg recruited and conditioned by the environment that mediate high levels of suppression by producing adenosine and upregulating 3′, 5′-cAMP levels in Teff [93]. We have previously discussed pharmacologic strategies available for silencing of these iTreg [72].
Second, evidence indicates that Treg are resistant to various therapeutic and non-therapeutic agents known to induce apoptosis and deplete Tconv. In our own experience, HNSCC patients successfully treated with surgery and adjuvant chemoradiotherapy, had a significantly elevated frequency of CD4+FOXP3+CD25high or CD4+FOXP3+CD39+ Treg mediating potent suppression relative to pre-therapy values [57,71]. Further, in some of these patients, numbers of circulating Treg remained elevated for months after the last therapy [57 and our unpublished data]. While the mechanisms of Treg resistance to apoptotic stimuli are not clear and are under investigation, the very fact these Treg survive better than Tconv in an unfavorable milieu emphasizes their biologic significance.
The third aspect to consider is Treg localization to tumor sites, and the fact that tumor-associated Treg are more suppressive than those in the blood [57,58]. If iTreg elimination in the tumor microenvironment is a therapeutic goal, the agent used must be able to reach the tumor site, which seems feasible when antibodies are used. A combination of anti-CTLA-4 and anti-PD-1 blocking antibodies was effective in expanding tumor-infiltrating Teff, while reducing Treg and myeloid cells within the tumors of mice with B16 melanoma [95]. This finding is of great interest, since Ipilimumab, a fully humanized anti-CTLA-4 mAb recently approved for the treatment of advanced melanoma is in clinical trials (e.g., [96],), and it is expected that its in vivo effects on Treg in the human tumor microenvironment will soon be known. Other antibody-based therapies targeting Treg capitalize on the presence of key receptors on these cells. For example, PD-1 blocking antibodies are under investigation for their safety and efficacy in patients with cancer and might not only target tumor cells but also PD-1+ Treg [97]. The glucocorticoid-inducible-TNF-receptor (GITR) could be another promising target for elimination of Treg in the tumor microenvironment. In the B16 melanoma model, the application of the agonistic anti-GITR-mAb, DTA-1, reduced Treg numbers in tumors by around 50% [98]. In addition, treatment with DTA-1 also increased the number of tumor infiltrating CD8+ T cells and their anti-tumor activity [98]. Vaccination of mice with FOXP3 mRNA-transfected DC elicited a robust FOXP3-specific CTL response and potentiated vaccine-induced protective immunity comparably to therapy with anti-CD25 Ab [99]. Further, this vaccination led to the preferential depletion of FOXP3+ Treg in the tumor but not in the periphery [99]. Another potentially promising therapeutic strategy takes advantage of factors regulating the differentiation of Treg in the tumor microenvironment, such as TGF-β. Experiments in mice with B16 melanoma showed that suppressing tumor TGF-β1 expression with siRNA before, during and after delivery of a DC-based vaccine significantly reduced tumor growth [100]. To better understand the nature of factors that favor iTreg induction in the tumor microenvironment and could be selectively blocked in the future, we have utilized the in vitro model for Tr1 induction and culture established in our laboratory [58]. In this coculture model IRX-2, a primary cell derived biologic previously used for therapy of HNSCC favored the induction of Teff over Treg [101]. IRX-2 decreased outgrowth of FOXP3+IL-10+TGF-β+ Tr1, while increasing the frequency of T-bet+IFN-γ+ Teff. IRX-2 also decreased suppressor functions of Treg in this model [101]. Finally, to attenuate the undesirable immunosuppressive effects of iTreg in the tumor, pharmacologic interventions targeting the molecular pathways utilized by these cells might be considered. For example, the cooperation between the adenosinergic and PGE2 pathways, which is regulated at the 3′, 5′-cAMP level and which controls Treg-Teff cell interactions in cancer, represents a promising target for therapies aiming at the restoration of anti-tumor immune responses [72,102]. Using pharmacologic inhibitors, it is possible selectively block production of adenosine or PGE2 or to interfere with the finding of these factors to their receptors on immune cells [72,102]. These and other strategies aimed at achieving depletion of Treg blocking anti-tumor responses will have to be evaluated for their potentially adverse effects on outcome by depleting subsets of Treg that might be beneficial to the host.
8. Expert opinion
Under normal circumstances, whenever CD8+ effector and CD4+ helper Treg accumulate in response to local signals, so do FOXP3+ nTreg to maintain the homeostatic balance and prevent potential tissue damage. In the environment of solid tumors, however, a conversion of Tconv into iTreg occurs, creating a pool of highly activated and indiscriminately suppressive inducible Treg (Tr1), which interfere with functions of anti-tumor effector T cells.
The oncologic community has long been aware of therapeutic difficulties imposed by cancer-associated immune suppression, including the existence of distinct Treg subsets, which mediate suppression of anti-tumor responses and also interfere with immunotherapies. However, the distinction between FOXP3+ nTreg responsible for maintaining peripheral tolerance and iTreg, which may or may not be FOXP3+ when they are induced and corrupted by the tumor to mediate suppression of anti-tumor immunity, has not been fully appreciated. These two Treg subsets represent different parts of the suppression spectrum and presumably respond to different environmental signals.
In inflammation, FOXP3+ nTreg are responsible for control of potentially injurious immune responses. The beneficial role of FOXP3+ nTreg in cancers such as CRC, which are rich in chronic inflammatory infiltrates, is explained by evidence linking chronic inflammation to cancer development: by reducing inflammation, FOXP3+ nTreg interfere with cancer progression. In cancer, it is iTreg that are of greatest concern, especially with aggressive solid tumors able to efficiently convert Tconv to iTreg. These iTreg are a distinct subset of regulatory cells that phenotypically and functionally differ from FOXP3+ nTreg normally in charge of peripheral tolerance. Tumor-associated Tr1 are pro-tumorigenic, as they produce immunosuppressive cytokines (IL-10, TGF-β) and immunoinhibitory factors such as adenosine and PGE2. The presence of iTreg in cancer is linked to a poor prognosis. They are more resistant to oncological therapies than Tconv, and thus increased numbers of iTreg following therapies and persistent suppression of anti-tumor immune responses might create conditions favorable to disease recurrence. Therefore, iTreg need to be depleted or silenced in cancer patients, especially those to be treated with immunotherapy. In contrast, depletion of FOXP3+ nTreg should probably be avoided. For oncological therapies, this may be a difficult and complex challenge. A selective discrimination between nTreg and iTreg to avoid shifting the balance toward autoimmunity and simultaneously achieve robust anti-tumor effects will not be simple. It will require additional knowledge of cellular and molecular mechanisms underlying interactions of iTreg and nTreg within the tumor microenvironment. As each human tumor creates its own unique microenvironment, altering of these interactions by immunotherapy represents a new venture into personalized care of cancer patients.
Article highlights.
Thymus-derived nTreg mediate peripheral tolerance.
Inducible Treg (iTreg, Tr1) mediate tumor-induced suppression.
iTreg accumulate in cancer and their presence predicts poor outcome.
iTreg may be the major subset of suppressor cells in cancer.
nTreg benefit the host when they control inflammation.
nTreg vs. iTreg subsets as “good” vs. “bad” Treg.
Therapeutic Treg depletions should target iTreg not nTreg.
This box summarizes key points contained in the article.
Footnotes
Declaration of interest
Supported in part by the NIH grant PO1 CA109688 to TLW. P Schuler was supported by a grant from the Pittsburgh-Essen Partnership Program.
Bibliography
Papers of special note have been highlighted as either of interest (•) or of considerable interest (••) to readers.
- 1.Mougiakakos D, Choudhury A, Lladser A, et al. Regulatory T cells in cancer. Adv Cancer Res. 2010;107:57–117. doi: 10.1016/S0065-230X(10)07003-X. [DOI] [PubMed] [Google Scholar]
- 2.Allan SE, Broady R, Gregori S, et al. CD4+ T-regulatory cells: toward therapy for human diseases. Immunol Rev. 2008;223:391–421. doi: 10.1111/j.1600-065X.2008.00634.x. [DOI] [PubMed] [Google Scholar]
- 3.Sakaguchi S, Sakaguchi N, Asano M, et al. Immunologic self-tolerance maintained by activated T cells expressing IL-2 receptor alpha-chains (CD25). Breakdown of a single mechanism of self-tolerance causes various autoimmune diseases. J Immunol. 1995;155:1151–64. [PubMed] [Google Scholar]
- 4.Bettini M, Vignali D. Regulatory T cells and inhibitory cytokines in autoimmunity. Curr Opin Immunol. 2009;21:612–18. doi: 10.1016/j.coi.2009.09.011. [DOI] [PMC free article] [PubMed] [Google Scholar]
- 5.Nishikawa H, Sakaguchi S. Regulatory T cells in tumor immunity. Int J Cancer. 2010;127:759–67. doi: 10.1002/ijc.25429. [DOI] [PubMed] [Google Scholar]
- 6.Zhou L, Chong MM, Littman DR. Plasticity of CD4+ T cell lineage differentiation. Immunity. 2009;30:646–55. doi: 10.1016/j.immuni.2009.05.001. [DOI] [PubMed] [Google Scholar]
- 7.Duarte JH, Zelenay S, Bergman ML, et al. Natural Treg cells spontaneously differentiate into pathogenic helper cells in lymphopenic conditions. Eur J Immunol. 2009;39:948–55. doi: 10.1002/eji.200839196. [DOI] [PubMed] [Google Scholar]
- 8.Roncarolo MG, Bacchetta R, Bordignon C, et al. Type 1 T regulatory cells. Immunol Rev. 2001;182:68–79. doi: 10.1034/j.1600-065x.2001.1820105.x. [DOI] [PubMed] [Google Scholar]
- 9.Whiteside TL. Disarming suppressor cells to improve immunotherapy. Cancer Immunol Immunother. 2011;61:283–8. doi: 10.1007/s00262-011-1171-7. [DOI] [PMC free article] [PubMed] [Google Scholar]
- 10.Lin WW, Karin MA. A cytokine-mediated link between innate immunity, inflammation and cancer. J Clin Invest. 2007;117:1175–83. doi: 10.1172/JCI31537. [DOI] [PMC free article] [PubMed] [Google Scholar]
- 11.Zhu J, Paul WE. Peripheral CD4+ T-cell differentiation regulated by networks of cytokines and transcription factors. Immunol Rev. 2010;238:247–62. doi: 10.1111/j.1600-065X.2010.00951.x. [DOI] [PMC free article] [PubMed] [Google Scholar]
- 12.Trifari S, Kaplan CD, Tran EH, et al. Identification of a human helper T cell population that has abundant production of interleukin 22 and is distinct from T (H)-17, T(H)1 and T(H)2 cells. Nat Immunol. 2009;10:864–71. doi: 10.1038/ni.1770. [DOI] [PubMed] [Google Scholar]
- 13.Duhen T, Geiger R, Jarrossay D, et al. Production of interleukin 22 but not interleukin 17 by a subset of human skin-homing memory T cells. Nat Immunol. 2009;10:857–63. doi: 10.1038/ni.1767. [DOI] [PubMed] [Google Scholar]
- 14••.Duhen T, Duhen R, Lanzavecchia A, et al. Functionally distinct subsets of human FOXP3+ Treg cells that phenotypically mirror effector TH cells. Blood. 2012 doi: 10.1182/blood-2011-11-392324. published online 21 March 2012. This recent paper provides evidence for a remarkable diversity of human Treg in the peripheral blood of normal donors. Subsets of Treg with distinct phenotypic features and cytokine/chemokine profiles were identified and shown to regulate functions of T helper cell subsets with a corresponding phenotype. [DOI] [PMC free article] [PubMed] [Google Scholar]
- 15.Sallusto F, Lenig D, Mackay CR, et al. Flexible programs of chemokine receptor expression on human polarized T helper 1 and 2 lymphocytes. J Exp Med. 1998;187:875–83. doi: 10.1084/jem.187.6.875. [DOI] [PMC free article] [PubMed] [Google Scholar]
- 16••.Sakaguchi S, Sakaguchi N, Asano M, et al. Immunologic self-tolerance maintained by activated T cells expressing IL-2 receptor-alpha chains (CD25). Breakdown of a single mechanism of self tolerance causes various autoimmune diseases. J Immunol. 1995;155:1151–64. This is a classical paper which demonstrated that in vivo transfer of activated CD4+ mice depleted of CD25+ cells by specific mAb and C developed autoimmune diseases. Reconstitution with CD4+CD25+ T cells prevented the development of the disease. Thus, CD4+CD25+ cells contribute to maintaining peripheral tolerance and down-regulate immune responses to self. [PubMed] [Google Scholar]
- 17.Gavin MA, Rasmussen JP, Fontenot JD, et al. Foxp3-dependent programme of regulatory T-cell differentiation. Nature. 2007;445:771–5. doi: 10.1038/nature05543. [DOI] [PubMed] [Google Scholar]
- 18.Hori S, Sakaguchi S. Foxp3: a critical regulator of the development and function of regulatory T cells. Microbes Infect. 2004;6:745–51. doi: 10.1016/j.micinf.2004.02.020. [DOI] [PubMed] [Google Scholar]
- 19.Sakaguchi S, Yamaguchi T, Nomura T, Ono M. Regulatory T cells and immune tolerance. Cell. 2008;133:775–87. doi: 10.1016/j.cell.2008.05.009. [DOI] [PubMed] [Google Scholar]
- 20.Canavan JB, Afzali B, Scotta C, et al. A rapid diagnostic test for human regulatory T-cell function to enable regulatory T-cell therapy. Blood. 2012;119:e57–66. doi: 10.1182/blood-2011-09-380048. [DOI] [PMC free article] [PubMed] [Google Scholar]
- 21•.Roncarolo MG, Gregori S. Is FOXP3 a bona fide marker for human regulatory T cells? Eur J Immunol. 2008;38:925–7. doi: 10.1002/eji.200838168. This paper reviews evidence for expression of FOXP3 in T cells other than nTreg. Upon activation, human Teff and Th1 cells can transiently express FOXP3. It also points out that FOXP3-independent mechanisms mediated by IL-10 can contribute to suppressor functions of Tr1. [DOI] [PubMed] [Google Scholar]
- 22.Karanikas V, Speletas M, Zamanakou M, et al. Foxp3 expression in human cancer cells. J Transl Med. 2008;6:19. doi: 10.1186/1479-5876-6-19. [DOI] [PMC free article] [PubMed] [Google Scholar]
- 23.Wang J, Ioan-Facsinay A, van der Voort EI, et al. Transient expression of Foxp3 in human activated nonregulatory CD4+ T cells. Eur J Immunol. 2007;37:129–38. doi: 10.1002/eji.200636435. [DOI] [PubMed] [Google Scholar]
- 24••.Toker A, Huehn J. To be or not to be a Treg cell: lineage decisions controlled by epigenetic mechanisms. Sci Signal. 2011;4:pe4. doi: 10.1126/scisignal.2001783. This paper reports that both induction and stabilization of FOXP3 expression are under epigenetic control. This suggests that interference with chromatin remodeling mechanisms might alter Treg functions. [DOI] [PubMed] [Google Scholar]
- 25••.Polansky JK, Schreiber L, Thelemann C, et al. Methylation matters: binding of Ets-1 to the demethylated Foxp3 gene contributes to the stabilization of Foxp3 expression in regulatory T cells. J Mol Med (Berl) 2010;88:1029–40. doi: 10.1007/s00109-010-0642-1. The authors have shown that epigenetic modifications in the CpG-rich Treg-specific demethylation region (TSDR) in the FOXP3 locus is associated with stable FOXP3 expression. Here they identify the transcription factor Ets-1, which specifically binds to the TSDR in Treg but not to the methylated TSDR in CD4+ Tconv cells. Thus, Ets-1 binds to the TSDR only in its demethylated state, thereby restricting stable FOXP3 expression to the Treg lineage. [DOI] [PMC free article] [PubMed] [Google Scholar]
- 26.Strauss L, Bergmann C, Whiteside TL. Functional and phenotypic characteristics of CD4+CD25highFoxp3+ Treg clones obtained from peripheral blood of patients with cancer. Int J Cancer. 2007;121:2473–83. doi: 10.1002/ijc.23001. [DOI] [PubMed] [Google Scholar]
- 27.Allan SE, Crome SQ, Crellin NK, et al. Activation-induced FOXP3 in human T effector cells does not suppress proliferation or cytokine production. Int Immunol. 2007;19:345–54. doi: 10.1093/intimm/dxm014. [DOI] [PubMed] [Google Scholar]
- 28.Fife BT, Bluestone JA. Control of peripheral T-cell tolerance and autoimmunity via the CTLA-4 and PD-1 pathways. Immunol Rev. 2008;224:166–82. doi: 10.1111/j.1600-065X.2008.00662.x. [DOI] [PubMed] [Google Scholar]
- 29.Franceschini D, Paroli M, Francavilla V, et al. PD-L1 negatively regulates CD4 +CD25+Foxp3+ Tregs by limiting STAT-5 phosphorylation in patients chronically infected with HCV. J Clin Invest. 2009;119:551–64. doi: 10.1172/JCI36604. [DOI] [PMC free article] [PubMed] [Google Scholar]
- 30.McHugh RS, Whitters MJ, Piccirillo CA, et al. CD4(+)CD25(+) immunoregulatory T cells: gene expression analysis reveals a functional role for the glucocorticoid-induced TNF receptor. Immunity. 2002;16:311–23. doi: 10.1016/s1074-7613(02)00280-7. [DOI] [PubMed] [Google Scholar]
- 31.Strauss L, Bergmann C, Szczepanski MJ, et al. Expression of ICOS on human melanoma-infiltrating CD4 +CD25highFoxp3+ T regulatory cells: implications and impact on tumor-mediated immune suppression. J Immunol. 2008;180:2967–80. doi: 10.4049/jimmunol.180.5.2967. [DOI] [PubMed] [Google Scholar]
- 32.Gobert M, Treilleux I, Bendriss-Vermare N, et al. Regulatory T cells recruited through CCL22/CCR4 are selectively activated in lymphoid infiltrates surrounding primary breast tumors and lead to an adverse clinical outcome. Cancer Res. 2009;69:2000–9. doi: 10.1158/0008-5472.CAN-08-2360. [DOI] [PubMed] [Google Scholar]
- 33.Yuan Q, Bromley SK, Means TK, et al. CCR4-dependent regulatory T cell function in inflammatory bowel disease. J Exp Med. 2007;204:1327–34. doi: 10.1084/jem.20062076. [DOI] [PMC free article] [PubMed] [Google Scholar]
- 34.Kleinewietfeld M, Puentes F, Borsellino G, et al. CCR6 expression defines regulatory effector/memory-like cells within the CD25(+)CD4+ T-cell subset. Blood. 2005;105:2877–86. doi: 10.1182/blood-2004-07-2505. [DOI] [PubMed] [Google Scholar]
- 35.Menning A, Hopken UE, Siegmund K, et al. Distinctive role of CCR7 in migration and functional activity of naive- and effector/memory-like Treg subsets. Eur J Immunol. 2007;37:1575–83. doi: 10.1002/eji.200737201. [DOI] [PubMed] [Google Scholar]
- 36.Shimizu J, Yamazaki S, Takahashi T, et al. Stimulation of CD25(+)CD4(+) regulatory T cells through GITR breaks immunological self-tolerance. Nat Immunol. 2002;3:135–42. doi: 10.1038/ni759. [DOI] [PubMed] [Google Scholar]
- 37.Azuma M. Role of the glucocorticoid-induced TNFR-related protein (GITR)-GITR ligand pathway in innate and adaptive immunity. Crit Rev Immunol. 2010;30:547–57. doi: 10.1615/critrevimmunol.v30.i6.40. [DOI] [PubMed] [Google Scholar]
- 38.Thornton AM, Korty PE, Tran DQ, et al. Expressio of Helios, an Ikaros transcription factor family member, differentiates thymic-derived from peripherally induced Foxp3+ T regulatory cells. J Immunol. 2010;184:3433–41. doi: 10.4049/jimmunol.0904028. [DOI] [PMC free article] [PubMed] [Google Scholar]
- 39•.Elkord E, Sharma S, Burt DJ, Hawkins RE. Expanded subpopulation of Foxp3+ T regulatory cells in renal cell carcinoma co-express Helios, indicating they could be derived from natural but not induced Tregs. Clin Immunol. 2011;140:218–22. doi: 10.1016/j.clim.2011.04.014. Induced FOXP3+ Treg (iTreg) do not express Helios, and Ikaros family transcription factor, while natural (n) FOXP3+ T cells are Helios+. IL-2 administration to RCC patients leads to expansion of FOXP3+ Helios+ nTreg rather than FOXP3+ Helios-iTregs. [DOI] [PubMed] [Google Scholar]
- 40•.Gottschalk RA, Corse E, Allison JP. Expression of Helios in peripherally induced Foxp3+ regulatory T cells. J Immunol. 2012;188:976–80. doi: 10.4049/jimmunol.1102964. The authors report that iTreg express Helios, which precludes its use as a marker of thymus-derived Treg. [DOI] [PubMed] [Google Scholar]
- 41.Liu W, Putnam AL, Xu-Yu Z, et al. CD127 expression inversely correlates with FoxP3 and suppressive function of human CD4+ T reg cells. J Exp Med. 2006;203:1701–11. doi: 10.1084/jem.20060772. [DOI] [PMC free article] [PubMed] [Google Scholar]
- 42.Kleinewietfeld M, Starke M, Di Mitri D, et al. CD49d provides access to “untouched” human Foxp3+ Treg free of contaminating effector cells. Blood. 2009;113:827–36. doi: 10.1182/blood-2008-04-150524. [DOI] [PubMed] [Google Scholar]
- 43.Peters JH, Preijers FW, Woestenenk R, et al. Clinical grade Treg: GMP isolation, improvement of purity by CD127 Depletion, Treg expansion, and Treg cryopreservation. PLoS One. 2008;3:e3161. doi: 10.1371/journal.pone.0003161. [DOI] [PMC free article] [PubMed] [Google Scholar]
- 44.Deaglio S, Dwyer KM, Gao W, et al. Adenosine generation catalyzed by CD39 and CD73 expressed on regulatory T cells mediates immune suppression. J Exp Med. 2007;204:1257–65. doi: 10.1084/jem.20062512. [DOI] [PMC free article] [PubMed] [Google Scholar]
- 45.Borsellino G, Kleinewietfeld M, DiMitri D, et al. Expression of ectonucleotidase CD39 by Foxp3+ Treg cells: hydrolysis of extracellular ATP and immune suppression. Blood. 2007;110:1225–32. doi: 10.1182/blood-2006-12-064527. [DOI] [PubMed] [Google Scholar]
- 46.Mandapathil M, Lang S, Gorelik E, Whiteside TL. Isolation of functional human regulatory T cells (Treg) from the peripheral blood based on the CD39 expression. J Immunol Methods. 2009;346:55–63. doi: 10.1016/j.jim.2009.05.004. [DOI] [PMC free article] [PubMed] [Google Scholar]
- 47.Bynoe MS, Viret C. Foxp3+CD4+ T cell-mediated immunosuppression involves extracellular nucleotide catabolism. Trends Immunol. 2008;29:99–102. doi: 10.1016/j.it.2007.12.005. [DOI] [PubMed] [Google Scholar]
- 48.Dwyer KM, Hanidziar D, Putheti P, et al. Expression of CD39 by human peripheral blood CD4+ CD25+ T cells denotes a regulatory memory phenotype. Am J Transplant. 2010;10:2410–20. doi: 10.1111/j.1600-6143.2010.03291.x. [DOI] [PMC free article] [PubMed] [Google Scholar]
- 49.Mandapathil M, Szczepanski M, Harasymczuk M, et al. CD26 expression and adenosine deaminase activity in regulatory T cells (Treg) and CD4+ T effector cells in patients with head and neck squamous cell carcinoma. Oncol Immunol. 2012 doi: 10.4161/onci.20387. In press. [DOI] [PMC free article] [PubMed] [Google Scholar]
- 50.Salgado FJ, Perez-Diaz A, Villanueva NM, et al. CD26: a negative selection marker for human Treg cells. Cytometry A. 2012 doi: 10.1002/cyto.a.22117. In press. [DOI] [PubMed] [Google Scholar]
- 51.Ohta A, Kini R, Ohta A, et al. The development and immunosuppressive functions of CD4+CD25+FOXP3+ regulatory T cells are under influence of the adenosine-A2a adenosine receptor pathway. Frontiers in T Cell Biol. 2012 doi: 10.3389/fimmu.2012.00190. In press. [DOI] [PMC free article] [PubMed] [Google Scholar]
- 52••.Mandapathil M, Hilldorfer B, Szczepanski MJ, et al. Generation and accumulation of immunosuppressive adenosine by human CD4 +CD25highFOXP3+ regulatory T cells (Treg) J Biol Chem. 2010;285:7176–86. doi: 10.1074/jbc.M109.047423. This is the first of two papers describing the ability of human CD4 +CD25highFOXP3+ regulatory cells which express CD39 and CD73 to produce adenosine. This immunosuppressive factor represents one of multiple mechanisms utilized by Treg to down-regulate functions of Teff. Antagonists of the A2A receptor blocked Treg-mediated suppression. The CD39+ Treg are also characterized by low expression levels of CD26/ADA, while Teff are CD26/ADA+ and have strong ADA activity. [DOI] [PMC free article] [PubMed] [Google Scholar]
- 53.Schuler PJ, Harasymczuk M, Schilling B, et al. Separation of human CD4(+)CD39 (+) T cells by magnetic beads reveals two phenotypically and functionally different subsets. J Immunol Methods. 2011;369:59–68. doi: 10.1016/j.jim.2011.04.004. [DOI] [PMC free article] [PubMed] [Google Scholar]
- 54•.Schuler PJ, Schilling B, Harasymczuk M, et al. Phenotypic and functional characteristics of ATP-hydrolysing CD +CD39+ Treg subsets in patients with cancer. Eur J Immunol. 2012 doi: 10.1002/eji.201142347. In press The paper reports that human CD4 +CD39+ Treg contain two subsets of cells differeing in expressionof CD25, FOXP3, CTLA-4, CD121a, PD-1, LAP, GARP and in cytokine profile. Both are present in the circulation of NC and cancer patients with an equal frequency and both hydrolyse ATP to immunosuppressive adenosine. Among CD4+CD39+ Treg, the FOXP3+CD25 + subset expresses TGF-β1 and strongly suppresses functions of Teff, while FOXP3negCD25neg subset serves as a reservoir of cells able to convert to Treg upon stimulation. [DOI] [PMC free article] [PubMed] [Google Scholar]
- 55.Moncrieffe H, Nistala K, Kamhieh Y, et al. High expression of the ectonucleotidase CD39 on T cells from the inflamed site identifies two distinct populations, one regulatory and one memory T cell population. J Immunol. 2010;185:134–43. doi: 10.4049/jimmunol.0803474. [DOI] [PMC free article] [PubMed] [Google Scholar]
- 56•.Rittiner JE, Korboukh I, Hull-Ryde EA, et al. AMP is an adenosine A1 receptor agonist. J Biol Chem. 2012;287:5301–9. doi: 10.1074/jbc.M111.291666. This report shows that 5′AMP directly and preferentially activates adenosine A1 receptor (A1R) but not the adenosine A2B receptor and explains how diverse AMP effects on cells could be due to ectonucleotidase-independent signaling via A1R. [DOI] [PMC free article] [PubMed] [Google Scholar]
- 57.Strauss L, Bergmann C, Gooding W, et al. The frequency and suppressor function of CD4+CD25highFoxp3+ T cells in the circulation of patients with squamous cell carcinoma of the head and neck. Clin Cancer Res. 2007;13:6301–11. doi: 10.1158/1078-0432.CCR-07-1403. [DOI] [PubMed] [Google Scholar]
- 58.Bergmann C, Strauss L, Wang Y, et al. T regulatory type 1 cells (Tr1) in squamous cell carcinoma of the head and neck: mechanisms of suppression and expansion in advanced disease. Clin Cancer Res. 2008;14:3706–15. doi: 10.1158/1078-0432.CCR-07-5126. [DOI] [PMC free article] [PubMed] [Google Scholar]
- 59.Bergmann C, Strauss L, Zeidler R, et al. Expansion and characteristics of human T regulatory type 1 cells in co-cultures simulating tumor microenvironment. Cancer Immunol Immunother. 2007;56:1429–42. doi: 10.1007/s00262-007-0280-9. [DOI] [PMC free article] [PubMed] [Google Scholar]
- 60••.Romio M, Reinbeck B, Bongardt S, et al. Extracellular purine metabolism and signaling of CD73-derived adenosine in murine Treg and Teff cells. Am J Physiol Cell Physiol. 2011;301:C530–9. doi: 10.1152/ajpcell.00385.2010. This is an excellent report exploring the role of adenosine signaling in modulating NFκB activity and cytokine/chemokine production in murine Treg and Teff. Evidence is provided for significant disparity between Treg and Teff in adenosine receptor-mediated signaling and its consequences for functions of these cells. [DOI] [PubMed] [Google Scholar]
- 61••.Mandapathil M, Szczepanski MJ, Szajnik M, et al. Adenosine and prostaglandin E2 cooperate in the suppression of immune responses mediated by adaptive regulatory T cells. J Biol Chem. 2010;285:27571–80. doi: 10.1074/jbc.M110.127100. Human inducible Treg (iTreg) generated in the presence of a COX2+ tumor and cytokines produce aadenosine and prostaglandin E2. These two factors cooperate in mediating powerful immune suppression of atuologous Teff functions. This in vitro study demonstrates that iTreg induced in the microenvironment simulating tumor are CD39+, CD73+, COX2+ and utilize PGE2 as well as adenosine to mediate Teff suppression. [DOI] [PMC free article] [PubMed] [Google Scholar]
- 62.Shevach EM. Mechanisms of Foxp3+ T regulatory cell-mediated suppression. Immunity. 2009;30:636–45. doi: 10.1016/j.immuni.2009.04.010. [DOI] [PubMed] [Google Scholar]
- 63.Czystowska M, Strauss L, Bergmann C, et al. Reciprocal granzyme/perforin-mediated death of human regulatory and responder T cells is regulated by interleukin-2 (IL-2) J Mol Med. 2010;88:577–88. doi: 10.1007/s00109-010-0602-9. [DOI] [PMC free article] [PubMed] [Google Scholar]
- 64.Strauss L, Bergmann C, Whiteside TL. Human circulating CD4 +CD25highFoxp3+ Treg kill autologous CD8+ but not CD4+ responder cells by Fas-mediated apoptosis. J Immunol. 2009;182:1469–80. doi: 10.4049/jimmunol.182.3.1469. [DOI] [PMC free article] [PubMed] [Google Scholar]
- 65•.Sojka DK, Huang YH, Fowell DJ. Mechanisms of regulatory T-cell suppression – a diverse arsenal for a moving target. Immunology. 2008;124:13–22. doi: 10.1111/j.1365-2567.2008.02813.x. This is an excellent review of various molecular and cellular mechanisms utilized by Treg to mediate suppression. [DOI] [PMC free article] [PubMed] [Google Scholar]
- 66.Maecker HT, Maino VC. Analysing T cell responses to cytomegalovirus by cytokine flow cytometry. Hum Immunol. 2004;65:493–9. doi: 10.1016/j.humimm.2004.02.004. [DOI] [PubMed] [Google Scholar]
- 67.Han Q, Bagheri N, Bradshaw EM, et al. Polyfunctional responses by human T cells result from sequential release of cytokines. Proc Natl Acad Sci USA. 2012;109:1607–12. doi: 10.1073/pnas.1117194109. [DOI] [PMC free article] [PubMed] [Google Scholar]
- 68•.Schmidt A, Oberle N, Weis EM, et al. Human regulatory T cells rapidly suppress T cell-receptor-induced Ca2+, NF-kappaB, and NFAT signaling in conventional T cells. Sci Signal. 2011;4:ra90. doi: 10.1126/scisignal.2002179. In this paper, Krammer et al discuss previously unrecognized and rapid molecular mechanisms of Treg-mediated suppression that involve disruption of TCR signaling in Teff. In addition to providing insights into Treg functions, this work introduces several molecular assays that could be useful for measuring suppressor activities of Treg. [DOI] [PubMed] [Google Scholar]
- 69.Strauss L, Bergmann C, Szczepanski M, et al. A unique subset of CD4 +CD25highFoxp3+ T cells secreting IL-10 and TGF-beta1 mediates suppression in the tumor microenvironment. Clin Cancer Res. 2007;13:4345–54. doi: 10.1158/1078-0432.CCR-07-0472. [DOI] [PubMed] [Google Scholar]
- 70.Bergmann C, Strauss L, Zeidler R, et al. Expansion of human T regulatory type 1 cells in the microenvironment of cyclooxygenase 2 overexpressing head and neck squamous cell carcinoma. Cancer Res. 2007;67:8865–73. doi: 10.1158/0008-5472.CAN-07-0767. [DOI] [PubMed] [Google Scholar]
- 71.Mandapathil M, Szczepanski MJ, Szajnik M, et al. Increased ectonucleotidase expression and activity in regulatory T cells of patients with head and neck cancer. Clin Cancer Res. 2009;15:6348–57. doi: 10.1158/1078-0432.CCR-09-1143. [DOI] [PMC free article] [PubMed] [Google Scholar]
- 72.Mandapathil M, Whiteside TL. Targeting human inducible regulatory T cells (Tr1) in patients with cancer: blocking of adenosine-prostaglandin E2 cooperation. Expert Opin Biol Ther. 2011;11:1203–14. doi: 10.1517/14712598.2011.581225. [DOI] [PMC free article] [PubMed] [Google Scholar]
- 73.Zarek PE, Powell JP. Adenosine and anergy. Autoimmunity. 2007;40:425–32. doi: 10.1080/08916930701464939. [DOI] [PubMed] [Google Scholar]
- 74.Schenk U, Frascoli M, Proietti M, et al. ATP inhibits the generation and function of regulatory T cells through the activation of purinergic P2X receptors. Sci Signal. 2011;4:ra12. doi: 10.1126/scisignal.2001270. [DOI] [PubMed] [Google Scholar]
- 75.Schulze Zur Wiesch J, Thomssen A, Hartjen P, et al. Comprehensive analysis of frequency and phenotype of T regulatory cells in HIV infection: CD39 expression of FOXP3+ Tregulatory cells correlates with progressive disease. J Virol. 2011;85:1287–97. doi: 10.1128/JVI.01758-10. [DOI] [PMC free article] [PubMed] [Google Scholar]
- 76.Martin F, Ladoire Mignot G, et al. Human FOXP3 and cancer. Oncogene. 2010;29:4121–9. doi: 10.1038/onc.2010.174. [DOI] [PubMed] [Google Scholar]
- 77•.Curiel TJ, Coukos G, Zou L, et al. Specific recruitment of regulatory T cells in ovarian carcinoma fosters immune privilege and predicts reduced survival. Nat Med. 2004;10:942–9. doi: 10.1038/nm1093. A widely quoted work, in which the authors show that the recruitment and accumulation of Treg in ovarian carcinoma predicts poor survival. [DOI] [PubMed] [Google Scholar]
- 78.Bates GJ, Fox SB, Han C, et al. Quantification of regulatory T cells enables the identification of high-risk breast cancer patients and those at risk of late relapse. J Clin Oncol. 2006;24:5373–80. doi: 10.1200/JCO.2006.05.9584. [DOI] [PubMed] [Google Scholar]
- 79.Fridman WH, Galon J, Pages F, et al. Prognostic and predictive impact of intra- and peritumoral immune infiltrates. Cancer Res. 2011;71:5601–5. doi: 10.1158/0008-5472.CAN-11-1316. [DOI] [PubMed] [Google Scholar]
- 80.Tosolini M, Kirilovsky A, Miecnik B, et al. Clinical impact of different classes of infiltrating T cytotoxic and helper cells (Th1, Th2, Treg, Th17) in patients with colorectal cancer. Cancer Res. 2011;71:1263–71. doi: 10.1158/0008-5472.CAN-10-2907. [DOI] [PubMed] [Google Scholar]
- 81.Carreras J, Lopez-Guillermo A, Fox BC, et al. High numbers of tumor-infiltrating FOXP3-positive regulatory T cells are associated with improved overall survival in follicular lymphoma. Blood. 2006;108:2957–64. doi: 10.1182/blood-2006-04-018218. [DOI] [PubMed] [Google Scholar]
- 82••.Ladoire S, Martin F, Ghiringhelli F. Prognostic role of FOXP3+ regulatory T cells infiltrating human carcinomas: the paradox of colorectal cancer. Cancer Immunol Immunother. 2011;60:909–18. doi: 10.1007/s00262-011-1046-y. A detailed review of recent literature and in-depth discussion of the prognostic role of FOXP3+ Treg in human carcinomas, including colorectal cancer. [DOI] [PMC free article] [PubMed] [Google Scholar]
- 83.Badoual C, Hans S, Rodriquez J, et al. Prognostic value of tumor-infiltrating CD4+ T-cell subpopulations in head and neck cancers. Clin Cancer Res. 2006;12:465–72. doi: 10.1158/1078-0432.CCR-05-1886. [DOI] [PubMed] [Google Scholar]
- 84.Ercolini AM, Ladle BH, Manning EA, et al. Recruitment of latent pools of high-avidity CD8(+) T cells to the antitumor immune response. J Exp Med. 2005;201:1591–602. doi: 10.1084/jem.20042167. [DOI] [PMC free article] [PubMed] [Google Scholar]
- 85.Audia SA, Nicolas D, Cathelin N, et al. Increase of CD4+ CD25+ regulatory T cells in the peripheral blood of patients with metastatic carcinoma: a Phase I clinical trial using cyclophosphamide and immunotherapy to eliminate CD4+ CD25+ T lymphocytes. Clin Exp Immunol. 2007;150:523–30. doi: 10.1111/j.1365-2249.2007.03521.x. [DOI] [PMC free article] [PubMed] [Google Scholar]
- 86.Ghiringhelli F, Menard C, Puig PE, et al. Metronomic cyclophosphamide regimen selectively depletes CD4+CD25+ regulatory T cells and restores T and NK effector functions in end stage cancer patients. Cancer Immunol Immunother. 2007;56:641–8. doi: 10.1007/s00262-006-0225-8. [DOI] [PMC free article] [PubMed] [Google Scholar]
- 87.Rech AJ, Vonderheide RH. Clinical use of anti-CD25 antibody daclizumab to enhance immune responses to tumor antigen vaccination by targeting regulatory T cells. Ann NY Acad Sci. 2009;1174:99–106. doi: 10.1111/j.1749-6632.2009.04939.x. [DOI] [PubMed] [Google Scholar]
- 88•.Hobeika AC, Morse MA, Osada T, et al. Depletion of human regulatory T cells. Methods Mol Biol. 2011;707:219–31. doi: 10.1007/978-1-61737-979-6_14. Various strategies used for the depletion of human Treg are discussed with comments on utility of the methods. [DOI] [PubMed] [Google Scholar]
- 89.Finke JH, Rini B, Ireland J, et al. Sunitinib reverses type-1 immune suppression and decreases T-regulatory cells in renal cell carcinoma patients. Clin Cancer Res. 2008;14:6674–82. doi: 10.1158/1078-0432.CCR-07-5212. [DOI] [PubMed] [Google Scholar]
- 90•.de Vries IJ, Castelli C, Huygens C, et al. Frequency of circulating Tregs with demethylated FOXP3 intron 1 in melanoma patients receiving tumor vaccines and potentially Treg-depleting agents. Clin Cancer Res. 2011;17: 841–8. doi: 10.1158/1078-0432.CCR-10-2227. This article presents results of three clinical trials, which combined tumor vaccines with Treg-depleting agents: Cyclophosphamide, anti-CD25 monoclonal antibody and denileukin diftitox. Treg frequencies were measured in peripheral blood of melanoma patients using a FOXP3 methylation-specific quantitative PCR assay. The results showed that none of the Treg-depleting strategies were effective in depleting Treg. At best, 50% reduction in blood Treg was achieved. [DOI] [PubMed] [Google Scholar]
- 91.Schwartzentruber DJ, Lawson DH, Richards JM, et al. gp100 peptide vaccine and interleukin-2 in patients with advanced melanoma. N Engl J Med. 2011;364:2119–27. doi: 10.1056/NEJMoa1012863. [DOI] [PMC free article] [PubMed] [Google Scholar]
- 92.Correale P, Rotundo MS, Del Vecchio MT, et al. Regulatory (FoxP3+) T-cell tumor infiltration is a favorable prognostic factor in advanced colon cancer patients undergoing chemo or chemoimmunotherapy. J Immunother. 2010;33:435–41. doi: 10.1097/CJI.0b013e3181d32f01. [DOI] [PMC free article] [PubMed] [Google Scholar]
- 93•.Whiteside TL, Mandapathil M, Schuler P. The Role of the Adenosinergic pathway in immunosuppression mediated by human regulatory T cells (Treg) Curr Med Chem. 2011;18:5217–23. doi: 10.2174/092986711798184334. This review makes a point that disarming of iTreg (Tr1), which play a major role in mediating immune suppression associated with human cancer, is an important goal. As these cells utilize the adenosnergic pathway and PGE2 for suppression, pharmacologic interventions could be used to decrease/eliminate immune suppression and restore anti-tumor activity. [DOI] [PMC free article] [PubMed] [Google Scholar]
- 94.Strauss L, Czystowska M, Szajnik M, et al. Differential responses of human regulatory T cells (Treg) and effector cells to rapamycin. PLoS One. 2009;4:e5994. doi: 10.1371/journal.pone.0005994. [DOI] [PMC free article] [PubMed] [Google Scholar]
- 95.Curran MA, Montalvo W, Yagita H, Allison JP. PD-1 and CTLA-4 combination blockade expands infiltrating T cells and reduces regulatory T and myeloid cells within B16 melanoma tumors. Proc Natl Acad Sci USA. 2010;107:4275–80. doi: 10.1073/pnas.0915174107. [DOI] [PMC free article] [PubMed] [Google Scholar]
- 96.Hodi FS, O’Day SJ, McDermott DF, et al. Improved survival with ipilimumab in patients with metastatic melanoma. N Engl J Med. 2010;363:711–23. doi: 10.1056/NEJMoa1003466. [DOI] [PMC free article] [PubMed] [Google Scholar]
- 97.Ascierto PA, Simeone E, Sznol M, et al. Clinical experiences with anti-CD137 and anti-PD1 therapeutic antibodies. Semin Oncol. 2010;37:508–16. doi: 10.1053/j.seminoncol.2010.09.008. [DOI] [PubMed] [Google Scholar]
- 98.Cohen AD, Schaer DA, Liu C, et al. Agonist anti-GITR monoclonal antibody induces melanoma tumor immunity in mice by altering regulatory T cell stability and intra-tumor accumulation. PLoS One. 2010;5:e10436. doi: 10.1371/journal.pone.0010436. [DOI] [PMC free article] [PubMed] [Google Scholar]
- 99.Nair S, Boczkowski D, Fassnacht M, et al. Vaccination against the forkhead family transcription factor Foxp3 enhances tumor immunity. Cancer Res. 2007;67:371–80. doi: 10.1158/0008-5472.CAN-06-2903. [DOI] [PubMed] [Google Scholar]
- 100.Conroy H, Galvin KC, Higgins SC, Mills KH. Gene silencing of TGF-beta1 enhances antitumor immunity induced with a dendritic cell vaccine by reducing tumor-associated regulatory T cells. Cancer Immunol Immunother. 2012;61:425–31. doi: 10.1007/s00262-011-1188-y. [DOI] [PMC free article] [PubMed] [Google Scholar]
- 101.Schilling B, Harasymczuk M, Schuler P, et al. IRX-2, a novel biologic, favors the expansion of T effector over T regulatory cells in a human tumor microenvironment model. J Mol Med (Berl) 2012;90:139–47. doi: 10.1007/s00109-011-0813-8. [DOI] [PMC free article] [PubMed] [Google Scholar]
- 102.Whiteside TL. Disarming suppressor cells to improve immunotherapy. Cancer Immunol Immunother. 2012;61:283–8. doi: 10.1007/s00262-011-1171-7. [DOI] [PMC free article] [PubMed] [Google Scholar]