Abstract
We report the characterization of tris(2-pyridylmethyl)amine (TPA) as a membrane-permeable zinc chelator for intercepting biological mobile zinc. Compared to N,N,N',N'-tetrakis(2-pyridylmethyl)ethylenediamine (TPEN), TPA chelates zinc with faster kinetics in cuvettes, live cells, and brain slices. TPA also is generally less toxic than TPEN in cell culture. Mechanistic analysis indicates that these improvements arise from both the electronic and steric properties of TPA including weaker metal-binding affinity, lower pKa, and smaller size. These results demonstrate that TPA is a valuable addition to the methodologies available for investigating mobile zinc in biology.
Introduction
Zinc is a ubiquitous trace element in biology. About 3000 proteins contain tightly bound zinc ions, which are essential for catalysis, maintaining protein structure, and regulatory functions.1–2 There are also pools of loosely bound zinc ions found mainly in the brain,3–4 pancreas,5 and prostate.6 These dynamic mobile zinc pools have attracted increasing attention owing to their diverse roles in both physiology and pathology.7–9 Considerable effort by chemical biologists studying mobile zinc have been devoted to the development of specific probes for its visualization by fluorescence,10–11 phosphorescence,12 and magnetic resonance imaging13–15 methods. Devising new chemical agents for intercepting zinc ions, zinc-selective chelators, has attracted much less attention.16–18 Zinc chelators are widely used for intercepting mobile zinc in studies of downstream biochemical or electrophysiological events,19–20 and they are often used in conjunction with various imaging modalities to verify the nature of observed signals or to quantify zinc concentration.19,21–22 The prospect of using metal chelators for treating neurodegenerative disorders has further fueled the development of advanced constructs with a high degree of metal specificity and targetability.23–26
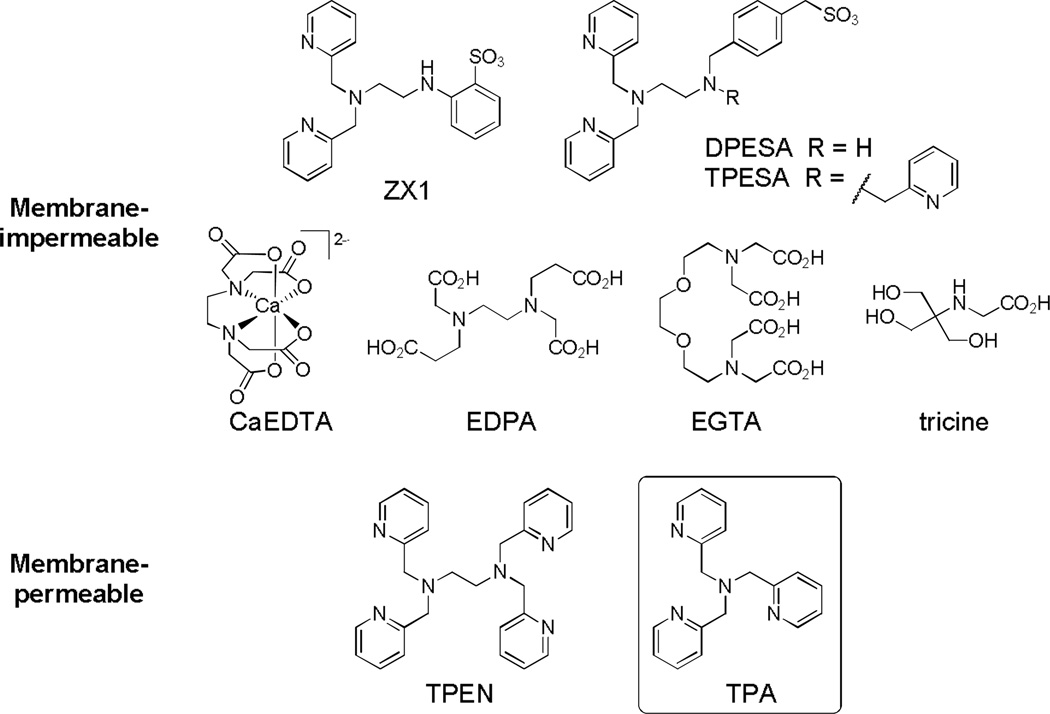
Recently we reported ZX1,17 a membrane-impermeable chelator based on dipicolylamine and sulfonate groups (Scheme 1). ZX1 binds zinc more rapidly than commonly used CaEDTA,17 and allowed interception of zinc ions released transiently from presynaptic vesicles in hippocampal neurons at the mossy fiber synapse. Electrophysiological experiments using ZX1 suggested both presynaptic and postsynaptic functions for the released zinc.17 The quest for tools that modulate zinc concentrations on the relevant biological time scale continues, motivating the development of novel zinc chelators with improved properties. Unlike extracellular zinc chelators, which typically use carboxylate26–27 and sulfonate16–17 groups to bind zinc (Scheme 1), intracellular zinc ions are chelated most often with the use of N,N,N',N'-tetrakis(2-pyridylmethyl)ethylenediamine (TPEN, Scheme 1).19–21 TPEN shows poor selectivity for mobile zinc vs. transition metals bound to proteins,22,28 however, because of its high zinc affinity (0.3 fM).29 Numerous studies have revealed that the harsh metal depletion conditions created by TPEN treatment drive cell apoptosis30–36 and neurodegeneration37 pathways. Moreover, TPEN is commonly used in zinc imaging studies to validate zinc as the cause of enhanced fluorescence by chelating the ion, which leads to fluorescence quenching,38 or to obtain zinc-free signals for quantifying mobile zinc.21,39 Despite a high thermodynamic driving force, TPEN typically binds sensor-bound zinc slowly and can take > 0.5 h in cells to fully remove the metal ion from sensors.21,39 The cytotoxic effects engendered by prolonged treatment may affect the accuracy of estimated mobile zinc concentration. New chelating agents are therefore of urgent need in the studies of mobile zinc biology to offer a range of metal-binding affinities, reduced cytotoxicity, more rapid kinetics of zinc binding, and improved selectivity toward the metal ion.
Scheme 1.
Structures of membrane-impermeable and membrane-permeable zinc chelators.
In the present report we have investigated tris(2-pyridylmethyl)amine (TPA, Scheme 1) as an alternative chelator for mobile zinc. TPA is based on a common tripodal ligand scaffold that is widely used in the coordination chemistry of transition metals,40–42 but it has not been evaluated for chelating mobile metal ions in biological systems.43 The nitrogen-based donor groups in both TPA and TPEN enable them to bind selectively to “borderline” transition metals compared to “hard” alkaline and alkaline earth metals like sodium and calcium, which are abundant in the biological milieu.44 The relative affinities of TPA for first-row transition metal ions follows the Irving-Williams series.29 TPA coordinates zinc with a 1:1 stoichiometry45 and 10 pM affinity,29 five orders of magnitude more weakly than TPEN.29 The tertiary amine in TPA (pKa 6.17) is also less basic than those in TPEN (pKa 7.19),29 resulting in a smaller fraction of protonated chelator at physiological pH. We were interested to learn whether the weaker metal affinity and lower pKa of TPA would reduce cytotoxicity and improve zinc-binding kinetics. In this work we have characterized TPA and compared it to TPEN for zinc chelation in cuvettes, living cells, and neuronal tissues, and we have also evaluated the relative cytotoxicity of the two chelating agents.
Experimental
TPA and TPEN were purchased from Sigma-Aldrich and used as received. ZP1 was prepared according to published procedures.46 Piperazine-N,N'-bis(2-ethanesulfonic acid) (PIPES) and 99.999% KCl were obtained from Calbiochem. Buffers were treated with Chelex resin (Bio-Rad) to remove adventitious metal ions, according to the manufacturer’s protocol.
UV-visible spectra were acquired on a Cary 50 spectrophotometer. Fluorescence spectra were obtained with a QuantaMaster 4 Photon Technology International fluorimeter.
Stopped flow measurements
Stopped flow data were obtained in single-wavelength mode at 8–25 °C using an Applied Photophysics (Surrey, UK) DX.18MV SF spectrophotometer. Solutions of 20–80 µM chelator and 80–200 µM zinc chloride, both of which were dissolved in pH 6.2–7.5 buffers containing 50 mM PIPES and 100 mM KCl, were mixed and the absorbance at 268 nm recorded. Data were fit with second-order rate constants using the DynaFit program (BioKin). Each stopped flow measurement was carried out with at least four replicates.
Fluorescence microscopy
Fluorescence images of HeLa cells were acquired using a Zeiss Axiovert 200M inverted epifluorescence microscope equipped with an EM-CCD digital camera (Hamamatsu) and a MS200 XY Piezo Z stage (Applied Scientific Instruments). The light source was an X-Cite 120 metal-halide lamp (EXFO). Microscope was operated with Volocity software (PerkinElmer). Images were processed and intensities were quantified with ImageJ software (NIH).
Cell culture and imaging
HeLa cells were cultured in DMEM supplemented with 10% FBS and 1% penicillin-streptomycin at 37 °C in a humidified atmosphere with 5% CO2. Two days before imaging, cells were plated onto 35 mm glass-bottom culture dishes containing 2 mL of pre-warmed growth medium per dish. Cells were incubated with 5 µM ZP1 and 4 µM Hoechst 33258 0.5 h before imaging. Then the cells were washed with 2 mL of PBS, 2 mL of dye-free DMEM, and bathed in 2 mL of dye-free DMEM. During imaging the serum-free DMEM was removed, and 2 mL of serum-free DMEM containing 20 µM ZnCl2:pyrithione 1:2 was applied, where pyrithione is 2-mercaptopyridine-N-oxide. After the green fluorescence from ZP1 had reached a plateau, the media were replaced with 2 mL of serum-free DMEM containing 100 µM TPA or TPEN. During imaging the dishes were maintained at 37 °C under 5% CO2 with an INC-2000 incubator.
Two-photon microscopy of acute hippocampal slices
The hippocampi of 1–2 month old mice were removed and dissected into 0.35-mm thick slices. The slices were allowed to recover for 2–4 h in artificial cerebrospinal fluid (ACSF) at 32 °C saturated with 95% O2 and 5% CO2. Slices were incubated with 10 µM ZP1 in ACSF at 35 °C for 10 min, before being transferred to the stage of a two-photon fluorescence microscope (Prairie Technologies). The slices were perfused with ACSF saturated with 95% O2/5% CO2 at 30 °C for 5 min, after which fluorescence images were taken every 2 min. At 6 min, the media for perfusion were replaced with ACSF containing 50 µM chelator (TPA or TPEN), and fluorescence images were taken every 2 min. In control experiments no chelator was used. Slices were imaged with a two-photon laser-scanning microscope equipped with a 10× objective lens and 570 nm short pass emission filter, and 930 nm excitation wavelength from a Ti:sapphire laser. Images were processed and intensities were quantified with ImageJ software (NIH).
MTT assay
HeLa cells were seeded into a 96-well plate with ~1200 cells per well and then incubated at 37 °C for 48 h in a humidified atmosphere with 5% CO2. Media containing 1 µM – 3 mM (for 1 h treatment) or 0.1 µM – 1 mM (for 24 h treatment) chelator (TPA or TPEN), were added to the wells and cells were incubated for 1 h or 24 h. In control experiments, media containing the highest concentration of DMSO used in chelator experiments, or blank control media, were used. The cells were then treated with 30 µL of 5 mg mol−1 3-(4,5-dimethylthiazol-2-yl)-2,5-diphenyltetrazolium bromide (MTT) for 4 h. The media were removed and 200 µL of DMSO was added to each well. For quantifying the amount of formazan dye, the absorbance at 570 nm was measured with a multi-detection microplate plate reader (BioTek Synergy HT). Three sets of independent experiments were carried out, and each was performed in triplicate.
Results and discussion
Kinetics of zinc binding to the chelators in the cuvette
We first compared the zinc chelation kinetics of TPA and TPEN in cuvettes. ZP1,47 a zinc fluorescent sensor of the Zinpyr (ZP) family, was used to monitor changes in zinc concentration. Since fluorescence emission in unbound ZP1 is quenched by the dipicolylamine units by photoinduced electron transfer (PET), decreasing fluorescence of the sensor indicated incremental loss of two zinc ions (Scheme 2).47–48 Upon addition of 100 µM TPA or TPEN to a solution of Zn2(ZP1) in pH 7.0 buffer containing 50 mM PIPES and 100 mM KCl at 25 °C, the fluorescence intensity at 527 nm decreased continuously (Fig. 1). TPA reduced the fluorescence more rapidly than TPEN, reaching background level within 1 min for TPA whereas for TPEN it required ~5 min. The kinetics of fluorescence decrease is first-order in both the chelator and Zn2(ZP1). The temporal decrease of fluorescence intensity could be fit well with a biexponential equation (ESI†). The obtained rate constants correspond to sequential removal of zinc ions from the two metal-binding pockets in ZP1, which are characterized by zinc affinities differing by four orders of magnitude (0.04 pM and 1.2 nM).48 Despite being a weaker chelator, TPA eliminates the two ZP1-bound zinc ions with rate constants of 2900 ± 200 and 800 ± 100 M−1 s−1 (Table 1), which are about 30-fold larger than the corresponding TPEN values.
Scheme 2.
Chelators quench zinc-induced fluorescence of ZP1 by removing zinc ions sequentially from the complex.
Fig. 1.
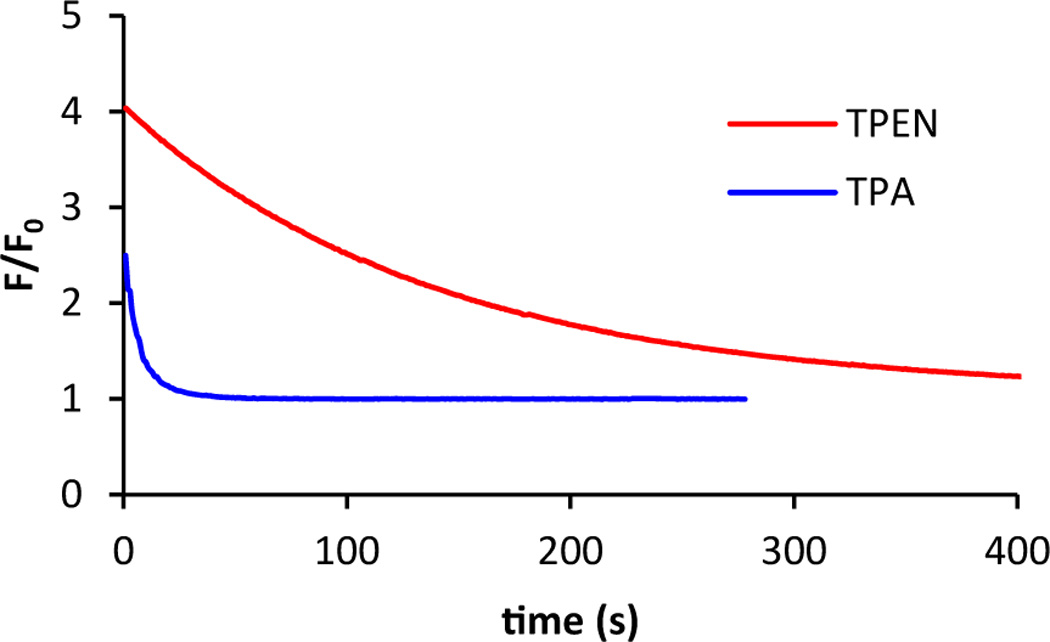
Addition of 100 µM TPA (blue) or TPEN (red) to a 1.0 µM solution of Zn2(ZP1) in pH 7.0 buffer containing 50 mM PIPES and 100 mM KCl at 25 °C resulted in decrease of fluorescence over time. Fluorescence emission at 527 nm was recorded and was normalized to unbound ZP1 levels.
Table 1.
Second-order rate constants for chelator elimination of the first (k) and second (k') zinc ions from Zn2(ZP1) at 25 °C.
| k (M−1 s−1) | k' (M−1 s−1) | |
|---|---|---|
| TPA | 2900 ± 200 | 800 ± 100 |
| TPEN | 106 ± 3 | 33 ± 2 |
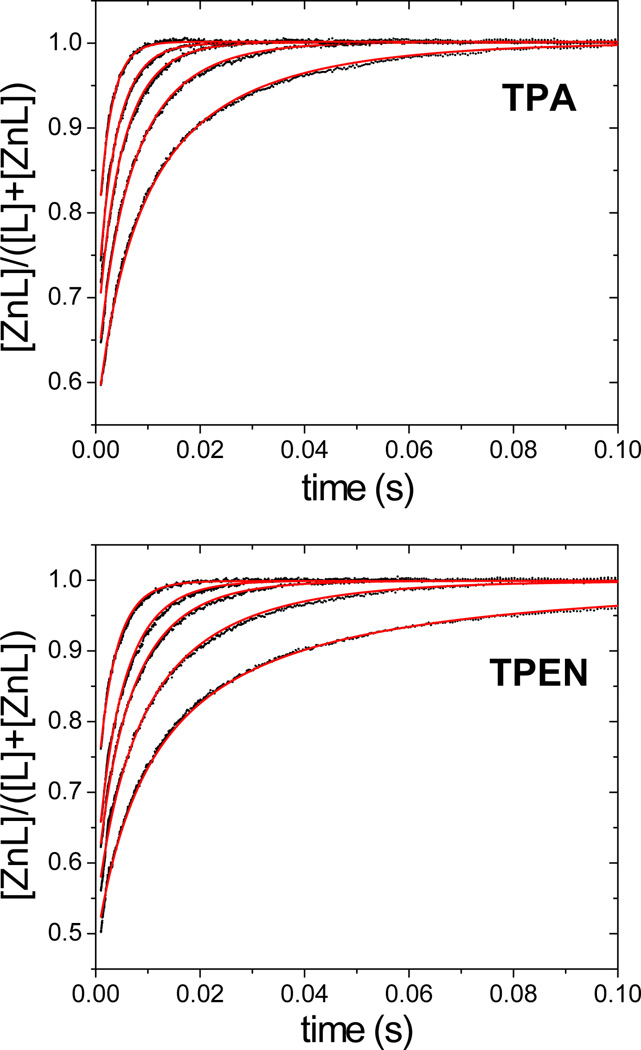
To further understand the chelation kinetics, we studied the reactions of zinc with the chelators in the absence of a fluorescent sensor. For both chelators, zinc coordination resulted in a decrease in absorbance at 268 nm (Fig. S1, ESI†). Using a stopped-flow spectrometer, we measured the change of absorbance after rapid mixing of the chelators with zinc chloride in pH 7.0 PIPES buffers at 25 °C (Fig. 2), and the derived rate constants are presented in Table 2. TPA chelates zinc with a rate constant of (5.81 ± 0.02) × 106 M−1 s−1, a value ~40% larger than that for TPEN. Because at pH 7.0 the chelators exist in equilibrium with their protonated forms,17,29 to determine the contributions of the chelator protonation states to zinc-binding kinetics we determined the rate constants over the pH range 6.2–7.5 in PIPES buffer, corresponding to the range within which it is most effective. The overall rate constant decreases as the chelator becomes increasingly protonated at lower pH values (Table 2). Within this pH range, TPEN kinetics are more sensitive to pH than TPA kinetics. Combined with the knowledge of chelator speciation (Fig. S2, ESI†), we extracted rate constants for both non-protonated and protonated forms of the chelators (Table 3). The results reveal that non-protonated forms of TPA and TPEN chelate zinc ions with similar rate constants. Compared to the non-protonated forms, the protonated chelators react with zinc ions about an order of magnitude more slowly, suggesting that proton dissociation must occur in the rate-determining step prior to metal coordination by the tertiary amine.49–50 The slow kinetics of protonated species is consistent with the reported pH-dependence of ligand replacement reactions.49,51 Taken together, these data suggest that the faster kinetics of TPA is a consequence of its weaker basicity and the resultant lesser degree of protonation at neutral pH.
Fig. 2.
Representative stopped flow data for zinc reactions with TPA (top) and TPEN (bottom) in pH 7.0 buffers containing 50 mM PIPES and 100 mM KCl. The fraction of metal-bound chelator is plotted versus time. Black dots were derived from the measured absorbance at 268 nm, and red curves correspond to global fitting results using second-order kinetics. Data correspond to mixing 35 µM chelator with 40, 50, 62.5, 75, 100 µM ZnCl2 (post-mixing concentrations).
Table 2.
Fraction of non-protonated chelators (xL) and second-order rate constants for metal complex formation with ZnCl2 in buffers of different pH values.
| pH | TPA | TPEN | ||
|---|---|---|---|---|
| xL | 10−6 k (M−1 s−1) | xL | 10−6 k (M−1 s−1) | |
| 6.2 | 0.51 | 3.83 ± 0.01 | 0.09 | 1.53 ± 0.01 |
| 7.0 | 0.87 | 5.81 ± 0.02 | 0.39 | 4.24 ± 0.02 |
| 7.5 | 0.92 | 7.57 ± 0.03 | 0.67 | 7.08 ± 0.03 |
Table 3.
Second-order rate constants for metal complex formation by reactions with non-protonated ligand (kL) and mono-protonated chelator (kHL).
| TPA | TPEN | |
|---|---|---|
| 10−6 kL (M−1 s−1) | 8 ± 4 | 10.2 ± 0.4 |
| 10−6 kHL (M−1 s−1) | 0 ± 2 | 0.6 ± 0.1 |
Spontaneous zinc dissociation from Zn2(ZP1) occurs on the time scale of milliseconds,52 much slower than reactions in the presence of chelators. This result suggests that chelators directly attack ZP1-bound zinc ions before zinc dissociation from ZP1. Similar mechanisms have been established for metal ion exchange reactions between other multidentate ligands.49 The different basicity of the two chelators accounts for only about two-fold difference in the fraction of protonation state (see above), which, contrary to reactions with free zinc, does not fully describe the 30-fold difference observed in fluorescence quenching kinetics. We therefore propose that the kinetic difference also reflects the different degrees of steric interaction between the incoming chelator and Zn2(ZP1).
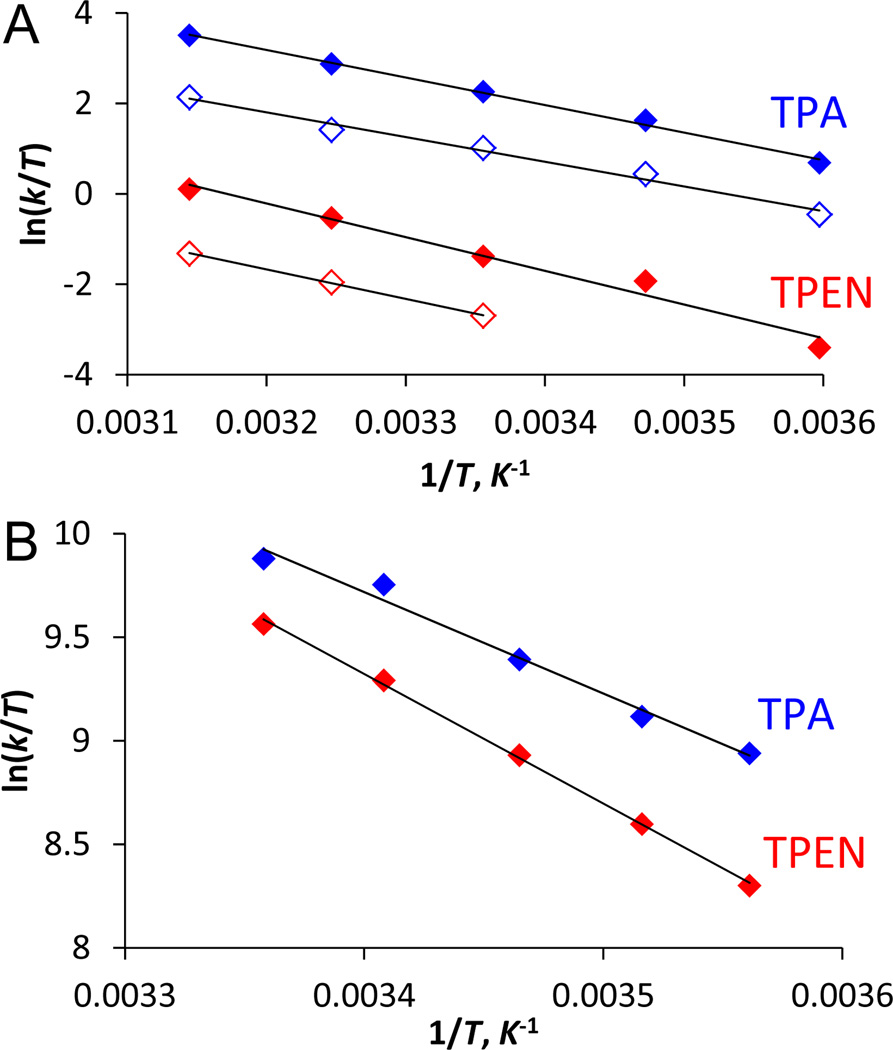
To test this hypothesis, we measured the rate constants of chelator reactions with Zn2(ZP1) between 5 °C and 45 °C, and we then derived activation parameters for both steps using Eyring plots (Fig. 3A, Table 4). The negative entropies of activation for displacement of both zinc ions from Zn2(ZP1) are consistent with an associative mechanism, in which the incoming nucleophile attacks ZP1-bound metal.49 The similar ΔSǂ values for both chelators suggest that the transition states share similar degrees of bond formation with zinc. The faster kinetics of TPA reactions largely arises from an enthalpic contribution, with its ΔHǂ values 2 – 3 kcal mol−1 lower than those for TPEN. The difference becomes smaller (1.4 kcal mol−1) for reactions with free zinc (Fig. 3B, Table 4), consistent with a larger energetic penalty associated with more demanding steric interactions for displacing zinc-bound ZP1 instead of water ligands. Taken together, the weaker metal affinity, lower pKa, and smaller size of TPA explain its improved zinc-chelation kinetics.
Fig. 3.
Eyring plots of (A) zinc removal from Zn2(ZP1) by chelators, and (B) chelators reacting with zinc ions in pH 7.0 buffers. Blue: TPA; red: TPEN. In A, solid and empty diamonds correspond to removal of the first and second zinc ions, respectively.
Table 4.
Activation enthalpies (ΔHǂ) and entropies (ΔSǂ) for chelator reactions with Zn2(ZP1), Zn(ZP1), and ZnCl2 at pH 7.0.
| TPA | TPEN | |||
|---|---|---|---|---|
| ΔHǂ (kcal mol−1) |
ΔSǂ (cal mol−1 K−1) |
ΔHǂ (kcal mol−1) |
ΔSǂ (cal mol−1 K−1) |
|
| Zn2(ZP1) | 12.1 ± 0.4 | −2 ± 1 | 15 ± 2 | 0 ± 4 |
| Zn(ZP1) | 10.8 ± 0.7 | −9 ± 2 | 12.9 ± 0.2 | −9 ± 1 |
| ZnCl2 | 9.7 ± 0.7 | 5 ± 3 | 12.4 ± 0.2 | 13.6 ± 0.9 |
Kinetics of zinc binding in cells and brain slices and cytotoxicity
The use of chelators for studying intracellular mobile zinc involves not only zinc binding in crowded heterogeneous cellular environments, but also cell uptake and interactions with other biomolecules. To evaluate the suitability of TPA for studying zinc ions in biological samples, we compared the zinc-binding kinetics of the two chelators in live cells and tissues, and we also determined their cytotoxicities. Using ZP1 as the zinc-responsive fluorescence indicator,47 we recorded signals inside live cells by fluorescence microscopy and quantified changes over time. Addition of 20 µM zinc pyrithione to ZP1-treated HeLa cells delivered zinc ions to the cells and resulted in an increase of ZP1 fluorescence that plateaued within 10 min. Subsequent treatment with 100 µM TPA reversed the fluorescence within ~4 min, whereas with 100 µM TPEN more than 10 min were required to reduce the fluorescence signal to background levels (Fig. 4). When ZPP1, a homologous zinc sensor with a lower zinc-binding affinity (16 nM),53–54 was employed, similar kinetic differences were observed (Fig. S3, ESI†).
Fig. 4.

(A) Fluorescence images of ZP1-treated HeLa cells. Left to right: DIC images, ZP1 signals, ZP1 fluorescence 10 min after addition of 20 µM zinc pyrithione, and after addition of 100 µM chelator (top: TPA, bottom: TPEN) recorded at 2, 5, and 10 min. Scale bar = 25 µm. (B) The intracellular ZP1 signals were quantitated and normalized to the levels before zinc addition. Signals from 8–12 cells in four culture dishes were averaged. Error bars represent standard errors of the mean.
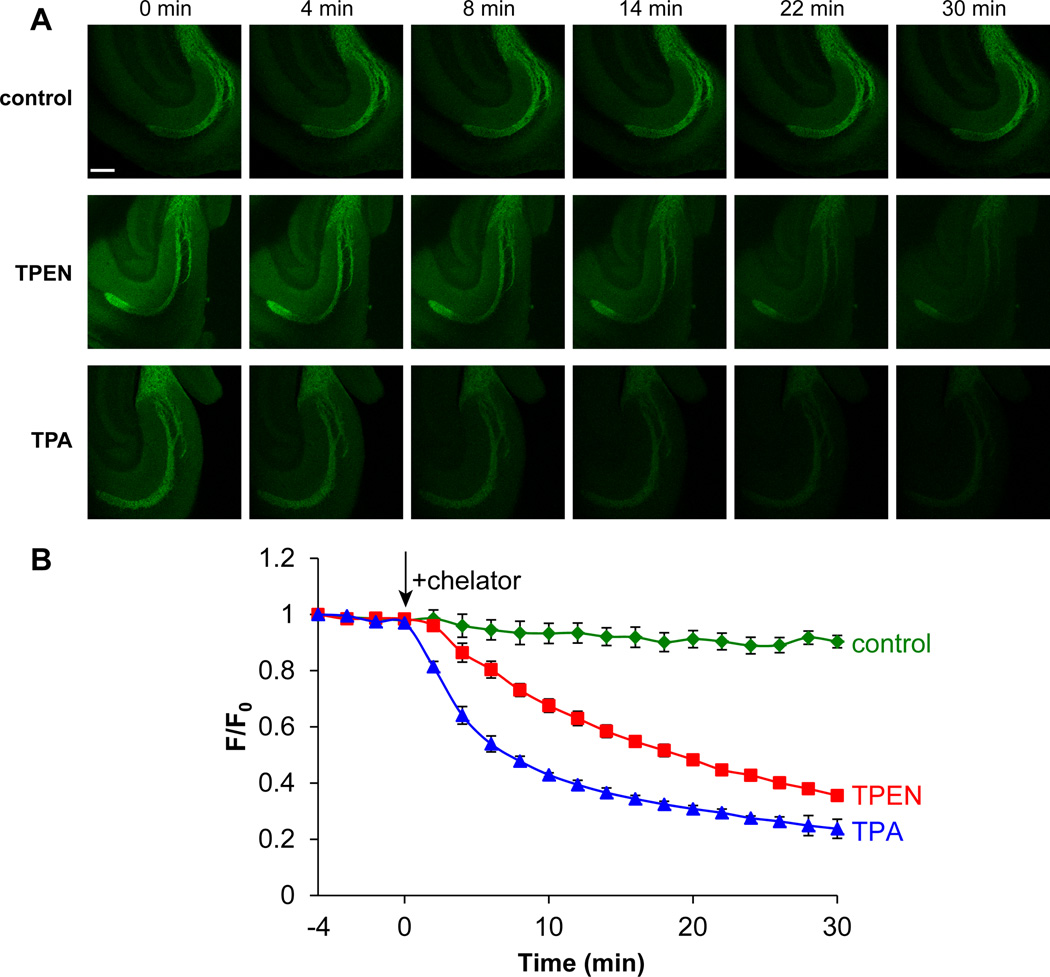
To compare the effectiveness of the two chelators in live tissue, we measured the rate of fluorescent quenching in acute mouse hippocampal slices by two-photon microscopy. Consistent with the high concentration of mobile zinc (>100 µM) in mossy fiber glutamatergic vesicles,4,10,55 incubation of the slices with 10 µM ZP1 resulted in intense staining in the dentate gyrus and CA3 regions of the hippocampus. Treatment with 50 µM TPA or TPEN reduced ZP1 fluorescence emission, confirming the nature of zinc-induced fluorescence change (Fig. 5). Compared to TPEN, TPA decreased fluorescence signals ~2.5-fold more rapidly (half life ~7 min for TPA vs. ~18 min for TPEN). Because chelators are used broadly in zinc imaging experiments, these results point to the important role that chelating agents can play in reversibly modulating fluorescence readout. As a fast chelator on both cellular and tissue levels, TPA potentially allows for more accurate measurements of fluorescent signals at the zinc-free state, which are often used to quantify mobile zinc.
Fig. 5.
(A) Selected images of acute hippocampal slices recorded with two-photon microscopy after treatment with blank ACSF media (control) or with 100 µM TPEN or TPA. Chelators were introduced at t = 0 min. Scale bar = 200 µm. (B) Normalized fluorescence intensities vs. time. n = 3 (control), 4 (TPEN) and 4 (TPA). Error bars represent standard errors of the mean.
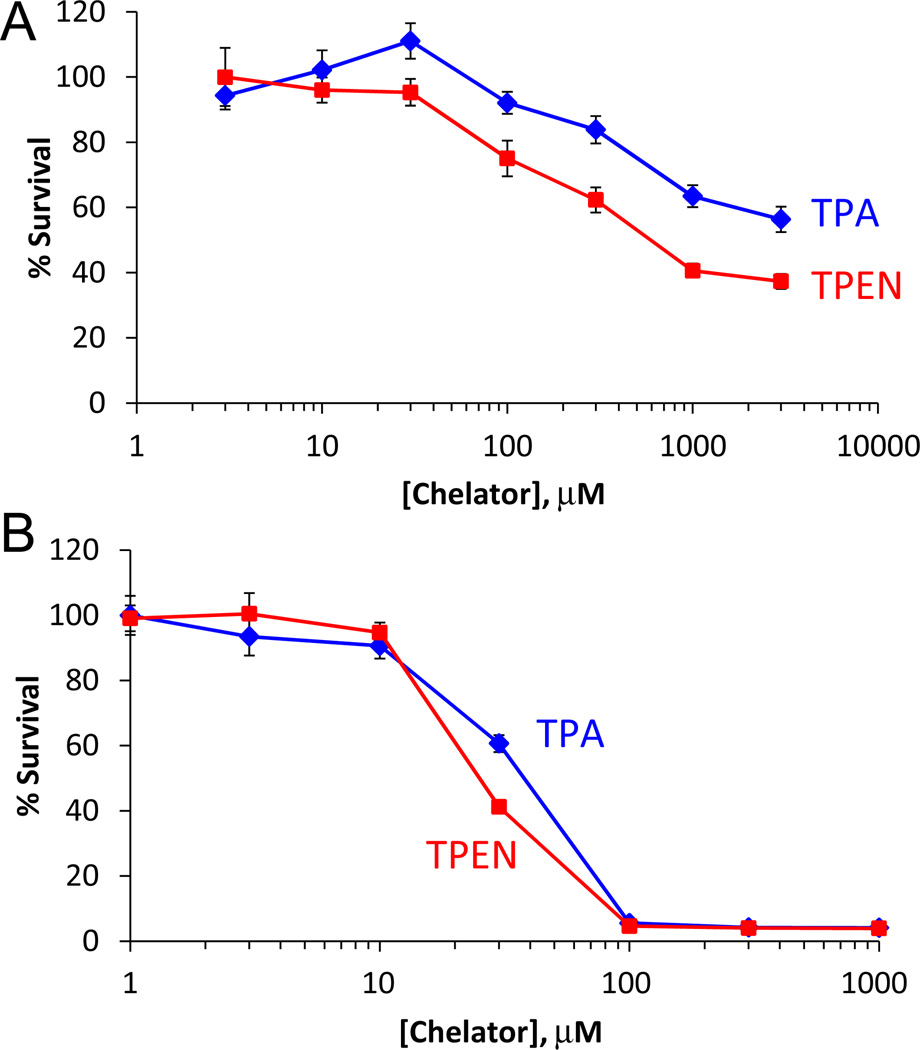
Finally, to assess the cytotoxicity of the chelators, we quantified cell viability using the MTT assay after treatment with TPA or TPEN. HeLa cells were incubated with the chelators for 1 h and 24 h to compare their short- and long-term effects on cell viability. As shown in Fig. 6, compared to TPEN, TPA is less harmful to cell growth after a 1 h treatment. The IC50 (concentration at 50% cell survival) value of TPA is > 3 mM, indicating that TPA is an order of magnitude less toxic than TPEN (IC50 = 0.4 ± 0.1 mM). After 24 h, however, both chelators were toxic with a smaller difference between the IC50 values: 38 ± 1 µM for TPA and 25 ± 2 µM for TPEN. Extensive research has demonstrated the relationship between the cytotoxicity of TPEN and depletion of metal ions that are available to the cellular machinery, especially zinc and copper.30–31,33–34,36–37 The lower cytotoxicity of TPA compared to TPEN may be a consequence of its lower affinity for metal ions, making it less likely to inhibit metalloprotein function. Further work is necessary to test this hypothesis and to understand and design chelators that are more selective toward mobile, compared to protein-bound, zinc and other metal ions. Taken together, the lower in vitro cytotoxicity and faster zinc-binding kinetics of TPA suggest it to be an alternative zinc chelator with better selectivity for mobile zinc than protein-bound zinc, which may facilitate shorter treatment times for biological samples with fewer side effects.
Fig. 6.
Survival percentage of HeLa cells after treatment with TPA or TPEN for 1 h (A) or 24 h (B), as quantified with MTT assay. Error bars represent standard errors of the mean.
In conclusion, we propose TPA as a next-generation chelator for investigating intracellular mobile zinc. Compared to TPEN, a commonly used membrane-permeable zinc chelator, TPA sequesters mobile zinc with faster kinetics in cuvettes, live cells, and brain tissue. TPA also lowers in vitro cytotoxicity during time windows frequently used to study the biology of mobile zinc. Our results suggest that the weaker metal affinity, lower pKa, and smaller size of TPA collectively improve its zinc-binding kinetics and reduce the cytotoxicity of chelator treatment. The prospects of TPA as an alternative chelator for mobile zinc in biological samples point to the importance of further examining its applications in studies of zinc biology.
Supplementary Material
Acknowledgments
This work was supported by the National Institute of General Medical Sciences grant GM065519 to SJL, and a FRAXA Research Foundation fellowship to MB. Two-photon microscopy of acute hippocampal slices was performed in the lab of Prof. Mark F. Bear at MIT. We thank Alexandria D. Liang, Ellen Minnihan, and Joey Cotruvo for assistance with stopped flow experiments, and Dr. Robert J. Radford for insightful discussions.
Footnotes
Electronic supplementary information (ESI) available.
References
- 1.Maret W. BioMetals. 2009;22:149–157. doi: 10.1007/s10534-008-9186-z. [DOI] [PubMed] [Google Scholar]
- 2.Vallee BL, Falchuk KH. Physiol. Rev. 1993;73:79–118. doi: 10.1152/physrev.1993.73.1.79. [DOI] [PubMed] [Google Scholar]
- 3.Chang CJ, Lippard SJ. Neurodegenerative Diseases and Metal Ions. John Wiley & Sons; 2006. pp. 321–370. [Google Scholar]
- 4.Sensi SL, Paoletti P, Bush AI, Sekler I. Nat. Rev. Neurosci. 2009;10:780–791. doi: 10.1038/nrn2734. [DOI] [PubMed] [Google Scholar]
- 5.Taylor CG. BioMetals. 2005;18:305–312. doi: 10.1007/s10534-005-3686-x. [DOI] [PubMed] [Google Scholar]
- 6.Costello L, Franklin R. Mol. Cancer. 2006;5:17. doi: 10.1186/1476-4598-5-17. [DOI] [PMC free article] [PubMed] [Google Scholar]
- 7.Franklin RB, Costello LC. J. Cell. Biochem. 2009;106:750–757. doi: 10.1002/jcb.22049. [DOI] [PMC free article] [PubMed] [Google Scholar]
- 8.Hirano T, Murakami M, Fukada T, Nishida K, Yamasaki S, Suzuki T. Adv. Immunol. 2008;97:149–176. doi: 10.1016/S0065-2776(08)00003-5. [DOI] [PubMed] [Google Scholar]
- 9.John E, Laskow TC, Buchser WJ, Pitt BR, Basse PH, Butterfield LH, Kalinski P, Lotze MT. J. Transl. Med. 2010;8:118. doi: 10.1186/1479-5876-8-118. [DOI] [PMC free article] [PubMed] [Google Scholar]
- 10.Que EL, Domaille DW, Chang CJ. Chem. Rev. 2008;108:1517–1549. doi: 10.1021/cr078203u. [DOI] [PubMed] [Google Scholar]
- 11.Nolan EM, Lippard SJ. Acc. Chem. Res. 2009;42:193–203. doi: 10.1021/ar8001409. [DOI] [PMC free article] [PubMed] [Google Scholar]
- 12.You Y, Lee S, Kim T, Ohkubo K, Chae W-S, Fukuzumi S, Jhon G-J, Nam W, Lippard SJ. J. Am. Chem. Soc. 2011;133:18328–18342. doi: 10.1021/ja207163r. [DOI] [PMC free article] [PubMed] [Google Scholar]
- 13.You Y, Tomat E, Hwang K, Atanasijevic T, Nam W, Jasanoff AP, Lippard SJ. Chem. Commun. 2010;46:4139–4141. doi: 10.1039/c0cc00179a. [DOI] [PMC free article] [PubMed] [Google Scholar]
- 14.Zhang X-a, Lovejoy KS, Jasanoff A, Lippard SJ. Proc. Natl. Acad. Sci. USA. 2007;104:10780–10785. doi: 10.1073/pnas.0702393104. [DOI] [PMC free article] [PubMed] [Google Scholar]
- 15.Lee T, Zhang X-a, Dhar S, Faas H, Lippard SJ, Jasanoff A. Chem. Biol. 2010;17:665–673. doi: 10.1016/j.chembiol.2010.05.009. [DOI] [PMC free article] [PubMed] [Google Scholar]
- 16.Kawabata E, Kikuchi K, Urano Y, Kojima H, Odani A, Nagano T. J. Am. Chem. Soc. 2005;127:818–819. doi: 10.1021/ja044697q. [DOI] [PubMed] [Google Scholar]
- 17.Pan E, Zhang X-a, Huang Z, Krezel A, Zhao M, Tinberg CE, Lippard SJ, McNamara JO. Neuron. 2011;71:1116–1126. doi: 10.1016/j.neuron.2011.07.019. [DOI] [PMC free article] [PubMed] [Google Scholar]
- 18.Radford RJ, Lippard SJ. Curr. Opin. Chem. Biol. 2013;17:129–136. doi: 10.1016/j.cbpa.2013.01.009. [DOI] [PMC free article] [PubMed] [Google Scholar]
- 19.Huang YZ, McNamara JO. J. Neurosci. 2012;32:15521–15532. doi: 10.1523/JNEUROSCI.0755-12.2012. [DOI] [PMC free article] [PubMed] [Google Scholar]
- 20.Kodirov SA, Takizawa S, Joseph J, Kandel ER, Shumyatsky GP, Bolshakov VY. Proc. Natl. Acad. Sci. USA. 2006;103:15218–15223. doi: 10.1073/pnas.0607131103. [DOI] [PMC free article] [PubMed] [Google Scholar]
- 21.Qin Y, Dittmer PJ, Park JG, Jansen KB, Palmer AE. Proc. Natl. Acad. Sci. USA. 2011;108:7351–7356. doi: 10.1073/pnas.1015686108. [DOI] [PMC free article] [PubMed] [Google Scholar]
- 22.Meeusen JW, Nowakowski A, Petering DH. Inorg. Chem. 2012;51:3625–3632. doi: 10.1021/ic2025236. [DOI] [PMC free article] [PubMed] [Google Scholar]
- 23.Cherny RA, Atwood CS, Xilinas ME, Gray DN, Jones WD, McLean CA, Barnham KJ, Volitakis I, Fraser FW, Kim Y-S, Huang X, Goldstein LE, Moir RD, Lim JT, Beyreuther K, Zheng H, Tanzi RE, Masters CL, Bush AI. Neuron. 2001;30:665–676. doi: 10.1016/s0896-6273(01)00317-8. [DOI] [PubMed] [Google Scholar]
- 24.Perez LR, Franz KJ. Dalton Trans. 2010;39:2177–2187. doi: 10.1039/b919237a. [DOI] [PMC free article] [PubMed] [Google Scholar]
- 25.Pithadia AS, Lim MH. Curr. Opin. Chem. Biol. 2012;16:67–73. doi: 10.1016/j.cbpa.2012.01.016. [DOI] [PubMed] [Google Scholar]
- 26.Kay AR, Toth K. Sci. Signal. 2008;1:re3. doi: 10.1126/stke.119re3. [DOI] [PMC free article] [PubMed] [Google Scholar]
- 27.Paoletti P, Vergnano AM, Barbour B, Casado M. Neuroscience. 2009;158:126–136. doi: 10.1016/j.neuroscience.2008.01.061. [DOI] [PubMed] [Google Scholar]
- 28.Rana U, Kothinti R, Meeusen J, Tabatabai NM, Krezoski S, Petering DH. J. Inorg. Biochem. 2008;102:489–499. doi: 10.1016/j.jinorgbio.2007.10.030. [DOI] [PMC free article] [PubMed] [Google Scholar]
- 29.Anderegg G, Hubmann E, Podder NG, Wenk F. Helv. Chim. Acta. 1977;60:123–140. [Google Scholar]
- 30.Hyun HJ, Sohn JH, Ha DW, Ahn YH, Koh J-Y, Yoon YH. Invest. Ophth. Vis. Sci. 2001;42:460–465. [PubMed] [Google Scholar]
- 31.Canzoniero LMT, Manzerra P, Sheline CT, Choi DW. Neuropharmacology. 2003;45:420–428. doi: 10.1016/s0028-3908(03)00171-0. [DOI] [PubMed] [Google Scholar]
- 32.Carraway RE, Dobner PR. Biochim. Biophys. Acta. 2012;1823:544–557. doi: 10.1016/j.bbamcr.2011.09.013. [DOI] [PubMed] [Google Scholar]
- 33.Kolenko VM, Uzzo RG, Dulin N, Hauzman E, Bukowski R, Finke JH. Apoptosis. 2001;6:419–429. doi: 10.1023/a:1012497926537. [DOI] [PubMed] [Google Scholar]
- 34.Makhov P, Golovine K, Uzzo RG, Rothman J, Crispen PL, Shaw T, Scoll BJ, Kolenko VM. Cell Death Differ. 2008;15:1745–1751. doi: 10.1038/cdd.2008.106. [DOI] [PMC free article] [PubMed] [Google Scholar]
- 35.Johnson VL, Ko SC, Holmstrom TH, Eriksson JE, Chow SC. J. Cell Sci. 2000;113:2941–2953. doi: 10.1242/jcs.113.17.2941. [DOI] [PubMed] [Google Scholar]
- 36.Lee J-M, Kim Y-J, Ra H, Kang S-J, Han S, Koh J-Y, Kim Y-H. FEBS Lett. 2008;582:1871–1876. doi: 10.1016/j.febslet.2008.04.056. [DOI] [PubMed] [Google Scholar]
- 37.Yang Y, Kawataki T, Fukui K, Koike T. J. Neurosci. Res. 2007;85:2844–2855. doi: 10.1002/jnr.21411. [DOI] [PubMed] [Google Scholar]
- 38.Huang Z, Lippard SJ. In: Methods Enzymol. ch. 23. Conn PM, editor. Vol. 505. Academic Press; 2012. pp. 445–468. [DOI] [PMC free article] [PubMed] [Google Scholar]
- 39.Park JG, Qin Y, Galati DF, Palmer AE. ACS Chem. Biol. 2012;7:1636–1640. doi: 10.1021/cb300171p. [DOI] [PMC free article] [PubMed] [Google Scholar]
- 40.Pintauer T, Matyjaszewski K. Coord. Chem. Rev. 2005;249:1155–1184. [Google Scholar]
- 41.Suzuki M. Acc. Chem. Res. 2007;40:609–617. doi: 10.1021/ar600048g. [DOI] [PubMed] [Google Scholar]
- 42.Mandon D, Jaafar H, Thibon A. New J. Chem. 2011;35:1986–2000. [Google Scholar]
- 43.Ghosh SK, Kim P, Zhang X-a, Yun S-H, Moore A, Lippard SJ, Medarova Z. Cancer Res. 2010;70:6119–6127. doi: 10.1158/0008-5472.CAN-10-1008. [DOI] [PMC free article] [PubMed] [Google Scholar]
- 44.Hancock RD, Martell AE. Chem. Rev. 1989;89:1875–1914. [Google Scholar]
- 45.Allen CS, Chuang C-L, Cornebise M, Canary JW. Inorg. Chim. Acta. 1995;239:29–37. [Google Scholar]
- 46.Burdette SC, Walkup GK, Spingler B, Tsien RY, Lippard SJ. J. Am. Chem. Soc. 2001;123:7831–7841. doi: 10.1021/ja010059l. [DOI] [PubMed] [Google Scholar]
- 47.Walkup GK, Burdette SC, Lippard SJ, Tsien RY. J. Am. Chem. Soc. 2000;122:5644–5645. doi: 10.1021/ja010059l. [DOI] [PubMed] [Google Scholar]
- 48.Wong BA, Friedle S, Lippard SJ. J. Am. Chem. Soc. 2009;131:7142–7152. doi: 10.1021/ja900980u. [DOI] [PMC free article] [PubMed] [Google Scholar]
- 49.Margerum DW, Cayley GR, Weatherburn DC, Pagenkopf GK. In: Coordination Chemistry. ch. 1. Martell AE, editor. Vol. 2. Washington, D.C.: ACS; 1978. pp. 1–220. [Google Scholar]
- 50.Ambundo EA, Deydier M-V, Ochrymowycz LA, Rorabacher DB. Inorg. Chem. 2000;39:1171–1179. doi: 10.1021/ic990904p. [DOI] [PubMed] [Google Scholar]
- 51.Carr JD, Vasilliades J. Inorg. Chem. 1972;11:2104–2108. [Google Scholar]
- 52.Nolan EM, Ryu JW, Jaworski J, Feazell RP, Sheng M, Lippard SJ. J. Am. Chem. Soc. 2006;128:15517–15528. doi: 10.1021/ja065759a. [DOI] [PMC free article] [PubMed] [Google Scholar]
- 53.Zhang X-a, Hayes D, Smith SJ, Friedle S, Lippard SJ. J. Am. Chem. Soc. 2008;130:15788–15789. doi: 10.1021/ja807156b. [DOI] [PMC free article] [PubMed] [Google Scholar]
- 54.Buccella D, Horowitz JA, Lippard SJ. J. Am. Chem. Soc. 2011;133:4101–4114. doi: 10.1021/ja110907m. [DOI] [PMC free article] [PubMed] [Google Scholar]
- 55.Chang CJ, Nolan EM, Jaworski J, Okamoto K-I, Hayashi Y, Sheng M, Lippard SJ. Inorg. Chem. 2004;43:6774–6779. doi: 10.1021/ic049293d. [DOI] [PubMed] [Google Scholar]
Associated Data
This section collects any data citations, data availability statements, or supplementary materials included in this article.


