

Abstract
A high performance thin layer chromatography (HPTLC) method was developed and validated for determination of two anti-asthmatic drugs, salmeterol xinafoate and fluticasone propionate in co-formulations. Study was performed on pre-coated silica gel HPTLC plates using n-hexane:ethyl acetate:acetic acid (5:10:0.2) as a mobile phase. A TLC scanner set at 250 nm was used for direct evaluation of the chromatograms in reflectance/absorbance mode. Method was validated according to ICH guidelines. Determination coefficients of calibration curves were found 0.9977 and 0.9936 in the ranges 100–1000 and 200–2000 ng band−1 for salmeterol and fluticasone, respectively. Method had an accuracy of 99.5% for salmeterol and 102.01% for fluticasone. Method had the potential to determine these drugs simultaneously from dosage forms without any interference.
Keywords: Densitometric detection, High performance thin layer chromatography, Salmeterol xinafoate and fluticasone propionate combinations, Pharmaceuticals
1. Introduction
Salmeterol (Fig. 1a) is a long-acting and highly selective β2 agonist formulated as its 1-hydroxy-2-napthoate (xinafoate) salt used in the treatment of asthma and chronic obstructive pulmonary disease (Michael et al., 2000; Murnane et al., 2006). Fluticasone propionate (Fig. 1b) is a neutral, highly potent trifluorinated corticosteroid based on the androstane nucleus. It is effective in treatments of asthma and allergic rhinitis because of its anti-inflammatory activity (Laugher et al., 1999; Krishnaswami et al., 2000). These two drugs are formulated as dry powder inhalers or pressurized metered dose inhalers individually or in combined formulation (Ringdal et al., 2007).
Figure 1.

Chemical structures of salmeterol xinafoate (a) and fluticasone propionate (b).
Validated assays have been reported for each drug individually. For analysis of salmeterol xinafoate from body matrices, liquid chromatography with MS (You-xuan et al., 2003), MS/MS (Lehner et al., 2004) and fluorescence detection (Colthup et al., 2006) were reported. Spectrophotometric techniques have been reported for the determination of salmeterol xinafoate in its dosage forms (Chowdary and Rao, 1998, 1999; Reddy et al., 2000). Liquid chromatography coupled with APCI-MS (Yuan et al., 2001), and tandem mass spectrometers have been reported for the determination of fluticasone propionate in human plasma (Laugher et al., 1999; Krishnaswami et al., 2000; Vannecke et al., 2000).
There is a need for an assay method that permits simultaneous quantification of salmeterol xinafoate and fluticasone propionate. An HPLC method was reported for the concurrent analysis of these drugs in pressurized metered dose inhalers (Murnane et al., 2006). However, the detection in this method was done at 228 nm that is not free from interferences from solvents and other components. Moreover, the method was not validated for determination of these drugs in the powder for inhalers.
The aim of this work was to develop and validate a simple, rapid, selective and quite sensitive HPTLC assay method for simultaneous determination of salmeterol xinafoate and fluticasone propionate in bulk powders and dry powder inhalers. In addition, the method will be inexpensive and not requires certain types of stationary phases. Thus, it can represent another good alternative for the already existing HPLC methods especially that the detectors used for these methods are not present in most of the laboratories.
2. Experimental
2.1. Materials
Salmeterol xinafoate and fluticasone propionate working reference standards (Glaxowellcome, UK), analytical grade n-hexane (BDH, England), HPLC grade ethyl acetate (BDH, England), acetic acid (Fluka, Germany) and HPLC grade methanol (Sigma–Aldrich, Germany), were all obtained from Drug Administration and Control Authority of Ethiopia. The dosage forms (Seretide Accuhaler® 100/50, Seretide Accuhaler® 250/50 and Seretide Accuhaler® 500/50) were all purchased from retail out lets (Addis Ababa, Ethiopia).
2.2. Instrumentation
Microsyringe (Linomat syringe 659.004, Hamilton-Bonaduz schweiz, Camag, Switzerland), pre-coated silica gel 60 F-254 glass plates (10 × 10 cm with 200 μm, thickness HPTLC; Merck, Germany), linomat 5 applicator (Camag, Muttenz, Switzerland), twin trough chamber 20 × 10 cm (Camag, Muttenz, Switzerland), saturation pad (Camag, Muttenz, Switzerland), UV chamber (Camag, Muttenz, Switzerland), TLC scanner III (Camag, Muttenz, Switzerland), winCATS version 1.4.0 software (Camag, Muttenz, Switzerland) were used in this study. Microsoft excel was also used to treat data statistically.
2.3. Standard solutions
Stock standard solutions were prepared by dissolving 10 mg of salmeterol xinafoate and 20 mg of fluticasone propionate in 100 ml methanol to obtain concentration of 100 μg ml−1 and 200 μg ml−1 of salmeterol xinafoate and fluticasone propionate, respectively. Ten different concentration levels of working standard solutions were freshly prepared by diluting suitable volumes of the stock standard solution to 25 ml with methanol in appropriate volumetric flasks.
2.4. Sample solutions
2.4.1. Single-dose analysis
The contents of one blister were transferred quantitatively into 25 ml volumetric flask and the inner sides of the blister were washed with methanol three times. The volume was made up to about 20 ml with methanol and the contents were dissolved with the aid of shaking and sonication for about 10 min, then diluted to volume with the same solvent and filtered through 0.45 μm nylon syringe filters. Working sample solutions were freshly prepared by diluting suitable volumes of the stock sample solution to 25 ml with methanol in appropriate volumetric flasks.
2.4.2. Multi-dose analysis
The contents of five blisters were quantitatively transferred into 100 ml volumetric flask. The volume was made up to about 80 ml with methanol and the contents were dissolved with the aid of shaking and sonication for about 10 min, then diluted to volume with the same solvent and filtered through 0.45 μm nylon syringe filters. Working sample solutions were freshly prepared by diluting suitable volumes of the stock sample solution to 25 ml with methanol in appropriate volumetric flasks.
2.5. Chromatographic conditions
Sample was applied to the plate 10 mm from the bottom and 10 mm from the side edges in the form of band or streak with band length of 6 mm. The mobile phase consisted of n-hexane:ethyl acetate:acetic acid (5:10:0.2, v/v/v) and 15 ml of the mobile phase was used in each chromatographic run. Ascending development technique was carried out in a twin trough chamber. The optimized chamber saturation time for the mobile phase was 25 min at room temperature (20 ± 2 °C) that was assisted by saturation pad. The distance covered by the solvent front was 8 cm, which took about 15 min. The spots were scanned using the TLC scanner 3 in the reflectance/absorbance mode at 250 nm and all measurements were operated by winCATS software. Concentrations of the separated compounds were determined from the intensity of reflected light and peak areas were used for comparison.
2.6. Method validation
The method was validated in compliance with ICH guidelines (ICH 1994, 1996). The following parameters were used for validation of the developed method.
2.6.1. Linearity
Linear relationship between peak area and concentration of the drugs were evaluated over the range of concentrations expressed in ng band−1 by making five measurements at 10 concentration levels in the range of 100–1000 ng band−1 for salmeterol xinafoate and 200–2000 ng band−1 for fluticasone propionate, respectively.
2.6.2. Recovery studies
Recovery studies were carried out by spiking four different known amounts of the standard substances to the drug product (standard addition method). Hence, 125, 250, 375 and 500 ng band−1 of salmeterol xinafoate and 250, 500, 750 and 1000 ng band−1 of fluticasone propionate were spiked to the dosage form that contained 250 and 500 ng band−1 of salmeterol xinafoate and fluticasone propionate, respectively, after sample dilution.
2.6.3. Precision
Precision of the developed method was studied by considering intra-day precision, inter-day precision and variation between analysts.
2.6.4. Limits of detection and quantification
Determination of the detection and quantification limits was performed based on the standard deviations of the blank responses and the slope of the least square line parameters.
2.6.5. Specificity
Peak purity of both salmeterol xinafoate and fluticasone propionate was assessed to evaluate the specificity of the method. The spots of dosage forms were scanned at three different levels, i.e., peak start (S), peak apex (M), and peak end (E) positions. Correlation coefficients of these spectra were calculated. The spectra of dosage form and reference standards were also compared for both studied drugs.
2.6.6. Robustness
Composition of the mobile phase, volume of the mobile phase, time from spotting to development and time from development to scanning was involved in this study. The composition and volume of the mobile phase were varied in the range of ±10% of the used optimized conditions. Time variations were varied from the optimized times in the range of ±20% (Habte et al., 2009). The effect of these changes on both the Rf values and peak areas were evaluated by calculating the relative standard deviations (RSD) for each parameter.
3. Results and discussions
3.1. Method optimization for the HPTLC-densitometric measurements
Several trials were made by using different solvent systems containing non-polar solvents, relatively polar solvents and acetic acid. The use of acetic acid is mandatory to elute salmeterol from the site of application due to the fact that it is weakly basic and highly interacting with the stationery phase, especially the unreacted silanol groups of silica gel (Murnane et al., 2006; Capka and Carter, 2007). Among the different mobile phase combinations tested n-hexane:ethyl acetate:acetic acid (5:10:0.2) gave better resolution and sharper peaks with Rf values of 0.4 ± 0.04 and 0.6 ± 0.03 for salmeterol xinafoate and fluticasone propionate, respectively. Fig. 2 shows the HPTLC densitogram of the mixture using the optimal conditions.
Figure 2.
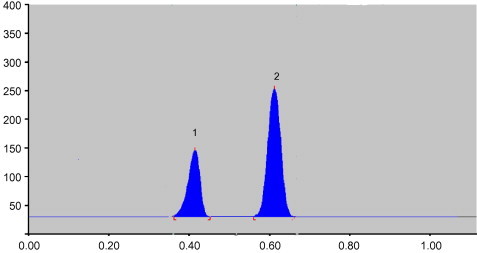
Typical densitogram of salmeterol xinafoate (1) and fluticasone propionate (2) spots of the reference standards with back ground noise correction.
3.2. Method validation
3.2.1. Linearity
Peak areas were found to have good linear relationship with the concentration than the peak heights. For fluticasone propionate, the r2 was found 0.9936, and for salmeterol xinafoate, the r2 was 0.9977. Calibration graphs were constructed in the ranges of 100–1000 ng band−1 for salmeterol xinafoate and 200–2000 ng band−1 for fluticasone propionate. The correlation coefficients, y-intercepts and slopes of the regression lines of the two compounds were calculated and presented in Table 1.
Table 1.
Summary of linear regression data for calibration curves using peak areas.
| Parameters | Fluticasone propionate | Salmeterol xinafoate |
|---|---|---|
| Linearity range | 200–2000 ng band−1 | 100–1000 ng band−1 |
| Linear regression equation | y = 5.2956x + 1336.9 | y = 6.3301x − 45.596 |
| Slope ± SD | 5.2956 ± 0.177 | 6.3301 ± 0.197 |
| Intercept ± SD | 1336.9 ± 105.3662 | −45.596 ± 64.32 |
| Correlation coefficient (r) | 0.9968 | 0.9989 |
| Determination coefficient (r2) | 0.9936 | 0.9977 |
| Limit of detection (LOD) | 65.681 | 33.532 |
| Limit of quantification (LOQ) | 199.033 | 101.611 |
3.2.2. Precision studies
Repeatability and intermediate precision of the developed method were expressed in terms of coefficients of variation (CV) of the peak area (Murnane et al., 2006; Sathe and Bari, 2007). The results showed that intra- and inter-day variation of the results at five different concentration levels of 300–700 ng spot−1 for salmeterol xinafoate and 600–1400 ng spot−1 for fluticasone propionate were within the acceptable range. The coefficients of variation for both the inter-day and intra-day precision of the method was found to be less than 4% for both drugs (Table 2). The dosage forms were also analyzed by three different analysts within the same day and the results revealed that there is good intermediate precision between analysts (Table 3) with coefficients of variation of 0.74 and 0.70 for salmeterol xinafoate and fluticasone propionate, respectively.
Table 2.
Intra- and inter-day precision for salmeterol xinafoate and fluticasone propionate.
| Compound | Amount (ng band−1) | Intra-day precision (n = 5) |
Inter-day precision (n = 5) |
||||
|---|---|---|---|---|---|---|---|
| Mean peak area | SD | CVa | Mean peak area | SD | CVa | ||
| Salmeterol xinafoate | 300 | 1874.5 | 16.7 | 0.9 | 1800 | 69.6 | 3.9 |
| 400 | 2566.0 | 65.9 | 2.6 | 2517.7 | 42.7 | 1.7 | |
| 500 | 3384.9 | 96.9 | 2.9 | 3317.3 | 58.6 | 1.7 | |
| 600 | 3925.0 | 99.5 | 2.5 | 3819.1 | 98.3 | 2.6 | |
| 700 | 4483.5 | 167.3 | 3.7 | 4427.4 | 55.2 | 1.2 | |
| Fluticasone propionate | 600 | 4631.7 | 102.5 | 2.2 | 4619.9 | 79.6 | 1.7 |
| 800 | 5811.7 | 87.6 | 1.5 | 5781.9 | 65.1 | 1.1 | |
| 1000 | 7140.4 | 94 | 1.3 | 7065.7 | 106.7 | 1.5 | |
| 1200 | 8048.9 | 124.5 | 1.5 | 7853.5 | 172.3 | 2.0 | |
| 1400 | 9075.8 | 136.4 | 1.5 | 8882.9 | 176.6 | 1.9 | |
Coefficient of variation.
Table 3.
Results for the study of variation between three different analysts.
| Analyst | Salmeterol xinafoate |
Fluticasone propionate |
||||
|---|---|---|---|---|---|---|
| Mean peak area (n = 6) | SD | CV1a | Mean peak area (n = 6) | SD | CV1a | |
| 1 | 3765.7 | 54.1 | 1.4 | 5709.9 | 82.4 | 1.4 |
| 2 | 3748.8 | 57.5 | 1.5 | 5757.6 | 65 | 1.1 |
| 3 | 3711.2 | 62.4 | 1.7 | 5789.8 | 78.4 | 1.3 |
| CV2b | 0.74 | 0.70 | ||||
CV1 is the coefficient of variation for six determinations of the same analyst for each substance.
CV2 is the coefficient of variation between the three analysts for each substance.
3.2.3. Accuracy/recovery studies
The percentage recovery at four levels (Argekar et al., 1996), in the range from 250 to 750 ng band−1 for salmetrol xinafoate and from 500 to 1500 ng band−1 for fluticasone propionate were studied and found to be satisfactory (Table 4). For fluticasone propionate, the recoveries were found between 97.1% and 103.5% and for salmeterol xinafoate the recoveries were found between 99.2% and 101.7%.
Table 4.
Recovery study of the method (using the standard addition method) for salmeterol xinafoate and fluticasone propionate (n = 6 for both drugs).
| Number of levels | Salmeterol xinafoate |
Fluticasone propionate |
||||||
|---|---|---|---|---|---|---|---|---|
| Initial amount (ng band−1) | Amount added (mg) | Amount added (ng band−1) | % Recovery | Initial amount (ng band−1) | Amount added (mg) | Amount added (ng band−1) | % Recovery | |
| 1 | 250 | 0.125 | 125 | 99.2 | 500 | 0.250 | 250 | 103.5 |
| 2 | 250 | 0.250 | 250 | 99.5 | 500 | 0.500 | 500 | 100.3 |
| 3 | 250 | 0.375 | 375 | 101.7 | 500 | 0.750 | 750 | 97.7 |
| 4 | 250 | 0.500 | 500 | 99.2 | 500 | 1.000 | 1000 | 100.9 |
| Accuracy % | 99.5 | 102.01 | ||||||
3.2.4. Limits of detection and quantitation
The limits of detection and quantification of the developed method were calculated using 3α/S and 10α/S phenomena for the limits of detection and quantification, respectively (Eric-Jovanovic et al., 1998), where α is the standard deviation of the y-intercepts and S is the slope of the calibration curve. The limits of detection and quantification (Table 1) were found to be 65.68 ng band−1 and 199.033 ng band−1, respectively, for fluticasone propionate. For salmeterol xinafoate, were found 33.53 ng band−1 and 101.61 ng band−1, respectively.
3.2.5. Specificity
The peak purity test of fluticasone propionate and salmeterol xinafoate spots were assessed by comparing their respective spectra at peak start, peak apex and peak end positions of the spot (Sathe and Bari, 2007). The results of spectral comparison for salmeterol xinafoate were found to be 0.9998 and 0.9998 at peak start–peak apex and at peak apex–peak end, respectively. Similarly, for fluticasone propionate the results were 0.9997 and 0.9996. The closeness of peak purity values to 1 indicates that the spots were only attributed to a single compound. Good correlation (r = 0.9995 and 0.9996) was also obtained between standard and sample spectra of fluticasone propionate and salmeterol xinafoate, respectively. The UV spectra comparison of the spots of the standards and dosage forms for the study substances were presented in Fig. 3.
Figure 3.
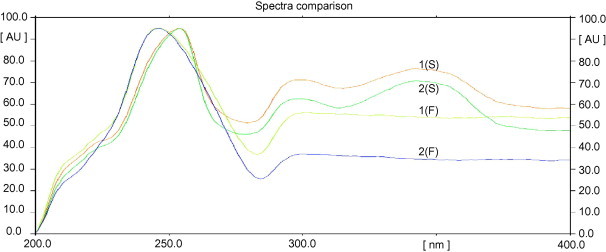
UV spectra comparison of the spots of the standards (1) and dosage forms (2) for salmeterol xinafoate (S) and for fluticasone propionate (F).
3.2.6. Robustness
The standard deviations of peak areas were calculated for the aforementioned four parameters (variation in composition of the mobile phase, volume of the mobile phase, time from spotting to development and time from development to scanning) and coefficients of variation were found to be less than 2.5% in all cases as shown in Table 5. The low CV values, indicate the robustness of the method.
Table 5.
Robustness study for the developed method (n = 5).
| Parameter studied | Salmeterol xinafoate |
Fluticasone propionate |
||
|---|---|---|---|---|
| SDa | CVa | SDa | CVa | |
| Composition of mobile phase | 130.4 | 1.49 | 358.9 | 2.3 |
| Volume of mobile phase | 127.8 | 1.46 | 344.3 | 2.21 |
| Time from spotting to development (5–60 min) | 55.29 | 0.63 | 256.8 | 1.65 |
| Time from development to scanning (5–60 min) | 40.9 | 1.1 | 22.2 | 0.40 |
SD and CV were calculated from the peak areas of densitograms.
3.3. Analysis of commercial dosage forms
The commercial dosage forms, Sereretide Accuhaler® 100/50, 250/50 and 500/50 have been analyzed using the developed method. Two approaches were employed in this study, single-dose analysis and multi-dose analysis due to the great variation in the inhaler blisters content. In the case of single-dose analysis, the content of single blister was taken whereas in the case of multi-dose analysis the contents of five blisters were taken quantitatively. In general acceptable results were obtained for both drugs and were in good agreement with the label claims. The results of the commercial dosage form analysis have been presented in Table 6.
Table 6.
Assay results of the commercial dosage forms (n = 6).
| Methods | Parameters | Seretide Acchaler® 100/50 |
Seretide Acchaler® 250/50 |
Seretide Acchaler® 500/50 |
|||
|---|---|---|---|---|---|---|---|
| Salmeterol xinafoate | Fluticasone propionate | Salmeterol xinafoate | Fluticasone propionate | Salmeterol xinafoate | Fluticasone propionate | ||
| SDAa | Content (%) | 97.9 ± 4.3 | 105.6 ± 1.1 | 100.4 ± 3.3 | 100.4 ± 2.6 | 96.18 ± 2.2 | 105.64 ± 0.11 |
| CVc | 4.39 | 1.03 | 1.33 | 2.41 | 2.3 | 0.107 | |
| MDAb | Content (%) (n = 5) | 101.0 ± 1.5 | 105.1 ± 0.29 | 104.3 ± 0.93 | 105.3 ± 1.9 | 97.17 ± 2.7 | 108.1 ± 0.72 |
| CVc | 1.43 | 2.75 | 0.925 | 1.76 | 2.74 | 0.667 | |
| Average | Content (%) | 99.4 ± 2.2 | 105.3 ± 0.34 | 100.4 ± 0.007 | 106.3 ± 1.5 | 96.67 ± 0.7 | 106.87 ± 1.74 |
| CVc | 2.24 | 0.33 | 0.007 | 1.37 | 0.72 | 1.63 | |
SDA: single-dose analysis.
MDA: multi-dose analysis (n = 5).
CV: coefficient of variation.
3.4. Sample solution stability study
Sample solution was prepared and was kept at room temperature (20 ± 2 °C) on a shelf protected from direct light. The solution was analyzed after 20 min, 3 h, 8 h, 24 h, 4 days and 12 days. Because of the time needed for sonication and filtration, the fastest possible analysis was carried out within 20 min and hence results of the remaining analysis times were compared with it. The average peak areas and the CV values are presented in Table 7. The average peak areas of fluticasone propionate were significantly varied from the reference time (p = 0.05, t stat. = 4.73, n = 6) after 24 h and for salmeterol xinafoate after 4 days of sample preparation (p = 0.05, t stat. = 5.12, n = 6). Therefore, in order to decrease systematic errors because of test solution instability, the analysis should be carried out within 24 h of sample preparation.
Table 7.
Solution stability study.
| Time of analysis | Salmeterol xinafoate |
Fluticasone propionate⁎⁎ |
||
|---|---|---|---|---|
| Average peak area (n = 6) ± SD | CVa | Average peak area (n = 6) ± SD | CVa | |
| 20 min | 3828.67 ± 114.7 | 2.03 | 5615.95 ± 60.3 | 2.17 |
| 3 h | 3795.11 ± 52.0 | 2.87 | 5742.12 ± 101.9 | 0.99 |
| 8 h | 3830.88 ± 52.2 | 0.95 | 5524.711 ± 36.2 | 0.95 |
| 24 h | 3807.87 ± 35.84 | 1.01 | 5498.48 ± 38.7 | 0.65 |
| 4 days | 3543.85 ± 109.3 | 1.27 | 5266.6 ± 48.5 | 1.90 |
| 12 days | 2974.7 ± 67.3 | 1.51 | 5263.12 ± 57.9 | 1.20 |
CV: coefficient of variation.
Multi dose analysis.
4. Conclusion
The developed HPTLC/densitometric method was found to be simple, rapid, selective, quite sensitive and suitable for simultaneous determination of salmeterol xinafoate and fluticasone propionate in three different strengths of Seretide Accuhaler®. Statistical analysis proved that the method is repeatable, accurate and specific for the analysis of salmetrol xinafoate and fluticasone propionate. The method can minimize the cost of reagents and time for analysis. It also utilized the merit of applying several sample spots on HPTLC plate, which may be more advantageous for regulatory quality control laboratories especially to facilitate the post-marketing surveillance program. In addition, the method is inexpensive and not requires certain types of stationary phases. Thus, it can represent another good alternative for the already existing HPLC methods especially those using certain types of detectors which are not present in most of the laboratories.
Contributor Information
Lantider Kasaye, Email: ethiolk@yahoo.com.
Ariaya Hymete, Email: hymete@yahoo.com.
Abdel-Maaboud I. Mohamed, Email: aimrageh@yahoo.com.
References
- Argekar A.P., Kunjir S.S., Purandare K.S. Simultaneous determination of rifampicin, isoniazid and pyrazinamide by high performance thin layer chromatography. J. Pharm. Biomed. Anal. 1996;14:1645–1650. doi: 10.1016/0731-7085(96)01787-6. [DOI] [PubMed] [Google Scholar]
- Capka V., Carter S.J. Minimizing matrix effects in the development of a method for the determination of salmeterol in human plasma by LC/MS/MS at low pg/mL concentration levels. J. Chromatogr. B. 2007;856:285–293. doi: 10.1016/j.jchromb.2007.06.010. [DOI] [PubMed] [Google Scholar]
- Chowdary K.P.R., Rao G.D. New spectrophotometric method for determination of salmeterol xinafoate. Indian J. Pharm. Sci. 1998;60:294–296. [Google Scholar]
- Chowdary K.P.R., Rao G.D. Visible spectrophotometric method for the determination of salmeterol xinafoate. Sci. Publ. Indian Pharm. Assoc. 1999;61:246–248. [Google Scholar]
- Colthup P.V., Young G.C., Felgate C.C. Determination of salmeterol in rat and dog plasma by high performance liquid chromatography with fluorescence detection. J. Pharm. Sci. 2006;82:323–325. doi: 10.1002/jps.2600820321. [DOI] [PubMed] [Google Scholar]
- Eric-Jovanovic S., Agbaba D., Zivanov-Stakic D., Vladimirov S. HPTLC determination of ceftriaxone, cefixime and cefotaxime in dosage forms. J. Pharm. Biomed. Anal. 1998;18:893–898. doi: 10.1016/s0731-7085(98)00274-x. [DOI] [PubMed] [Google Scholar]
- Habte G., Hymete A., Abdel-Maabboud I.M. Simultaneous separation and determination of lamivudine and zidovudine in pharmaceutical formulations using the HPTLC method. Anal. Lett. 2009;42:1–19. [Google Scholar]
- Krishnaswami S., Helmut M.I., Derendorf H., Hochhaus G. A sensitive LC–MS–MS method for the quantification of fluticasone propionate in human plasma. J. Pharm. Biomed. Anal. 2000;22:123–129. doi: 10.1016/s0731-7085(99)00246-0. [DOI] [PubMed] [Google Scholar]
- Laugher L., Noctor T.G., Barrow A., Oxford J.M., Phillips T. An improved method for determination of fluticasone propionate in human plasma. J. Pharm. Biomed. Anal. 1999;21:749–758. doi: 10.1016/s0731-7085(99)00213-7. [DOI] [PubMed] [Google Scholar]
- Lehner A.F., Hughes C.G., Krapiesiuk W., Camargo F.C., Harkins J.D., Woods W.E., Bosken J., Boyles J., Troppmann A., Tobin T. Determination of salmeterol xinafoate in equine urine and serum by using LC/MS/MS. Chromatographia. 2004;59:355–360. [Google Scholar]
- Michael Y., Chowdhry B.Z., Ashurst I.C., Snowden M.J., Gray S. The physico-chemical properties of salmeterol and fluticasone propionate in different solvent environments. Int. J. Pharm. 2000;200:279–288. doi: 10.1016/s0378-5173(00)00397-5. [DOI] [PubMed] [Google Scholar]
- Murnane D., Martin G.P., Marriot C. Validation of a reverse-phase high performance liquid chromatographic method for concurrent assay of a weak base (salmeterol xinafoate) and a pharmacologically active steroid (fluticasone propionate) J. Pharm. Biomed. Anal. 2006;18:1149–1154. doi: 10.1016/j.jpba.2005.09.028. [DOI] [PubMed] [Google Scholar]
- Reddy M., Rao K., Rao S., Rao M.E. Spectrophotometric method for determination of salmeterol xinafoate. Indian J. Pharm. Sci. 2000;62:193–195. [Google Scholar]
- Ringdal N., Eliraz A., Pruzinec P., Weber H.H., Mulder P.G.H., Akveld M., Bateman E.D. The salmeterol/fluticasone combination is more effective than fluticasone plus oral montelukast in asthma. Respir. Med. 2007;97:234–241. doi: 10.1053/rmed.2003.1436. [DOI] [PubMed] [Google Scholar]
- Sathe S., Bari S. Simultaneous analysis of losartan potassium, atenolol, and hydrochlorothiazide in bulk and tablets by HPTLC/UV densitometry. Acta Chromatogr. 2007;19:270–278. [Google Scholar]
- Vannecke C., Nguyet A., Bloomfield M.S., Staple A.J., Heyden Y., Massart D.L. Development and optimization of a flow injection assay for fluticasone propionate using an asymmetrical design and the variable-size simplex algorithm. J. Pharm. Biomed. Anal. 2000;23:291–306. doi: 10.1016/s0731-7085(00)00302-2. [DOI] [PubMed] [Google Scholar]
- You-xuan Xu., Yang Qin., Philip Liu.Xin. Determination of salmeterol and its metabolite in rat urine by LC/MS. J. Chin. Med. Assoc. 2003;24:417. [Google Scholar]
- Yuan N.L., Tattam B., Brown F., Paul J. Quantification of fluticasone propionate in human plasma by liquid chromatography-atmospheric pressure chemical ionization tandem mass spectrometry. J. Chromatogr. B. 2001;761:177–185. doi: 10.1016/s0378-4347(01)00329-2. [DOI] [PubMed] [Google Scholar]