

Abstract
Previous investigations consistently report a negative association between body mass index (BMI) and response in the caudate nucleus during the consumption of palatable and energy dense food. Since this response has also been linked to weight gain, we sought to replicate this finding and determine if the reduced response is associated with measures of impulsivity or food reward. Two studies were conducted in which fMRI was used to measure brain response to milkshake and a tasteless control solution. In study 1 (n = 25) we also assessed self-reported impulsivity, willingness to work for food, and subjective experiences of the pleasantness of milkshake taste and aroma. Replicating prior work, we report a negative association between BMI and brain response to milkshake vs. tasteless in the caudate nucleus. The opposite pattern was observed in the ventral putamen, with greater response observed in the 13 overweight compared to the 12 healthy weight subjects. Regression of brain response against impulsivity and food reward measures revealed one significant association: in the overweight but not healthy weight group self-reported impulsivity was negatively associated with caudate response to milkshake. In study 2 (n = 14), in addition to assessing brain response to milkshake and tasteless solutions subjects completed a go/no-go task outside the scanner. As predicted, we identified an inverse relationship between caudate response to milkshake vs. tasteless and failure to inhibit responses on the no go trials. We conclude that the inverse correlation between BMI and caudate response to milkshake is associated with impulsivity but not food reward. These findings suggest that response to milkshake in the dorsal striatum may be related to weight gain by promoting impulsive eating behavior.
Keywords: BIS-11, BMI, caudate, habit, impulsivity, reward
1. Introduction
In previous studies, we and others [1–5] have reported a negative association between body mass index (BMI) and brain response to palatable food consumption in the dorsal striatum. The association is significant because two studies have linked this response to weight change. In the first, the magnitude of the decreased response positively predicted weight gain in women of varying BMI who possessed a copy of the A1 allele of the TaqIA A1 polymorphism [3]. Since carriers of the A1 allele exhibit decreased D2 receptor density [6–8], it was suggested that the blood oxygen level dependent (BOLD) response reflected decreased dopamine signaling, a possibility consistent with reports of decreased binding potential for D2 receptors in obese humans [9]. Additionally, it was hypothesized that the reduced BOLD response reflected a reward deficient state that increased risk for obesity as individuals consumed greater amounts of food rewards to compensate for reward deficiency [10].
In the second study brain response to milkshake was assessed at baseline and following a 6-month weight loss trial. Participants were divided into groups depending on whether they were weight stable or gained or lost weight. Eight women in the sample gained at least 4% of their body mass and exhibited a significant decrease in dorsal striatal response to milkshake at post compared to pre-test. This result suggested that decreased striatal response reflected a neural adaptation resulting either from increased adiposity or overeating. Consistent with this hypothesis, research in experimental animals showed that exposure to a high fat diet results in weight gain and reduced striatal D2 receptors [11]. Intriguingly, the high fat diet also resulted in increased thresholds for brain stimulation reward and insensitivity to negative outcomes, which resulted in compulsive eating [11].
A critical outstanding question is therefore whether reduced BOLD responses observed in obese humans might be associated with insensitivity to negative outcomes and/or reward deficiency. A wealth of literature indirectly supports both possibilities. The dorsal striatum has been implicated in habitual, impulsive and automatic responding [12–14], all characterized by insensitivity to negative outcomes, and in representing the reinforcement value of food [15]. Moreover, both insensitivity to negative outcomes and food reward have been associated with BMI [16–18]. What is unknown is whether response in the dorsal striatum to palatable food consumption is associated with either reward deficiency or insensitivity to negative outcomes. The aim of the current investigation was therefore to answer this question.
Two studies were performed. Functional magnetic resonance imaging (fMRI) was used in both to the measure BOLD response to milkshake consumption. In addition, participants completed questionnaires about their eating style. In study 1, sensitivity to food reward was assessed by measuring willingness to work for food vs. money [19] and ratings of the perceived pleasure of food aromas and flavors and impulsivity was measured with the Barrett Impulsivity Scale (BIS), which assess motor, attentional, and non-planning impulsivity [20]. In study 2 we employed a similar design, and also included a behavioral measure of impulsivity.
2. Materials and Methods
2.1 Study 1
2.1.1 Subjects
A total of 26 right-handed subjects were recruited from the greater New Haven area through flyer advertisement. All subjects were screened over the phone to be free of psychiatric disorders, depression, eating disorders, dieting behavior, alcoholism, tobacco use, drug abuse, history of head injury with loss of consciousness, use of daily medication, chemosensory impairments and food allergies. Participants who scored higher than 27 on the Binge Eating Scale [21] indicative of significant eating disorder pathology, were also excluded from the study during the phone interview. One subject was excluded for excessive movement during scanning (greater than 2mm). Subjects were recruited based on their self-reported BMI, which was later confirmed in lab. Twelve were healthy weight (HW) (BMI<25) and 13 were overweight/obese (OW) group (BMI≥25) based on the U.S. Center for Disease Control and Prevention guidelines. The demographic characteristics of these groups are shown in Table 1. All subjects provided written informed consent at their first lab visit and the study was approved by the Yale Human Investigations Committee.
Table 1.
Study 1 Subject Demographic Data.
| Healthy weight | Overweight | p | |
|---|---|---|---|
| Age | 23.1 ± 0.99 | 25.5 ± 1.66 | 0.23 |
| Education (yrs) | 16.2 ± 0.65 | 15.3 ± 0.52 | 0.31 |
| BMI | 21.94 ± 0.51 | 31.2 ± 1.42* | <0.001 |
significantly different from Healthy weight group.
2.1.2 Stimuli
The chocolate flavor consisted of 100ml Hershey's Cookies `n' Cream milkshake diluted with 10ml of distilled water and the strawberry flavor consisted of 100ml Garelick Ultimate strawberry milk to which 5 grams of sucrose and 1ml of strawberry flavor (Galaxy flavor) were added. The tasteless solution was designed to mimic the ionic components of saliva [22]. We used the tasteless solution as the control stimulus since water activates taste cortex [23, 24] and has a taste [25]. Subjects were presented with four versions of the tasteless solution (2.5 mM sodium bicarbonate and 25mM potassium chloride, plus three dilutions at 25%, 50%, and 75% of the original concentration) and asked to select the one that tasted most like nothing. This selection was designated the tasteless solution for that subject. The food odors were chocolate-cookie and strawberry and cream odors (6002335, 6106524 from Bell Labs Flavors and Fragrances, Inc, IL) and the floral odors were rose and lilac odorant (6104579, 6002335, Bell Labs Flavors and Fragrances, Inc, IL). The food odors were selected in pilot tests to best match the flavors of the milkshakes. The milkshakes and odors were also selected to have similar intensity and pleasantness ratings.
2.1.3 Stimulus delivery
The liquid flavors were delivered to the subjects through a portable gustometer system as 0.5ml of solution infused into the mouth over 3 seconds. Detailed description of the gustometer system can be found in Veldhuizen and colleagues [26]. In brief, the flavors are held in 60 ml syringes, loaded into BS-8000 syringe pumps (Braintree Scientific, Braintree, MA). Each syringe infuses liquids into 25 feet of Tygon beverage tubing (Saint-Gobain Performance Plastics, Akron, OH) that connects to a custom-designed Teflon gustatory manifold mounted on the MRI headcoil. The manifold has a series of ports into which the tubes connect and then individually machined channels that funnel into a sphere that rests comfortably at the tip of the mouth and allows the liquids to drip from a sphere onto the tongue.
Odors were presented by a custom-built, MRI-compatible olfactometer programmed in labview (National Instruments, TX). The design is based upon that designed by Johnson and colleagues [27]. A detailed description of the olfactory stimulation system can be found in a previous publication [28]. In brief, mass flow controllers (MKS Instruments, Andover, MA) adjust the flow of humidified and temperature controlled air over stainless steel wells containing an odorant, allowing it to pick up vaporized odor molecules. The independent odor channels then converge into a mixing manifold and exit through one of two 25 foot Teflon tubes where the first is dedicated to odors and the second is dedicated to clean air. The trunk terminates in a custom-built Teflon manifold (Teqcom, Santa Ana, CA) placed on the subject's chest. A vacuum line connected to the manifold creates a closed loop to evacuate odorless and odorized air and prevent contamination of the head space. The subjects receive the olfactory stimuli through a nasal mask (Sleepnet, Manchester, NH) connected to the manifold. Air exits the nasal manifold and is drawn out through a final Teflon tube by another vacuum line.
2.1.4 Experimental Procedures
Subjects participated in one behavioral and fMRI training session, one fMRI scanning session, and one follow-up session each conducted on separate days. All testing occurred between 11am and 1pm. Subjects were instructed to arrive “neither hungry nor full” and to abstain from eating or drinking anything except water two hours prior to their arrival. At the start and finish of each session subjects rated feelings of hunger using a 200mm visual analogue scale labeled (−10 = “I am not hungry at all”; 0 = “neutral”, and +10 = “I have never been more hungry”.
2.1.5 Behavioral and fMRI training session
Anthropometric and behavioral measurements were taken at the beginning of the session. Body weight and height were measured using a Detecto 439 balance beam scale with stadiometer. Body Mass Index (BMI) was calculated as weight (in kilograms) divided by the squared height (in meters) of the subject (BMI=kg/m2). Subjects also completed a battery of questionnaires to assess their eating behaviors and personality traits. Personality was measured with the Tridimensional Personality Questionnaire (TPQ) [29] and trait impulsivity with the Barratt Impulsiveness Scale Version 11 (BIS-11) [20]. Eating behavior related traits were measured with the Dutch Eating Behavior Questionnaire (DEBQ) [30], the Three Factor Eating Questionnaire (TFEQ) [31], and the Binge Eating Scale (BES) [21]. Food reinforcement was also measured using a modified version of the Behavioral Choice Questionnaire used by Epstein and colleagues to measure the amount of work a subject is willing to perform for either a monetary or a food reward [32]. The questionnaire consists of 16 questions in which the subject chooses whether they would press a button X amount of times to receive a chocolate chip cookie or 20 times to receive 50 cents, where X ranges from 20 to 320. The primary modifications are the use of 50 cents rather than $1.00 and the use of chocolate chip cookies rather than a favorite snack food. Relative reinforcement was operationalized as the amount of button presses a subject is willing to make to receive a food reward. To insure that Ss make valid responses they were told that they will be required to perform 2 of their choices, determined by drawing two numbers from a hat (numbers vary from 1–16).
Subjects were then brought to the fMRI simulator and outfitted with the taste and olfactory delivery systems. After inserting the subject into the bore of the simulator, each stimulus was delivered and subjects were asked to rate the intensity, pleasantness, familiarity and how much they wanted to eat the stimulus using a button box. The box allowed the subject to move the cursor of the scale to a desired location on a computer screen viewed via back projection on a headcoil mounted mirror. Intensity was measured using an adapted cross-modal general Labeled Magnitude Scale [33]. The scale consisted of a 100mm vertical line scale with the labels “barely detectable” at the lower anchor point and “strongest imaginable sensation” at the upper anchor point. The pleasantness, familiarity and wanting to eat were rated on 200mm cross-modal visual analogue scales labeled at the left (−10), center (0) and right (+10) anchor points. Pleasantness labels were “most unpleasant sensation ever” at (-10), neutral at (0) and “most pleasant sensation ever” at (+10). Familiarity labels were “not familiar at all” (−10), “neutral” (0) and “very familiar” (+10). Wanting to eat labels were “not edible at all” (−10), “neutral” (0) and “I would want to eat this more than anything” (+10).
After completing the ratings, subjects underwent a single simulated scanner run (see paradigm description in Figure 1). During this simulated run one of the food aromas was designated as the FO+ and the other was designated as the FO−. The attribution of each odor to either category was counterbalanced across subjects. The FO+ was followed by delivery of its associated milkshake 100% of the time and the FO− was followed by delivery of the tasteless solution 100% of the time. Odor delivery was always timed to occur immediately following the spoken instructions “three, two, one, sniff” so that delivery was time-locked to sniff onset. Olfactory stimulation lasted for three seconds followed by a 1 to 7 seconds period of rest prior to delivery of the milkshake or tasteless solution over the subsequent three seconds. Subjects were asked to press as quickly as possible button A if they received the milkshake and button B if they had received the tasteless solution. A second period of 1 to 7 seconds of rest followed the delivery of the milkshake or tasteless after which subjects were delivered a 3 second rinse which was followed by a final period of 4 to 11 seconds of rest before the start of the next trial. The subjects were instructed to keep the milkshake or tasteless solution in their mouth briefly and then swallow. The floral odor and odorless events were followed by 10–16 seconds of rest at the end of the 3 seconds odorant delivery and no liquid delivery occurred following their delivery. During the simulated run subjects received a total of 20 repeats of each of the conditions (FO+, FO−, floral, odorless). Perceptual ratings were assessed again following the simulation run.
Figure 1.
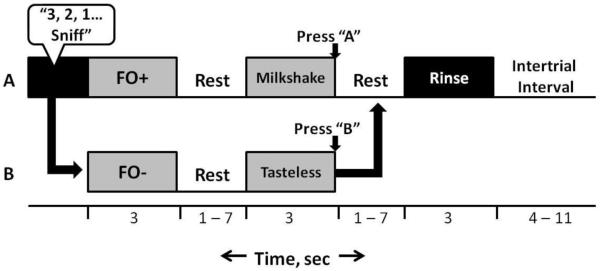
The protocol/paradigm used for the scanning and mock session. The timeline depicts the series of events for the delivery of (A) FO+ / milkshake and (B) FO− / tasteless solution. Following the audible instructions “3, 2, 1, Sniff,” either the FO+ or FO− is delivered for three seconds. This is then followed by a 1–7 second rest period, and then either milkshake or tasteless solution, respectively. Another 1–7 second rest period precedes the delivery of a rinse. Finally, 4–11 seconds pass before the next trial.
2.1.6 fMRI scanning session
On a separate day subjects arrived at 11am to participate in the fMRI scanning session. Subjects were again instructed to eat two hours prior to their session and then refrain from eating or drinking, with the exception of water, until their arrival. Hunger ratings were obtained upon arrival of the subject and detailed instructions about the scanning procedure were then provided. The participants were then outfitted with the delivery devices and perceptual ratings were measured as described above.
Imaging data were acquired on a Siemens 3Tesla Trio magnetom Scanner at the Yale University Magnetic Resonance Research Center. Subjects were given earplugs to reduce noise from the scanner and were instructed to keep their eyes closed and refrain from unnecessary movements during the scan. A vitamin E pill was taped to the subject's left temple to indicate image laterality. High-resolution T1-weighted structural scans were acquired for each subject with TR=2530ms, TE=3.66 ms, flip angle=7°, matrix=256x256, 1mm thick slices, FOV=256, 176 slices.
The subjects underwent two different types of fMRI runs. One was optimized to measure response to odorants (odor-optimized) and the other optimized to measure response to milkshakes (taste-optimized). A susceptibility weighted single-shot echoplanar sequence was used to image regional distribution of the blood oxygenation level dependent (BOLD) signal. At the beginning of each functional run, the MR signal was allowed to equilibrate over 6 scans for a total of 12 seconds, which were subsequently excluded from the analyses. Acquisition parameters were: TR=2000ms, TE=20ms, flip angle=80 °, FOV=220, matrix=64x64, slice thickness=3mm. Forty contiguous slices were acquired in an interleaved method to reduce the cross-talk of the slice selection pulse.
The odorant-optimized runs were similar to the simulated scanner run described above except that the FO+ and FO− were followed by the delivery of their respective solutions (milkshake and tasteless) only 60% of the time. This resulted in 40% of the trials being “unpaired”, enabling us to isolate responses to the predictive and non-predictive food aromas uncontaminated by the responses to the milkshake and tasteless solution deliveries. There were 20 repetitions of the 4 events of interest across 5 runs, each lasting 8 minutes.
Since the milkshake and tasteless events of the odor-optimized runs were preceded by odor delivery, we could not rule out the possibility that odor events could contribute to the BOLD signal modeled from the onset of the solution delivery. We therefore created a second run type optimized to measure brain response to milkshake and to tasteless. During the taste-optimized runs, the subjects heard the word “liquid” (2s) alerting them to the subsequent delivery of the taste stimuli which occurred over 3 seconds. The milkshake and tasteless solutions corresponded to the ones used in the odor-optimized runs and their delivery was followed by a 3 to 10 seconds jitter during which the subject could swallow. If milkshake was delivered, a 3 seconds rinse with tasteless solution then occurred and was also followed by a 3 to 10 seconds rest period. There were 20 repetitions of each of the two events of interest (milkshake and tasteless) over two runs, each lasting 4 minutes 21 seconds. The taste-optimized runs always followed the odor-optimized runs.
2.1.7 Data analysis
Ratings and behavioral data were analyzed in SPSS 19 (SPSS Inc., Chicago, IL, USA) using analyses of variance. Significant effects were further interrogated with pairwise comparisons.
Neuroimaging data were analyzed using the SPM5 software (Statistical Parametric Mapping, Wellcome Department of Imaging Neuroscience, London, UK) in MATLAB 7.3.0 (Mathworks, Inc., Sherborn, MA). Functional images were time-acquisition corrected to the slice obtained at 50% of the TR and realigned to the mean image. Anatomical and functional images were normalized to the standard MNI template brain implemented in SPM5, resulting in voxel sizes of 3 mm3 and 1 mm3 respectively. Functional time-series data was detrended, a method which eliminates at each voxel any linear component matching the global signal [34]. Functional images were smoothed using a 6 mm FWHM isotropic Gaussian kernel. Sessions where head movement during scanning exceeded a predetermined limit of 2 mm in any direction were excluded.
Two design matrices were created for each subject; one for the odorant-optimized runs and one for the taste-optimized runs. Each design matrix specified the onset and duration of each of the events of interest. The odorant-optimized runs produced four events of interest: 1) the unpaired FO+, 2) the unpaired FO− (from now on simply referred to as FO+ and FO−), the floral odor, and 4) odorless. All other events within these trials (paired FO+ and FO−, tasteless, milkshake, instructions, rinses) were modeled as events of no interest. The milkshake-optimized run produced two events of interest. Event onsets were defined as the beginning of liquid delivery and event durations were defined as the three seconds of taste delivery plus the jitter that followed. The rinse was modeled as an event of no interest. According to SPM5 convention, a 128 Hz high-pass filter was applied to the time-series data with the aim to remove low-frequency noise and slow signal drifts. The general linear model was employed to estimate, at each voxel, condition-specific effects. A canonical hemodynamic response function (HRF), including a temporal derivative, was used to model neural response to events.
To assess group effects we used one- and two sample t-tests random effects analyses. The t-map threshold was set at puncorrected < 0.005 and a 5-voxel cluster size. Unpredicted responses were considered significant at p < 0.05 False Discovery Rate (FDR) corrected across the entire brain for multiple comparisons. For predicted responses we used a region of interest (ROI) approach. WFU Pick-atlas was used to define region of interests (ROI) and peaks were considered significant at p < 0.05 FDR corrected across the total number of voxels across all ROIs [35]. ROIs included the caudate nucleus [3] as well as regions identified by Beaver and colleagues [36] in which a positive relationship was observed between brain response to food pictures and sensitivity to reward ventral striatum, amygdala, midbrain and orbitofrontal cortex – OFC, as well as regions shown to be sensitive to the value of consummatory food reward (insula, OFC, midbrain, hippocampus, and mediodorsal thalamus) [37]. We also interrogated responses in regions associated with inhibitory control of eating (dorsolateral prefrontal cortex [38]; inferior frontal gyrus [39]).
2.2 Study 2
An additional 14 subjects (4 male, 10 female; Age=24.9 ± 1.4; BMI=25.2 ± 1.2, all right-handed) were recruited as a part of a separate long-term study using similar methods and criteria. Subjects were scanned three times, with scans performed on separate days. On each day, subjects underwent 2 runs of 6:32 in duration in which their brain responses to chocolate and strawberry milkshakes as well as a tasteless solution were recorded. These runs differed from the taste-optimized runs in Study 1 in that subjects did not receive an auditory cue alerting them to the impending liquid taste, and that each run contained 10 repetitions of each event of interest rather than 20. Imaging data were acquired on an updated Siemens 3T TIM Trio magnet using the same acquisition parameters as Study 1, and were analyzed using SPM 8. Scanning runs consisted of 2 different types of stimulus: (1) a 4 second delivery of flavored milk, followed by a 6–13 second timeout, a 4 second rinse, and a 6–13 second rest period, and (2) a 4 second delivery of tasteless solution, followed by a 6–13 second rest. Subjects also took part in a behavioral session in which their ability to inhibit response to an inappropriate stimulus was assessed via a simple go/no-go task. In this task, “X”s and “K”s are displayed in rapid sequence on a screen. Subjects are asked to press a keyboard button as quickly and accurately as possible when they see an “X” but to withhold response when they see a “K”. False alarm rate was calculated by dividing the number of button presses to “K” (failures to inhibit an inappropriate response) by the total number of “K” appearances and multiplying by 100 to obtain a percentage.
Data were analyzed using similar procedures as in study 1 but with SPM8. One design matrix was created per subject that included all three scanning days (6 runs in total). Events of interest included the milkshake (4 seconds) and tasteless (4 seconds) events. The rinse was again modeled as an event of no interest. To assess the association between response to milkshake vs. tasteless and performance on the go/no-go task at the group level a one sample t-test was performed in which the contrast milkshake vs. tasteless was regressed against false alarm rate and accuracy. Thresholding procedures and determination of significance were as described for study 1.
3. Results
3.1 Study 1
3.1.1 Demographics
Table 1 depicts the demographic characteristics of subjects from study1. As designed, the HW and OW groups differed significantly in BMI [t(23) 5.93, p < 0.0001]. Unpaired Student's t-tests showed no effect of BMI group on age [t(23) 1.24, p=0.23] or education level [t(23) 1.04, p=0.31].
3.1.2 Questionnaires
Impulsivity and willingness to work for food were assessed through the BIS-11 and the BCQ, respectively. The means and standard error of the mean (SEM) of these questionnaires for each BMI group are shown in Table 2. Unpaired Student's t-tests found that the OW group had a significantly higher total BIS-11 (BIS-tot) score than did the HW group [t(23) 2.23, p=0.036]. Additionally, the OW group had a significantly higher score on the BIS subscale 3 (non-planning impulsiveness) [t(23) 2.43, p=0.024; BIS-3]. There were no differences between BMI groups for scores on the BIS subscales 1 (attentional impulsiveness) [t(23) 1.42, p=0.17; BIS-1] or 2 (motor impulsiveness) [t(23) 1.39, p=0.18; BIS-2]. BCQ switch point was not different between BMI groups [t(23) 1.57, p=0.13].
Table 2.
Questionnaire Results for Study 1.
| Healthy weight | Overweight | p | |
|---|---|---|---|
| BIS-total | 54.3 ± 2.4 | 62.9 ± 2.9* | 0.04 |
| BIS-1 | 13.8 ± 0.8 | 15.5 ± 0.9 | 0.17 |
| BIS-2 | 20.0 ± 0.9 | 22.0 ± 1.1 | 0.18 |
| BIS-3 | 20.6 ± 1.3 | 25.4 ± 1.5* | 0.02 |
| BCQ Switch Point | 3.8 ± 0.9 | 6.2 ± 1.2 | 0.13 |
| TFEQ | |||
| Restraint | 4.8 ± 1.1 | 10.8 ± 1.5* | 0.003 |
| Disinhibition | 4.5 ± 0.7 | 9.3 ± 1.0* | 0.001 |
| Hunger | 5.8 ± 1.2 | 7.5 ± 1.1 | 0.3 |
| BES | 5.8 ± 1.6 | 15.5 ± 1.8* | <0.001 |
| DEBQ | |||
| External Eating | 1.6 ± 0.1 | 2.8 ± 0.2* | 0.42 |
| Restraint | 1.9 ± 0.2 | 3.1 ± 0.2* | <0.001 |
| Emotional Eating | 3.3 ± 0.1 | 3.4 ± 0.1 | <0.001 |
BIS-tot = Barratt Impulsivity Scale (BIS-11) total score; BIS-1 = BIS-11 subscale 1 score; BIS-2 = BIS-11 subscale 2 score; BIS-3 = BIS-11 subscale 3 score; BES = Binge Eating Scale; TFEQ = Three Factor Eating Questionnaire; DEBQ = Dutch Eating Behavior Questionnaire
significantly different from Healthy weight group.
Eating behavior was assessed with the DEBQ, TFEQ, and BES. Table 2 lists the means and SEM of these questionnaires for each BMI group. The OW group had significantly higher scores than the HW group on TFEQ subscales for disinhibition [9.3 vs. 4.5; t(23) 3.77, p=0.001] and restraint [10.8 vs. 4.8; t(23) 3.29, p=0.003], but was no different from the HW group for hunger [7.5 vs. 5.8, respectively; t(23) 1.06, p=0.30]. Additionally, the OW group had significantly higher scores than the HW group on the DEBQ subscales for emotional eating [2.8 vs. 1.6; t(23) 5.06, p < 0.001] and restrained eating [3.1 vs. 1.9; t(23) 4.03, p=0.001], but did not differ from the HW group for external eating [3.4 vs. 3.3; t(23) 0.83, p=0.42]. The OW group also had significantly higher scores than the HW group on the BES [15.5 vs 5.8, respectively; t(23) 4.0, p=0.001].
3.1.3 Correlations between questionnaires
To identify associations between the factors measured in the questionnaires we performed a series of correlation analyses (Table 3). A positive correlation was identified between total BIS-11 total score and the following other factors: 1) BES score (r=0.478, p=0.015), 2) TFEQ Disinhibition (r=0.463, p=0.019), and 3) DEBQ emotional eating (r=0.533, p=0.006). Similar correlations were observed with the BIS-11 subscales and these factors (Table 3). In addition to the questionnaires described here, BMI was also positively correlated with total BIS-11 score (r=0.454, p=0.022) and BIS subscale 3 (r=0.523, p=0.007). There was no BIS-11 correlation with BCQ switch point.
Table 3.
BIS-11 Correlations with BES, TFEQ, and DEBQ.
| BIS-tot | BIS-1 | BIS-2 | BIS-3 | |
|---|---|---|---|---|
| BES | 0.015 | ns | 0.041 | 0.026 |
| TFEQ | ||||
| Restraint | ns | ns | ns | ns |
| Disinhibition | 0.019 | ns | ns | 0.01 |
| Hunger | ns | ns | ns | ns |
| DEBQ | ||||
| External Eating | ns | ns | ns | ns |
| Restraint | ns | ns | ns | ns |
| Emotional Eating | 0.006 | ns | ns | 0.003 |
BIS-tot = Barratt Impulsivity Scale (BIS-11) total score; BIS-1 = BIS-11 subscale 1 score; BIS-2 = BIS-11 subscale 2 score; BIS-3 = BIS-11 subscale 3 score; BES = Binge Eating Scale; TFEQ = Three Factor Eating Questionnaire; DEBQ = Dutch Eating Behavior Questionnaire
3.1.4 Perceptual Ratings
No differences were found between the groups in hunger ratings. We did not expect consumption to have an effect on hunger over the course of scanning since subjects consumed only 25 ml of milkshake. A repeated measures ANOVA of the hunger ratings with time (before vs. after scanning) as the repeated measure and group (HW vs. OW) as the between group variable showed no effect of group [F(1,23) 0.26, p=0.93], no effect of time [F(1,23) 1.05, p=0.32], and no interaction [F(1,23) 0.75, p=0.40].
Subjective ratings of pleasantness were collected before and after scans for all odors and for milkshake. 2-way repeated measures ANOVAs with time as the repeated measure were conducted on these ratings separately for taste and smell. Analyses found no effect of group [F(1,23) 1.76, p=0.20], no effect of time [F(1,23) 0.29, p=0.60], and no interaction [F(1,23) 2.15, p=0.16] for subject ratings of milkshake pleasantness. Similar results were found for subject ratings of pleasantness for FO+ (either strawberry and cream or chocolate cookie depending upon which was assigned as the FO+), with no effect of group [F(1,23) 0.061, p=0.81], time [F(1,23) 0.002, p=0.96], and no interaction [F(1,23) 0.62, p=0.80]. Ratings of milkshake familiarity were not different with no effect of group [F(1,23) 0.68, p=0.42], time [F(1,23) 0.02, p=0.89], and no interaction [F(1,23) 1.80, p=0.19]; and for FO+ familiarity with no effect of group [F(1,23) 0.40, p=0.53, time [F(1,23) 0.21, p=0.65] and no interaction [F(1,23) 0.98, p=0.33]. Reported ratings of intensity did not differ for milkshake with no effect of group [F(1,23) 1.70, p=0.21], time [F(1,23) 1.77, p=0.20], and no interaction [F(1,23) 1.20, p=0.29]. Ratings of intensity of FO+ showed no effect of group [F(1,23) 1.79, p=0.19], and no interaction [F(1,23) 0.83, p=0.37], though intensity did decline over time [F(1,23) 6.80, p=0.02]. In summary, ratings of milkshake pleasantness, intensity, and familiarity did not differ between groups and were stable across scanning sessions. Ratings of intensity of the FO+ decreased over time but did not differ by group. Furthermore, no correlations were found among ratings of milkshake pleasantness, FO+ pleasantness, or BCQ switch point.
Finally, we note that many behaviors may arise from an interaction of sensitivity to negative outcome and sensitivity to reward. Here we make the assumption that our reward measures are independent from our impulsivity measures and vice versa. To test this assumption we performed correlations between all impulsivity measures and all reward measures. No significant correlations were found, supporting our assumption that our chosen instruments assess these two constructs independently.
3.1.5 fMRI Main Effects
The receipt of milkshake elicited whole brain corrected responses bilaterally in the insula (−42, −9, 15, k=161, z=4.78, p=0.001; 42, −9, 12, k=198, z=4.67, p=0.001), and bilaterally in the Rolandic operculum (62, 6, 15, k=168, z=4.87, p<0.001; −42, −9, 15, k=113, z=4.78, p<0.001) extending to the frontal operculum (60, 9, 24, k=127, z=5.04, p<0.001; −51, 6, 6, k=57, z=4.53, p<0.001). Additionally, ROI analyses revealed bilateral responses in the amygdala (27, 0, −12, k=6, z=3.78, p=0.007; −24, −3, −12, k=5, z=3.41, p=0.012) and thalamus (−12, 18, 9, k=43, z=4.25, p=0.004; 12, −21, 6, k=55, z=3.97, p=0.005).
The receipt of milkshake elicited greater response than did the tasteless solution bilaterally in the thalamus (12, −12, 0, p=0.002; −9, −18, 9, p=0.009). Analysis of ROIs revealed greater activation bilaterally in the Rolandic operculum (−60, 3, 9, p=0.001; 66, 6, 15, p=0.002), in the frontal operculum (−60, 3, 12, p=0.007; 54, 9, 6, p=0.039), and insula (42, −9, 15, p=0.002; −42, 6, 0, p=0.002).
Food odors (versus odorless air) produced significant activation in the left anterior cingulate cortex (−3, 6, −6, k=20, z=4.30, p=0.004), the right olfactory cortex (3, 9, −6, k=5, z=3.97, p=0.003), the left nucleus accumbens (−9, 6, −6, k=6, z=3.68, p=0.017), and the left pulvinar (−24, −30, 3, p=0.021), with trends for activation in the left olfactory cortex (−21, 6, −18, k=7, z=3.12, p=0.079) and left medial prefrontal cortex (−3, 51, −6, k=25, z=3.52p=0.096).
3.1.6 Between-Group Analyses
As predicted, the HW group had significantly greater activation to milkshake vs. tasteless than did the OW group in the caudate nucleus of the dorsal striatum (15, 18, 9, k=12, z=3.81, p=0.03) (Figure 2C). In contrast, OW showed greater responses to milkshake vs. tasteless than the HW in the ventral putamen (−27, −12, −6, k=11, z=3.97, p=0.024) (Figure 2C).
Figure 2.
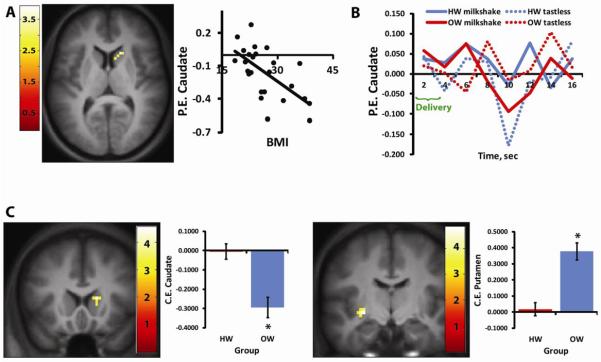
Effect of BMI on response to milkshake vs. tasteless in the striatum. (A) Axial section showing that BMI is negatively correlated with activation in the right caudate nucleus to milkshake vs. tasteless. For this and all future figures, the SPM is thresholded at p > 0.005; k = 5. The color bar represents t-values. The scatter plot shows average parameter estimates (PE) extracted from the peak voxel (y axis) plotted against BMI (x-axis). (B) Graph showing the time course of BOLD response to milkshake (solid lines) and tasteless (dotted lines) for each of the groups (red = OW and blue = HW) extracted from the peak voxel isolated in the contrast of milkshake vs. tasteless in HW vs. OW. (C) Coronal sections and bar graphs depicting the opposing effect of BMI on response in the caudate and putamen. The left brain image shows significantly greater response in HW vs. OW in the right caudate nucleus whereas the right brain images show significantly greater response in OW vs. HW in the left putamen. Bar graphs show the average contrast estimate (CE) extracted from peak voxel in HW vs. OW.
There were no differences in activations to food odors minus odorless air between the groups, although there was a trend for greater response in the dorsolateral prefrontal cortex (6, 48, 21) in the HW vs. OW group (k=22, z=3.70, p=0.076).
3.1.7 Correlation with BMI
As predicted, and consistent with prior work, BMI was negatively correlated with BOLD response to milkshake vs. tasteless in the caudate (15, 18, 9, k=5, z=3.39, p=0.044; Figure 2A). Also as previously observed we report a positive correlation with BMI in the Rolandic operculum (54, −15, 18, k=11, z=3.96, p=0.020) [2]. Slopes and r2 values of these correlations are displayed in Table 4. Despite the significant between-group effect in the ventral putamen, we did not observe a correlation here with BMI.
Table 4.
Slopes and r2 values of correlations.
| Region (Stimuli) | Correlation with: | r2 | slope |
|---|---|---|---|
| caudate (milkshake v. tasteless) | BMI | 0.400 | −0.023 |
| Rolandic operculum (milkshake v. tasteless) | BMI | 0.501 | 0.046 |
| left caudate (milkshake) | BIS-tot | 0.554 | −0.047 |
| right caudate (milkshake) | BIS-tot | 0.666 | −0.043 |
| left caudate (milkshake) | BIS-2 | 0.400 | −0.127 |
| right caudate (milkshake) | BIS-3 | 0.640 | −0.083 |
| caudate (milkshake v. tasteless) | go/no-go false alarm rate | 0.642 | −0.113 |
| caudate (milkshake v. tasteless) | go/no-go false accuracy rate | 0.679 | 0.116 |
BIS-tot = Barratt Impulsivity Scale (BIS-11) total score; BIS-2 = BIS-11 subscale 2 score; BIS-3 = BIS-11 subscale 3 score
3.1.8 Correlation with impulsivity and reward measures
Having replicated prior work showing decreased response to palatable food consumption in dorsal striatum in overweight individuals we next set out to determine if this response was associated with impulsivity, food reward, or eating style. All questionnaire scores and pleasantness ratings were regressed against whole brain response. The only associations observed in the dorsal striatum were with the impulsivity measure. More specifically, a negative correlation was observed between caudate activation (bilateral) to milkshake and BIS-11 total score in the OW, but not HW, group (−9, 9, 9, k=15, z=3.65, p=0.008; 12, 6, 12, k=17, z=3.63, p=0.008). Analyses of BIS-11 subscales indicate that caudate activation to milkshake was negatively correlated with BIS-2 (−9, 9, 9, k=23, z=3.85, p=0.012; 15, 0, 8, k=9, z=3.47, p=0.025) and with BIS-3 (12, 3, 12, k=9, z=3.47, p=0.044) but not BIS-1. These data are presented in Figure 3. Since BIS was associated with BES, DEBQ emotional eating, and TFEQ disinhibition we also assessed whether these factors were associated with striatal response. No associations were observed.
Figure 3.

Axial sections depicting the correlation of BIS-11 total and subscale scores with caudate activation to milkshake in the overweight group. (A) BIS-11 total score (bilateral), (B) motor impulsivity (BIS-2), and (C) non-planning impulsivity (BIS-3). All correlations are p<0.05, FDR-corrected. Color bars represent t-values. Scatterplots show parameter estimates (P.E. – y-axis) plotted against BIS-11 score (x-axis).
3.2 Study 2
The results of the go/no-go task were regressed against whole brain activation to milkshake vs. tasteless (Figure 4). Consistent with findings from study 1, a negative correlation was observed between the percentage of false alarms (25.2% ± 2.6%) and activation in the caudate (15, −7, 22, k=11, z=3.44, p=0.036). In other words, the weaker the activation is, the greater number of failures to inhibit incorrect (“no-go”) responses. Accordingly, there was also a positive correlation between the percentage of accurate responses (73.1% ± 2.6%) and caudate response (15, −10, 22, k=13, z=3.62, p=0.021). Note that these effects are in a more posterior and ventral region of caudate body than the peaks isolated in study 1.
Figure 4.
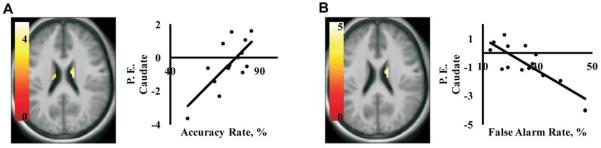
Axial sections depicting correlations between caudate activation to milkshake vs. tasteless and performance on the Go/No-Go Task in study 2. Scatter plots show that activation (P.E. = parameter estimates on the y - axis) in the caudate is positively correlated with accuracy rate (A), and negatively correlated with false alarm rate (B) on the x-axis. Both effects are significant at p<0.05, FDR-corrected. Color bars represent t-values.
4. Discussion
Previous investigations consistently report a negative association between BMI and response in the caudate nucleus during the consumption of palatable and energy dense food [2–4]. Here we sought to replicate this finding and determine if the reduced response is associated with measures of impulsivity or food reward.
Replicating prior work we report that caudate response to milkshake vs. tasteless is negatively correlated with BMI (Figure 2). Also consistent with prior reports, we observed a positive association between response and BMI in the Rolandic operculum [34]. Enhanced response was also observed in the ventral putamen in the OW group (Figure 2C). The pattern of findings in the striatum (decreased caudate coupled with increased putamen) is of particular interest because stronger responses in the caudate nucleus are observed during goal directed behavior [40], whereas responses in the putamen have been linked to habitual responding [41]. Thus the observed pattern is consistent with a shift from goal-directed to habitual circuit response during consumption of milkshake in OW compared to HW individuals.
In contrast to the milkshake receipt, we did not observe an effect of BMI on response to the food odors. The lack of associations was surprising given the many reports of altered brain response to food cues [42, 43]. Analysis of perceptual responses clearly indicates that subjects were able to perceive the odors. Moreover, the main effects analyses indicated that odors activated the expected olfactory regions. However, it is possible that the sample size was not large enough to isolate between-group effects. Consistent with this possibility we did observe several activations that were just below the threshold of significance. Future work employing more sensitive paradigms, such as block designs and greater sample sizes will be important to conduct before definitive conclusions can be drawn about brain response to food aromas and body weight.
Having replicated the inverse association between BMI and brain response to milkshake in the caudate we next set out to determine if response in this region was associated with measures of food reward or impulsivity. Regression analyses were performed using the caudate nucleus as a mask to identify associations between these measures and brain response to milkshake and brain response to milkshake vs. tasteless. No associations were observed with the reward measures. This was true for regressions performed with the whole group, as well as for regressions performed separately for the HW and OW groups. In contrast, a significant negative association was observed between impulsivity, as assessed by the BIS-11, and caudate response to milkshake in the OW, but not the HW group; the lower the caudate response, the greater was self-reported impulsivity (Figure 3). In a second study we then verified this association by demonstrating an inverse relationship between response in a slightly more posterior region of caudate nucleus to milkshake vs. tasteless and a behavioral measure of impulsivity (Figure 4). More specifically, the greater the inability to inhibit responses associated with a negative outcome, the weaker the observed response in the caudate. We conclude that caudate response during the consumption of palatable food is associated with insensitivity to negative outcome and impulsivity but not food reward. This association offers new insight into mechanisms behind overeating because impulsivity is a well-known risk factor for obesity [44, 45], influencing weight gain in both children [46] and women [47]. Another consideration is that although impulsivity is often conceived of as a trait with known heritability [48, 49] that confers risk for developing compulsive habits [50], it has also been recently established that impulsivity may change as a consequence of drug exposure in rodents [51].
This is a critical point because several lines of evidence suggest that the decreased caudate response to milkshake represents an adaptation to adiposity or overeating rather than an initial vulnerability. First, reduced caudate response is associated with weight-gain [1] but not risk for weight-gain [52]. Second, animal work has demonstrated that rats fed a high fat diet gain weight and display reduced dopamine receptors in the dorsal striatum compared to rats fed normal chow [27]. Moreover, whereas control rats avoid lever pressing for food in the presence of a light cue that indicates impending foot shock, rats fed the high fat diet continue to respond for food. In other words, a high fat diet was shown to lead to alterations in striatal dopamine receptor density and a lack of sensitivity for negative outcomes. Our results are suggestive of the possibility that the decreased caudate response observed in overweight/obese humans may also be associated with lack of sensitivity for negative outcomes. If so, response to milkshake in the dorsal striatum may be related to weight gain by promoting impulsive eating behavior. Consistent with this possibility, we found a relationship between BIS score (total and subscale 3) and DEBQ emotional eating [53] and TFEQ disinhibition [54]. Interestingly, neither emotional eating, nor disinhibition was associated with caudate response. This suggests that enhanced impulsivity may influence eating behaviors and thereby promote weight gain.
Highlights
There is an inverse association between BMI and caudate response to milkshake.
BMI has the opposite effect on response to milkshake in the caudate and putamen.
Caudate response to milkshake is associated with impulsivity and not food reward.
Altered striatal responses to food in obesity reflect greater impulsivity.
Acknowledgements
Support provided by R01 DK085579 and a private donation from Dr. David Kessler to the John B Pierce Laboratory. This article is based on a presentation during the 2012 Annual Meeting of the Society for the Study of Ingestive Behavior, Zurich, Switzerland, July 10–14, 2012, made possible in part by a generous donation from Research Diets, Inc., Sanofi, Inc., and TSE, Inc.
Footnotes
Publisher's Disclaimer: This is a PDF file of an unedited manuscript that has been accepted for publication. As a service to our customers we are providing this early version of the manuscript. The manuscript will undergo copyediting, typesetting, and review of the resulting proof before it is published in its final citable form. Please note that during the production process errors may be discovered which could affect the content, and all legal disclaimers that apply to the journal pertain.
5. References
- 1.Stice E, et al. Reward circuitry responsivity to food predicts future increases in body mass: Moderating effects of DRD2 and DRD4. NeuroImage. 2010;50(4):1618–1625. doi: 10.1016/j.neuroimage.2010.01.081. [DOI] [PMC free article] [PubMed] [Google Scholar]
- 2.Stice E, et al. Relation of Reward From Food Intake and Anticipated Food Intake to Obesity: A Functional Magnetic Resonance Imaging Study. Journal of Abnormal Psychology. 2008;117(4):924–935. doi: 10.1037/a0013600. [DOI] [PMC free article] [PubMed] [Google Scholar]
- 3.Stice E, et al. Relation between obesity and blunted striatal response to food is moderated by TaqIA A1 allele. Science. 2008;322(5900):449–452. doi: 10.1126/science.1161550. [DOI] [PMC free article] [PubMed] [Google Scholar]
- 4.Green E, et al. Reduced nucleus accumbens and caudate nucleus activation to a pleasant taste is associated with obesity in older adults. Brain Research. 2011;1386:109–117. doi: 10.1016/j.brainres.2011.02.071. [DOI] [PMC free article] [PubMed] [Google Scholar]
- 5.Frank GKW, et al. Anorexia nervosa and obesity are associated with opposite brain reward response. Neuropsychopharmacology. 2012;37(9):2031–2046. doi: 10.1038/npp.2012.51. [DOI] [PMC free article] [PubMed] [Google Scholar]
- 6.Jönsson EG, et al. Polymorphisms in the dopamine D2 receptor gene and their relationships to striatal dopamine receptor density of healthy volunteers. Molecular Psychiatry. 1999;4(3):290–296. doi: 10.1038/sj.mp.4000532. [DOI] [PubMed] [Google Scholar]
- 7.Pohjalainen T, et al. The A1 allele of the human D 2 dopamine receptor gene predicts low D 2 receptor availability in healthy volunteers. Molecular Psychiatry. 1998;3(3):256–260. doi: 10.1038/sj.mp.4000350. [DOI] [PubMed] [Google Scholar]
- 8.Noble EP, et al. Allelic association of the D2 dopamine receptor gene with receptor-binding characteristics in alcoholism. Archives of General Psychiatry. 1991;48(7):648–654. doi: 10.1001/archpsyc.1991.01810310066012. [DOI] [PubMed] [Google Scholar]
- 9.Wang GJ, et al. Brain dopamine and obesity. Lancet. 2001;357(9253):354–7. doi: 10.1016/s0140-6736(00)03643-6. [DOI] [PubMed] [Google Scholar]
- 10.Chen TJH, et al. Reviewing the role of putative candidate genes in “Neurobesigenics,” a clinical subtype of Reward Deficiency Syndrome (RDS) Gene Therapy and Molecular Biology. 2007;11(1):61–74. [Google Scholar]
- 11.Johnson PM, Kenny PJ. Dopamine D2 receptors in addiction-like reward dysfunction and compulsive eating in obese rats. Nat Neurosci. 2010;13(5):635–41. doi: 10.1038/nn.2519. [DOI] [PMC free article] [PubMed] [Google Scholar]
- 12.Balleine BW, O'Doherty JP. Human and rodent homologies in action control: corticostriatal determinants of goal-directed and habitual action. Neuropsychopharmacology. 2010;35(1):48–69. doi: 10.1038/npp.2009.131. [DOI] [PMC free article] [PubMed] [Google Scholar]
- 13.Everitt BJ, et al. Review. Neural mechanisms underlying the vulnerability to develop compulsive drug-seeking habits and addiction. Philos Trans R Soc Lond B Biol Sci. 2008;363(1507):3125–35. doi: 10.1098/rstb.2008.0089. [DOI] [PMC free article] [PubMed] [Google Scholar]
- 14.Everitt BJ, Robbins TW. Neural systems of reinforcement for drug addiction: from actions to habits to compulsion. Nat Neurosci. 2005;8(11):1481–9. doi: 10.1038/nn1579. [DOI] [PubMed] [Google Scholar]
- 15.Small DM, et al. Changes in brain activity related to eating chocolate: from pleasure to aversion. Brain. 2001;124(Pt 9):1720–33. doi: 10.1093/brain/124.9.1720. [DOI] [PubMed] [Google Scholar]
- 16.Davis C, Fox J. Sensitivity to reward and body mass index (BMI): Evidence for a non-linear relationship. Appetite. 2008;50(1):43–49. doi: 10.1016/j.appet.2007.05.007. [DOI] [PubMed] [Google Scholar]
- 17.Davis C, et al. Reward sensitivity and the D2 dopamine receptor gene: A case-control study of binge eating disorder. Progress in Neuro-Psychopharmacology and Biological Psychiatry. 2008;32(3):620–628. doi: 10.1016/j.pnpbp.2007.09.024. [DOI] [PubMed] [Google Scholar]
- 18.Davis C, Strachan S, Berkson M. Sensitivity to reward: implications for overeating and overweight. Appetite. 2004;42(2):131–8. doi: 10.1016/j.appet.2003.07.004. [DOI] [PubMed] [Google Scholar]
- 19.Goldfield GS, et al. Validation of a questionnaire measure of the relative reinforcing value of food. Eating Behaviors. 2005;6(3):283–292. doi: 10.1016/j.eatbeh.2004.11.004. [DOI] [PubMed] [Google Scholar]
- 20.Patton JH, Stanford MS, Barratt ES. Factor structure of the Barratt Impulsiveness Scale. Journal of Clinical Psychology. 1995;51(6):768–774. doi: 10.1002/1097-4679(199511)51:6<768::aid-jclp2270510607>3.0.co;2-1. [DOI] [PubMed] [Google Scholar]
- 21.Gormally J, et al. The assessment of binge eating severity among obese persons. Addictive Behaviors. 1982;7(1):47–55. doi: 10.1016/0306-4603(82)90024-7. [DOI] [PubMed] [Google Scholar]
- 22.O'Doherty J, et al. Representation of pleasant and aversive taste in the human brain. Journal of Neurophysiology. 2001;85(3):1315–1321. doi: 10.1152/jn.2001.85.3.1315. [DOI] [PubMed] [Google Scholar]
- 23.Frey S, Petrides M. Re-examination of the human taste region: A positron emission tomography study. European Journal of Neuroscience. 1999;11(8):2985–2988. doi: 10.1046/j.1460-9568.1999.00738.x. [DOI] [PubMed] [Google Scholar]
- 24.Zald DH, Pardo JV. Cortical activation induced by intraoral stimulation with water in humans. Chemical Senses. 2000;25(3):267–275. doi: 10.1093/chemse/25.3.267. [DOI] [PubMed] [Google Scholar]
- 25.Bartoshuk LM, McBurney DH, Pfaffmann C. Taste of sodium chloride solutions after adaptation to sodium chloride: Implications for the “water taste. Science. 1964;143(3609):967–968. doi: 10.1126/science.143.3609.967. [DOI] [PubMed] [Google Scholar]
- 26.Veldhuizen MG, et al. Trying to detect taste in a tasteless solution: Modulation of early gustatory cortex by attention to taste. Chemical Senses. 2007;32(6):569–581. doi: 10.1093/chemse/bjm025. [DOI] [PubMed] [Google Scholar]
- 27.Johnson BN, Sobel N. Methods for building an olfactometer with known concentration outcomes. Journal of Neuroscience Methods. 2007;160(2):231–245. doi: 10.1016/j.jneumeth.2006.09.008. [DOI] [PubMed] [Google Scholar]
- 28.Small DM, et al. Separable Substrates for Anticipatory and Consummatory Food Chemosensation. Neuron. 2008;57(5):786–797. doi: 10.1016/j.neuron.2008.01.021. [DOI] [PMC free article] [PubMed] [Google Scholar]
- 29.Cloninger CR, Przybeck TR, Svrakic DM. The Tridimensional Personality Questionnaire: U.S. normative data. Psychological Reports. 1991;69(3 Pt 1):1047–1057. doi: 10.2466/pr0.1991.69.3.1047. [DOI] [PubMed] [Google Scholar]
- 30.Van Strien T, et al. The Dutch eating behavior questionnaire (DEBQ) for assessment of restrained, emotional, and external eating behavior. International Journal of Eating Disorders. 1986;5(2):295–315. doi: 10.1002/eat.20424. [DOI] [PubMed] [Google Scholar]
- 31.Stunkard AJ, Messick S. The three-factor eating questionnaire to measure dietary restraint, disinhibition and hunger. J Psychosom Res. 1985;29(1):71–83. doi: 10.1016/0022-3999(85)90010-8. [DOI] [PubMed] [Google Scholar]
- 32.Epstein LH, et al. Food hedonics and reinforcement as determinants of laboratory food intake in smokers. Physiology and Behavior. 2004;81(3):511–517. doi: 10.1016/j.physbeh.2004.02.015. [DOI] [PubMed] [Google Scholar]
- 33.Green BG, et al. Evaluating the `labeled magnitude scale' for measuring sensations of taste and smell. Chemical Senses. 1996;21(3):323–334. doi: 10.1093/chemse/21.3.323. [DOI] [PubMed] [Google Scholar]
- 34.Macey PM, et al. A method for removal of global effects from fMRI time series. NeuroImage. 2004;22(1):360–366. doi: 10.1016/j.neuroimage.2003.12.042. [DOI] [PubMed] [Google Scholar]
- 35.Maldjian JA, et al. An automated method for neuroanatomic and cytoarchitectonic atlas-based interrogation of fMRI data sets. NeuroImage. 2003;19(3):1233–1239. doi: 10.1016/s1053-8119(03)00169-1. [DOI] [PubMed] [Google Scholar]
- 36.Beaver JD, et al. Individual differences in reward drive predict neural responses to images of food. Journal of Neuroscience. 2006;26(19):5160–5166. doi: 10.1523/JNEUROSCI.0350-06.2006. [DOI] [PMC free article] [PubMed] [Google Scholar]
- 37.Small DM, et al. Changes in brain activity related to eating chocolate: From pleasure to aversion. Brain. 2001;124(9):1720–1733. doi: 10.1093/brain/124.9.1720. [DOI] [PubMed] [Google Scholar]
- 38.DelParigi A, et al. Neuroimagenomics for the study of human obesity. Immunology, Endocrine and Metabolic Agents in Medicinal Chemistry. 2006;6(1):75–80. [Google Scholar]
- 39.Hare TA, Camerer CF, Rangel A. Self-control in decision-Making involves modulation of the vmPFC valuation system. Science. 2009;324(5927):646–648. doi: 10.1126/science.1168450. [DOI] [PubMed] [Google Scholar]
- 40.Valentin VV, Dickinson A, O'Doherty JP. Determining the neural substrates of goal-directed learning in the human brain. Journal of Neuroscience. 2007;27(15):4019–4026. doi: 10.1523/JNEUROSCI.0564-07.2007. [DOI] [PMC free article] [PubMed] [Google Scholar]
- 41.Tricomi E, Balleine BW, O'Doherty JP. A specific role for posterior dorsolateral striatum in human habit learning. European Journal of Neuroscience. 2009;29(11):2225–2232. doi: 10.1111/j.1460-9568.2009.06796.x. [DOI] [PMC free article] [PubMed] [Google Scholar]
- 42.Grosshans M, et al. Association of leptin with food cue-induced activation in human reward pathways. Archives of General Psychiatry. 2012;69(5):529–537. doi: 10.1001/archgenpsychiatry.2011.1586. [DOI] [PubMed] [Google Scholar]
- 43.Yokum S, Ng J, Stice E. Attentional bias to food images associated with elevated weight and future weight gain: An fMRI study. Obesity. 2011;19(9):1775–1783. doi: 10.1038/oby.2011.168. [DOI] [PMC free article] [PubMed] [Google Scholar]
- 44.Dawe S, Loxton NJ. The role of impulsivity in the development of substance use and eating disorders. Neurosci Biobehav Rev. 2004;28(3):343–51. doi: 10.1016/j.neubiorev.2004.03.007. [DOI] [PubMed] [Google Scholar]
- 45.Francis LA, Susman EJ. Self-regulation and rapid weight gain in children from age 3 to 12 years. Arch Pediatr Adolesc Med. 2009;163(4):297–302. doi: 10.1001/archpediatrics.2008.579. [DOI] [PMC free article] [PubMed] [Google Scholar]
- 46.Nederkoorn C, et al. Impulsivity predicts treatment outcome in obese children. Behav Res Ther. 2007;45:1071–1075. doi: 10.1016/j.brat.2006.05.009. [DOI] [PubMed] [Google Scholar]
- 47.Nederkoorn C, et al. Impulsivity in obese women. Appetite. 2006;47:253–256. doi: 10.1016/j.appet.2006.05.008. [DOI] [PubMed] [Google Scholar]
- 48.Congdon E, Canli T. The endophenotype of impulsivity: reaching consilience through behavioral, genetic, and neuroimaging approaches. Behav Cogn Neurosci Rev. 2005;4(4):262–81. doi: 10.1177/1534582305285980. [DOI] [PubMed] [Google Scholar]
- 49.Siever LJ, et al. The borderline diagnosis III: identifying endophenotypes for genetic studies. Biol Psychiatry. 2002;51(12):964–8. doi: 10.1016/s0006-3223(02)01326-4. [DOI] [PubMed] [Google Scholar]
- 50.Dalley JW, et al. Nucleus accumbens D2/3 receptors predict trait impulsivity and cocaine reinforcement. Science. 2007;315(5816):1267–70. doi: 10.1126/science.1137073. [DOI] [PMC free article] [PubMed] [Google Scholar]
- 51.Jentsch JD, Taylor JR. Impulsivity resulting from frontostriatal dysfunction in drug abuse: implications for the control of behavior by reward-related stimuli. Psychopharmacology. 1999;146:373–390. doi: 10.1007/pl00005483. [DOI] [PubMed] [Google Scholar]
- 52.Yeomans MR, Leitch M, Mobini S. Impulsivity is associated with the disinhibition but not restraint factor from the Three Factor Eating Questionnaire. Appetite. 2008;50(2–3):469–476. doi: 10.1016/j.appet.2007.10.002. [DOI] [PubMed] [Google Scholar]
- 53.Guerrieri R, Nederkoorn C, Jansen A. How impulsiveness and variety influence food intake in a sample of healthy women. Appetite. 2007;48(1):119–122. doi: 10.1016/j.appet.2006.06.004. [DOI] [PubMed] [Google Scholar]
- 54.Jasinska AJ, et al. Impulsivity and inhibitory control deficits are associated with unhealthy eating in young adults. Appetite. 2012;59(3):738–747. doi: 10.1016/j.appet.2012.08.001. [DOI] [PMC free article] [PubMed] [Google Scholar]