Abstract
We have created a novel high-throughput imaging system for the analysis of behavior in 7-day-old zebrafish larvae in multi-lane plates. This system measures spontaneous behaviors and the response to an aversive stimulus, which is shown to the larvae via a PowerPoint presentation. The recorded images are analyzed with an ImageJ macro, which automatically splits the color channels, subtracts the background, and applies a threshold to identify individual larvae placement in the lanes. We can then import the coordinates into an Excel sheet to quantify swim speed, preference for edge or side of the lane, resting behavior, thigmotaxis, distance between larvae, and avoidance behavior. Subtle changes in behavior are easily detected using our system, making it useful for behavioral analyses after exposure to environmental toxicants or pharmaceuticals.
Keywords: Behavior, Issue 77, Neuroscience, Neurobiology, Developmental Biology, Cellular Biology, Molecular Biology, Biochemistry, Physiology, Anatomy, Toxicology, Behavioral Sciences, Zebrafish larvae, high-throughput assay, thigmotaxis, avoidance, behavior, automated analysis, Zebrafish, Danio rerio, animal model
Introduction
Zebrafish are becoming a popular model for genetic, developmental and behavioral sciences 1-4. They hatch from their chorions by 2-3 days post fertilization (dpf), develop fully functioning organs by 4-5 dpf, and exhibit a large number of behaviors by 7 dpf 5,6. Zebrafish larvae are ideally suited for high-throughput analyses because of their small size 7,8. Software is commercially available for automated analyses of behavior in larval and adult zebrafish 9-14. However, this software can be expensive and has limited options for measuring complex behaviors of zebrafish larvae in multi-well plates.
We created a novel high-throughput imaging system that is inexpensive to set up and can quantify a number of different behaviors in 7 dpf zebrafish larvae 15,16. The system allows us to quickly and efficiently test subtle behavioral abnormalities after embryonic exposure to a number of pharmaceuticals and environmental toxicants 16-18.
The system was built using wooden cabinets, which house a digital camera at the top of the cabinet. The camera faces downward to the bottom of the cabinet where a laptop is placed with the screen facing up 15. Time lapse imaging is used to capture the placement of the larvae in the lanes. Larvae can be housed in up to four multi-well or multi-lane plates which are positioned on top of the laptop screen. We use a PowerPoint presentation as an aversive stimulus to which the larvae respond by moving away (avoidance) and swimming towards the edge (thigmotaxis) 15,17. The images are imported into ImageJ in which an automated macro is used to split the color channels, subtract the background, and apply a threshold to identify individual larvae. Coordinates are listed for each larva in each image and can be inserted into an Excel file which we use to quantify avoidance and thigmotaxis behavior, fish to fish distance, swim speed, and amount of rest 16.
Protocol
1. Collection of Zebrafish Embryos and Raising Larvae
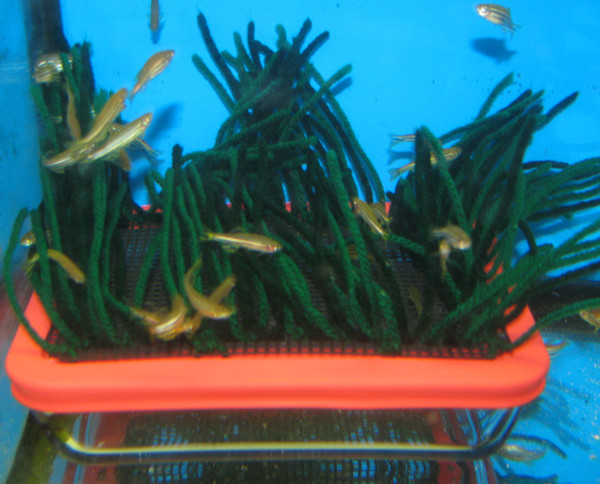
Glass Pyrex dishes with "fake" grass (made from green yarn) (Figure 1) should be inserted into the tanks at dawn and left in for two hours in order to collect zebrafish embryos. The glass dishes containing the embryos should be poured over a handheld strainer and rinsed with deionized water. The embryos should then be grown in egg water. The egg water contains 60 mg/L of Instant Ocean in deionized water and 0.25 mg/L of methylene blue, which is used as a mold inhibitor.
Depending upon the hypothesis of the individual experiment, embryos can be treated immediately or during specific stages of development using toxicants or pharmaceuticals. The toxicants and pharmaceuticals are usually dissolved in DMSO (at a 1,000X concentration) and should be further diluted directly in the egg water medium.
During embryonic and larval treatment with pharmaceuticals or toxicants, the larvae and embryos can be housed in deep Petri dishes at a density of about 50-60 larvae per 50 ml until the behavioral analyses at 7 dpf ( egg water solution should be changed at least every other day to avoid fungal/bacterial growth from dead embryos).
2. Preparing Molds for Behavioral Analyses
Specially developed plastic molds which measure 11.7 cm x 7.6 cm x 5 mm were custom-built in-house. The molds are needed to create lanes using agarose which is poured into single well plastic plates from Thermo Scientific. The single well plates measure 12.4 cm x 8.1 cm x 1.2 cm.
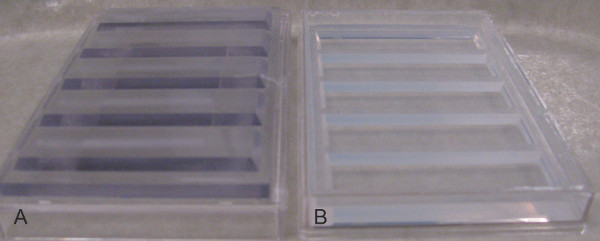
The molds contain five lanes in which the sides are angled at 60°. The lanes in the molds are 3.5 mm high with a base of 18 mm at the top which is the widest whereas the bottom width is 14 mm. There is a 4 mm gap between lanes in the mold (Figure 2).
To prepare the lanes pour 50 ml of melted agarose (0.8% agarose in deionized water with 60 mg/L Instant Ocean) in a single well plate. The mold should then be placed very slowly on top of the liquid agarose to eliminate any bubble formation and can be removed when the agarose has cooled (which takes roughly 45 min).
The agarose lanes should be made no earlier than one day before the behavioral experiment is to be run (to avoid the agarose drying out) The lanes can be stored at room temperature with the lids on the dishes for up to roughly 36 hr. The agarose lanes should only be used for one experiment and should then be discarded.
3. Image Capture
Up to 20 larvae can be placed in each lane of the plates. Typically 5 larvae per lane are used to facilitate the most accurate tracking of swim speed and to reduce the number of larvae that are needed per experiment. The lanes can be filled with egg water with or without pharmaceuticals or toxicants depending upon the experiment. However, lanes should not be filled up all the way until they are placed in the imaging cabinets; this will prevent overflow. For consistency, the larvae should have an acclimatization period of ten minutes after they are placed in the agarose molds and positioned on top of the laptop screen. Efficiently moving the larvae from the Petri dish to the agarose lane will help to reduce larvae stress. This is easiest when the larvae are housed in shallow tanks or Petri dishes.
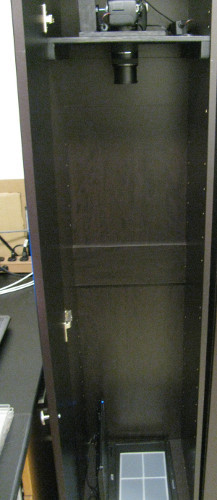
The imaging cabinets include a Canon digital camera used for time-lapse photography and a laptop. The camera should be placed at the top of the cabinet and aimed towards to the bottom of the cabinet where a 15.6 inch screen laptop should be placed with screen facing up (Figure 3). Four plates should be positioned by hand directly on top of the laptop screen. At this time the lanes can be topped off with egg water or chemical treatment so that it is level with the top of the lane (to eliminate shadows on the edges of the lanes in the images).
A PowerPoint presentation is used as an aversive stimulus for the larvae. In the past moving red balls were shown to zebrafish larvae in 6 or 12 multi-well plates 15,17,18. The current PowerPoint starts with a blank white background for 15 min, followed by 15 min of a moving red bar on the top half of the plate (Figure 4). In order to eliminate overheating the larvae, it is best to purchase a laptop with a screen temperature that does not go above 28 °C. To avoid evaporation of the liquid within the agarose lanes, the maximal imaging time should be kept to below one hour.
The digital camera should be programmed for time-lapse photography, taking pictures every 6 sec for a total of 300 images per experiment. However, the frequency and length can be adjusted depending on the experiment and behavioral quantification. In the past extended imaging times were employed using longer intervals between each image. The camera can be set at a lower resolution for imaging at video speed (30 frames per second). While the lower resolution limits the recordings to a single multiwell plate, the video recordings are appropriate for imaging rapid swimming events 15.
4. Image Analysis
The images should be opened with ImageJ and used with a macro that was specifically written in-house. The macro automatically splits the color channels so that the red color can be removed, subtracts the background, applies a threshold, and identifies the larvae by particle analysis. The most current macro for five lane larval analysis is Zebrafish_macro25k. Use the prompts in the macro to set number of images, color to be subtracted, image threshold, etc.
After all of the images are run through the ImageJ macro, a results file will be displayed and will contain x,y coordinates of the individual larvae for each image along with the image number and the lane number.
The results file should be saved in an Excel format and sorted based upon blank background vs. moving bar background and then the well number. An Excel template should be used that has equations built in that automatically determines placement of larvae in the wells, distance between larvae, speed of movement, and amount of rest. The most current Excel template is 25ib created in the Creton lab, which is available upon request. Graphs showing various treatment groups should be built into the Excel sheet along with t-tests for comparison between treatment groups and controls. Further statistical analysis can be performed using SPSS.
Representative Results
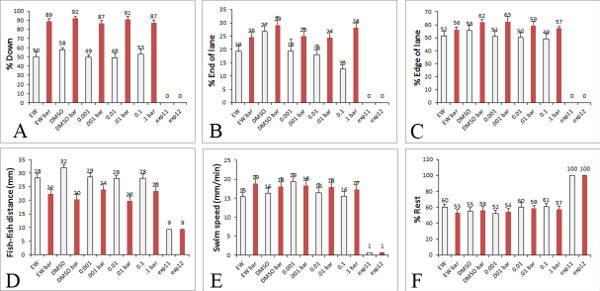
In our earlier assays, using the bouncing ball aversive stimulus, wild type larvae that are untreated respond to the moving ball by swimming down in the well (avoidance behavior) and towards the edges of the well (thigmotaxis behavior) 15. We later confirmed that thigmotaxis behavior in this assay is a measure of anxiety-related behavior in zebrafish larvae 17. There were significant differences in the larvae movement away from the ball and preference for the edge when compared to the blank white background. These behaviors have also been confirmed in our new assay using the moving red bar and are even more robust 16. Moreover, we can now sample a larger number of behaviors in a single assay including swim speed, rest, preference for the end or side of the well, and distance between fish (Figure 5). Control larvae grown in egg water show an increased preference to be down in the dish and on the edge of the lane after they are presented with an aversive stimulus (moving red bar). Similar results are obtained when larvae are grown in egg water containing 1 μg/ml DMSO, a solvent that is commonly used to dissolve various pharmaceuticals and toxicants as 1,000X stock solutions.
Representative results are shown in Figure 5 in larvae treated with egg water and DMSO (as controls) and varying concentrations of an organophosphate pesticide commonly found in non-organic foods. The results shown are a sampling from one experiment. However, when repeated, the results indicate that swim speed and thigmotaxis behavior is altered by low concentrations of organophosphate pesticides, which mimic levels in human food consumption 18.
 Figure 1. Collection Trays. Glass Pyrex dishes are used to collect embryos from the adult fish tanks. Lids from the Pyrex dishes were cut and inserted with plastic grids and green yarn was sewn onto the grids in the plastic. This creates a breeding atmosphere for the adult zebrafish by mimicking the natural environment.
 Figure 2. Plastic mold and agarose lanes. A) The mold is shown on the left. 0.8% agarose is poured into a one-well plate; the mold is slowly inserted and then removed when the agarose has cooled. B) The plate on the right shows the lanes created in agarose by the plastic mold.
 Figure 3. Imaging Cabinets. Imaging cabinets were specially built in our laboratory and used for high-throughput behavioral analyses. A 15 megapixel digital camera was attached to the top of the cabinet facing downwards in order to gather time lapse images of the larvae in multilane plates placed on top of the screen of a laptop. Between the plates and the screen there is a plastic diffuser that is used to prevent moiré patterns in the images collected.
 Figure 4. Blank background and PowerPoint aversive stimulus. This is the current PowerPoint that is used to evoke behavioral changes in zebrafish larvae. It provides robust behavioral differences between A) the blank background and B) the moving red bar.
 Figure 5. Behaviors Quantified in the high-throughput assay. Example of the behaviors that are quantified from our behavioral assay within the Excel sheet that we use for x,y coordinates of the larvae. The white bars show data from larvae exposed to a blank background and the red bars show data from the larvae exposed to the red moving bar in the PowerPoint. The graphs indicate the measurements that can be obtained from behavioral analysis A) Percentage of larvae down in the lane, B) Percentage of larvae on the end of the lane, C) Percentage of larvae on the edge of the lane, D) Distance between fish (mm), E) Swim speed of the larvae (mm/min), F) Percentage rest of the larvae. In the graphs shown, data is from treatment of larvae with DMSO control and several concentrations of a pesticide ranging from 0.001 to 0.1 μM (levels commonly found in the human diet). Click here to view larger figure.
Discussion
While we are continually improving our novel behavioral assay, it has always been useful for the detection of avoidance and thigmotaxis behavior in zebrafish larvae 15. Many trials have been performed to optimize the results of the assay, such as color of stimulus used, ideal number of larvae per lane, and length of behavioral assay. Previously, we used multi-well plates (with 6 or 12 wells) 15,17,18. However, recently we have created the novel lane mold to create a larger swimming space for the larvae allowing us to gather a larger number of behavioral measures in a single assay 16 (Figure 5). Other modifications include variations of the PowerPoint shown (altered movement or length of assay) and the size of the lanes used (we also have molds for more narrow lanes).
Currently, this high-throughput automated system is unique in its ability to measure a large range of behaviors in zebrafish larvae at the same time such as speed, avoidance, proximity to other larvae, and thigmotaxis in multi-lane plates. Results can be obtained quickly and a large number of larvae can be analyzed at the time of imaging. The system is both inexpensive to build and quick and easy to set up. A limitation of this system is that 3-D movements cannot be assessed in the zebrafish larvae. Automated systems that track adult zebrafish have the 3-D capability and can identify a wider range of behaviors such as movement up or down within the water column 10,19. Another limitation is that our imaging system is currently not optimized for high-throughput analyses at video speed. Video speed imaging is possible when setting the camera to a lower resolution 15, but this restricts the analysis to a single plate.
In using the newly created "lane" method, several parts of the assay needed to be executed in a precise manner. When placing the larvae in the lanes, it is critical to make sure the level of liquid is very shallow until the plates are positioned on top of the laptop screen. If the lanes are too full of liquid, the larvae will escape into the periphery of the plate. In addition, when inserting the mold into the agarose, care must be taken to lower the mold very slowly. If the mold is inserted too quickly, bubbles will form in the agarose and will be identified by the Image J macro as additional larvae. It is advised that if the agarose lanes have even a few bubbles, it is best to make new ones.
In the future, we would like to optimize our behavioral assay to analyze other complex behaviors such as learning in zebrafish larvae and examine how learning may be affected by exposure to toxicants and pharmaceuticals in early development. We are currently working on assays that may be useful for analyzing learning behavior in which the behavioral results may facilitate determining which brain areas are affected by certain toxicants or pharmaceuticals during development. Automated assays have been developed for measuring learning behaviors in zebrafish larvae 20 and these assays may be amendable for high-throughput screening by using the robust avoidance response in multi-lane plates.
We propose that this behavioral assay could be used in future studies for testing the developmental effects of a large number of pharmaceuticals and toxicants. Such studies would provide a wealth of information on specific risk factors and contribute to setting better health and safety guidelines for pregnant women and children.
Disclosures
The authors declare that they have no competing financial interests.
Acknowledgments
We thank Sean Pelkowski for assistance in optimization of the behavioral assay. This work was supported by the National Institute of Child Health and Human Development, R01 HD060647 and the National Institute of Environmental Health Sciences, F32 ES021342 and R03 ES017755.
References
- Gerlai R, Lahav M, Guo S, Rosenthal A. Drinks like a fish: zebra fish (Danio rerio) as a behavior genetic model to study alcohol effects. Pharmacol. Biochem. Behav. 2000;67:773–782. doi: 10.1016/s0091-3057(00)00422-6. [DOI] [PubMed] [Google Scholar]
- Selderslaghs IWT, Hooyberghs J, De Coen W, Witters HE. Locomotor activity in zebrafish embryos: A new method to assess developmental neurotoxicity. Neurotoxicol. Teratol. 2010;32:460–471. doi: 10.1016/j.ntt.2010.03.002. [DOI] [PubMed] [Google Scholar]
- Norton W, Bally-Cuif L. Adult zebrafish as a model organism for behavioural genetics. BMC Neuroscience. 2010;11:90. doi: 10.1186/1471-2202-11-90. [DOI] [PMC free article] [PubMed] [Google Scholar]
- Levin ED, Cerutti D. Ch. 15. In: Buccafusco JJ, editor. Methods of behavioral analysis in neuroscience. CRC Press; 2009. [Google Scholar]
- Kimmel C, Ballard W, Kimmel S, Ullmann B, Schilling T. Stages of embryonic development of the zebrafish. Dev. Dyn. 1995. pp. 203–253. [DOI] [PubMed]
- Westerfield M. The zebrafish book. A guide for the laboratory use of zebrafish (Danio rerio) 5 edn. Univ of Oregon Press; 2007. [Google Scholar]
- Kokel D, Bryan J, et al. Rapid behavior-based identification of neuroactive small molecules in the zebrafish. Nat. Chem. Biol. 2010;6:231–237. doi: 10.1038/nchembio.307. [DOI] [PMC free article] [PubMed] [Google Scholar]
- Rihel J, Prober DA, et al. Zebrafish Behavioral Profiling Links Drugs to Biological Targets and Rest/Wake Regulation. Science. 2010;327:348–351. doi: 10.1126/science.1183090. [DOI] [PMC free article] [PubMed] [Google Scholar]
- Cachat J, Stewart A, et al. Measuring behavioral and endocrine responses to novelty stress in adult zebrafish. Nat. Protoc. 2010;5:1786–1799. doi: 10.1038/nprot.2010.140. [DOI] [PubMed] [Google Scholar]
- Cachat J, Stewart A, et al. Three-Dimensional Neurophenotyping of Adult Zebrafish Behavior. PLoS ONE. 2011;6:e17597. doi: 10.1371/journal.pone.0017597. [DOI] [PMC free article] [PubMed] [Google Scholar]
- Sledge D, Yen J. Critical duration of exposure for developmental chlorpyrifos-induced neurobehavioral toxicity. Neurotoxicol. Teratol. 2011;33:742–751. doi: 10.1016/j.ntt.2011.06.005. [DOI] [PMC free article] [PubMed] [Google Scholar]
- Stewart A, Wu N. Pharmacological modulation of anxiety-like phenotypes in adult zebrafish behavioral models. Prog. Neuropsychopharmacol. Biol. Psychiatry. 2011;35:1421–1431. doi: 10.1016/j.pnpbp.2010.11.035. [DOI] [PubMed] [Google Scholar]
- Eddins D, Cerutti D, Williams P, Linney E, Levin ED. Zebrafish provide a sensitive model of persisting neurobehavioral effects of developmental chlorpyrifos exposure: comparison with nicotine and pilocarpine effects and relationship to dopamine deficits. Neurotoxicol. Teratol. 2010;32:99–108. doi: 10.1016/j.ntt.2009.02.005. [DOI] [PMC free article] [PubMed] [Google Scholar]
- Emran F, Rihel J, Dowling J. A behavioral assay to measure responsiveness of zebrafish to changes in light intensities. J. Vis. Exp. 2008. p. e923. [DOI] [PMC free article] [PubMed]
- Pelkowski S, Kapoor M, et al. A novel high-throughput imaging system for automated analyses of avoidance behavior in zebrafish larvae. Behav. Brain Res. 2011;223:135–144. doi: 10.1016/j.bbr.2011.04.033. [DOI] [PMC free article] [PubMed] [Google Scholar]
- Richendrfer H, Pelkowski S, et al. Assessment of developmental toxicity by automated analyses of behavior in zebrafish larvae. Unpublished observations. 2012.
- Richendrfer H, Pelkowski S, Colwill RM, Creton R. On the edge: pharmacological evidence for anxiety-related behavior in zebrafish larvae. Behav. Brain Res. 2012;228:99–106. doi: 10.1016/j.bbr.2011.11.041. [DOI] [PMC free article] [PubMed] [Google Scholar]
- Richendrfer HA, Pelkowski S, Colwill R, Creton R. Developmental sub-chronic exposure to chlorpyrifos reduces anxiety-related behavior in zebrafish larvae. Neurotoxicol. Teratol. 2012. [DOI] [PMC free article] [PubMed]
- Egan RJ, Bergner CL, et al. Understanding behavioral and physiological phenotypes of stress and anxiety in zebrafish. Behav. Brain Res. 2009;205:38–44. doi: 10.1016/j.bbr.2009.06.022. [DOI] [PMC free article] [PubMed] [Google Scholar]
- Colwill R, Creton R. In: Zebrafish protocols for neurobehavioral research. Kalluef A, Stewart A, editors. Vol. 66. Springer Protocols; 2012. [Google Scholar]


