Abstract
Mitochondria dysfunction has been reported in various kidney diseases but how it leads to kidney fibrosis and how this is regulated is unknown. Here we found that mitochondrial uncoupling protein 2 (UCP2) was induced in kidney tubular epithelial cells after unilateral ureteral obstruction in mice and that mice with ablated UCP2 resisted obstruction-induced kidney fibrosis. We tested this association further in cultured NRK-52E cells and found that TGF-β1 remarkably induced UCP2 expression. Knockdown of UCP2 largely abolished the effect of TGF-β1, whereas overexpression of UCP2 promoted tubular cell phenotype changes. Analysis using a UCP2 mRNA-3′-untranslated region luciferase construct showed that UCP2 mRNA is a direct target of miR-30e. MiR-30e was downregulated in tubular cells from fibrotic kidneys and TGF-β1-treated NRK-52E cells. A miR-30e mimic significantly inhibited TGF-β1-induced tubular-cell epithelial–mesenchymal transition, whereas a miR-30e inhibitor imitated TGF-β1 effects. Finally, genipin, an aglycone UCP2 inhibitor, significantly ameliorated kidney fibrosis in mice. Thus, the miR-30e/UCP2 axis has an important role in mediating TGF-β1-induced epithelial–mesenchymal transition and kidney fibrosis. Targeting this pathway may shed new light for the future of fibrotic kidney disease therapy.
Keywords: microRNA, mitochondria, renal fibrosis, tubular epithelial cell, UCP2
Renal fibrosis is a common response to chronic kidney diseases, including various types of nephropathy, nephritis, and other nephritic diseases, which eventually leads to irreversible renal failure.1 The key feature of renal fibrosis is the accumulation of myofibroblasts and extracellular matrix deposition, which may be originated from local interstitial fibroblasts, pericytes, bone marrow–derived circulating fibrocytes, local mesenchymal stem cells, endothelium, and injured epithelium. Among them, tubular epithelial cells have been recognized as one of the important contributors to extracellular matrix deposition.2, 3 Under physiological conditions, proximal tubular cells are densely packed with mitochondria. Because fully differentiated kidney proximal tubules have minimal glycolytic capacity, they have to rely on mitochondrial metabolism to synthesize adenosine triphosphate (ATP) and supply the energy for the active transport of sodium ions out of the tubule.4, 5 The limitation of the restoration of cellular ATP concentration has a pivotal role in overall cellular recovery.6
Mitochondria dysfunction is involved in a variety of renal diseases, including acute kidney injury induced by ischemia reperfusion7, 8 and renal fibrosis.9, 10, 11, 12 The uncoupling proteins (UCPs) are members of mitochondrial anion-carrier proteins, which are located on the mitochondrial inner membrane. Their primary function is to transfer protons from the internal membrane to the matrix of the mitochondria, and reduce the driving force of ATP synthase from catalyzing ATP synthesis.13, 14, 15 Uncoupling protein 2 (UCP2) protein exists in many organs such as spleen, pancreas, heart, lung, brain, kidney, liver, and muscle.16 UCP2-DD genotype is a potential genetic marker for predicting the progression of chronic renal failure among North Indians.17 UCP2s may also be susceptibility loci for chronic renal disease in Japanese individuals.18 Targeting UCP2 has been reported to treat many diseases, including global cerebral ischemia,19 metabolic syndrome,20 obesity,21 diabetes,22, 23 and atherosclerosis24 in animal models. However, the role and mechanisms of UCP2 in tubular-cell extracellular matrix production and renal fibrosis remain largely unknown.
MicroRNAs (miRNAs) are a family of endogenous noncoding RNA with 20–22 nucleotides in length. They are able to induce degradation or repress translation of target mRNAs. Many publications reported that miRNAs have a critical role in regulating cellular events, including gene expression, cell differentiation, proliferation, and apoptosis, as well as in the pathogenesis of many diseases such as kidney diseases.16 Joglekar et al.25 implicated the critical role of miR-30 family in regulating cultured fetal human pancreatic islet cell epithelial–mesenchymal transition (EMT).
In this study, we found that the expression of UCP2 was upregulated while miR-30e was decreased significantly in kidney tubular cells at day 3 and 7 after unilateral ureteral occlusion (UUO). Transforming growth factor-β1 (TGF-β1) treatment could upregulate UCP2 and downregulate miR-30e expression in cultured NRK-52E cells. Further experiments demonstrated that UCP2 was a target of miR-30e. Downregulation of miR-30e leads to UCP2 upregulation and triggers tubular cell phenotype changes and kidney fibrosis.
RESULTS
UCP2 is induced in tubular epithelial cells in mice with obstructive nephropathy
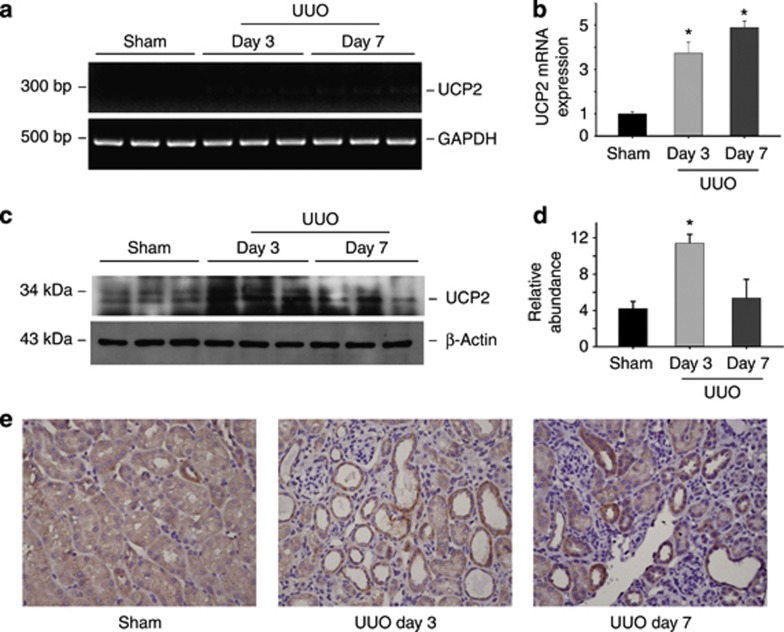
To explore whether UCP2 is induced in fibrotic kidneys, the expression of UCP2 in obstructed kidneys was detected. As shown in Figure 1a and b, UCP2 mRNA was significantly upregulated in kidneys at day 3 and 7 after UUO. Western blotting results showed that UCP2 expression was low in normal kidneys, but obviously increased in the fibrotic kidneys at day 3 after UUO (Figure 1c and d). Immunohistochemical staining revealed that UCP2 protein expression was largely induced and localized in the tubular cells at day 3 and 7 after UUO (Figure 1e).
Figure 1.
Uncoupling protein 2 (UCP2) is induced in tubular cells from kidneys with obstructive nephropathy. (a) Reverse transcriptase PCR analysis of UCP2 mRNA expression in whole-tissue lysate of the sham and obstructed kidneys. (b) Quantitative real-time PCR analysis reveals that UCP2 mRNA is upregulated after unilateral ureteral occlusion (UUO). Glyceraldehyde 3-phosphate dehydrogenase (GAPDH) was detected as normalization (*P<0.05 compared with control; n=5; mean±s.e.m. as shown). (c) Western blot shows UCP2 protein expression in the obstructive kidneys at day 3 and 7 after UUO. β-Actin was probed to confirm equal loading. (d) Graphic presentation of the relative abundance of UCP2 protein in kidneys (*P<0.05 compared with sham; n=3; mean±s.e.m. as shown). (e) Representative immunohistochemical staining images for UCP2 protein in normal and the obstructed kidneys at day 3 and 7 after UUO.
UCP2 ablation attenuates tubular EMT and kidney fibrosis after UUO
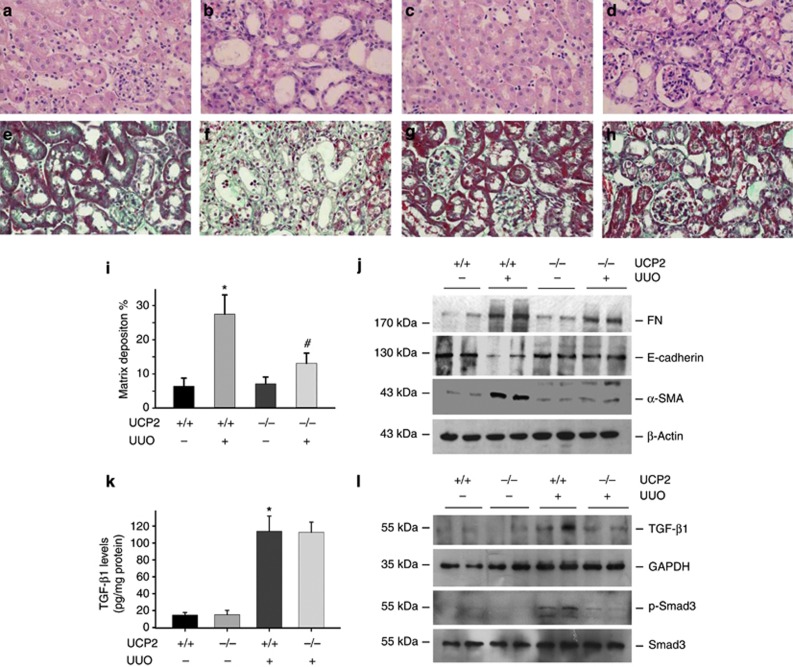
To further investigate the role of UCP2 in kidney fibrosis, age and sex-matched UCP2 knockouts (UCP2 −/−) and wild-type mice (UCP2+/+ mice) were done with UUO. In wild-type mice, at day 7 after ureteral obstruction, kidneys developed severe morphological lesions and extracellular matrix accumulation (Figure 2b and f). However, the renal morphology was much less disrupted in UCP2−/− mice (Figure 2d). Renal extracellular matrix deposition was significantly decreased in UCP2−/− mice (Figure 2h and i). In UCP2−/− mice, the abundance of fibronectin (FN) and α-smooth muscle actin (α-SMA) proteins in kidneys after ureteral obstruction were significantly lower than those in UCP2+/+ mice. The E-cadherin expression was largely restored in UCP2−/− kidneys after UUO (Figure 2j). These results indicate that ablation of UCP2 gene attenuated tubular-cell extracellular matrix production and kidney fibrosis in obstructive kidneys.
Figure 2.
Uncoupling protein 2 (UCP2) deletion protects against obstructive nephropathy in mice. (a–d) Representative hematoxylin and eosin staining micrographs show kidney morphology in sham control (a, c) and fibrotic kidneys (b, d) at day 7 in UCP2−/− (c, d) and wild-type (a, b) mice. (e–h) Representative Masson–Trichrome staining images for kidneys at day 7 after unilateral ureteral occlusion (UUO) in UCP2−/− (h) and wild-type (f) mice. (i) Semiquantitative analysis of matrix deposition in each group (*P<0.05 compared with sham; n=5; #P<0.05 vs UUO in UCP2+/+ mice; n=5; mean±s.e.m. as shown). (j) Western blot shows fibronectin (FN), E-cadherin, and α-smooth muscle actin (α-SMA) expression in the whole kidneys after UUO in UCP2−/− and UCP2+/+ mice. The samples were reprobed with anti-β-actin to confirm equal loading. (k) Transforming growth factor-β1 (TGF-β1) protein level in the obstructed kidneys from UCP2+/+ and UCP2−/− mice was determined by enzyme-linked immunosorbent assay (*P<0.05 compared with sham; n=5; mean±s.e.m. as shown). (l) Western blot shows TGF-β1 type I receptor and phosphorylated Smad3 abundance in the whole kidneys.
It is well known that TGF-β1 has a pivotal role in promoting tubular-cell EMT and kidney fibrosis. To investigate whether UCP2 ablation may affect TGF-β1 signaling, we detected TGF-β1 and TGF-β1 type I receptor expression in the sham or UUO kidneys. Results showed that TGF-β1 expression was remarkably induced in the UUO kidneys from both UCP2+/+ and UCP2−/− mice, but there was no difference between the two groups (Figure 2k). TGF-β1 type I receptor and phosphorylated Smad3 were induced in the obstructed kidneys, and both of them were attenuated in UCP2−/− UUO kidneys compared with UCP2+/+ UUO kidneys (Figure 2l). The above data indicate that TGF-β1 signaling was attenuated in the UCP2−/− UUO kidneys compared with UCP2+/+ UUO kidneys.
At day 7 after UUO, the kidney tubular cell proliferation revealed as Ki67-staining positive cells was similar, whereas cell apoptosis was less, in UCP2−/− UUO kidneys compared with UCP2+/+ UUO kidneys (Supplementary Figures S1 and S2 online). We also detected the macrophage infiltration by staining the kidney tissue with anti-F4/80, a well-used macrophage marker. The results showed that very few F4/80-positive cells could be found in both of the sham kidneys. The macrophage infiltration was remarkably increased in the UCP2+/+ UUO kidneys. In UCP2−/− UUO kidneys, infiltrated macrophages was much less than those in UCP2+/+ kidneys (Supplementary Figure S3 online).
UCP2 induction mediates TGF-β1-induced extracellular matrix production in NRK-52E cells
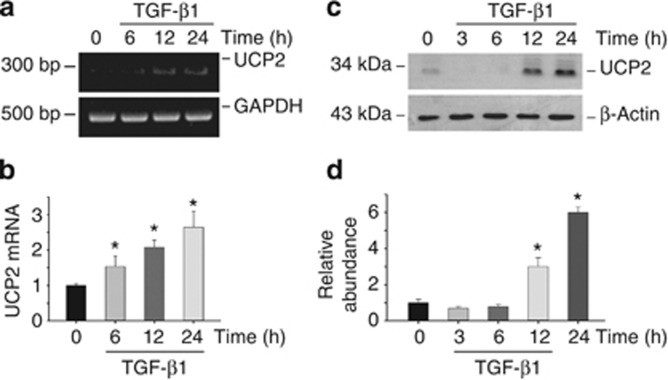
Because UCP2 expression was correlative with renal fibrosis in UUO model as shown above, we then wanted to know whether UCP2 is induced in cultured NRK-52E cells after TGF-β1 treatment. UCP2 mRNA was increased at 6 h and maintained at high level up to 24 h after TGF-β1 stimulation (Figure 3a and b). Western blotting results showed that UCP2 protein expression was also upregulated at 12 h and reached peak at 24 h after treatment (Figure 3c and d).
Figure 3.
Uncoupling protein 2 (UCP2) is induced by transforming growth factor-β1 (TGF-β1) treatment in NRK-52E cells. NRK-52E cells were treated with 5 ng/ml of TGF-β1 for various periods of time as indicated. (a) Reverse transcriptase PCR analysis for UCP2 mRNA expression. (b) Quantitative real-time PCR analysis shows UCP2 mRNA expression in NRK-52E cells. Glyceraldehyde 3-phosphate dehydrogenase (GAPDH) was detected as normalization (*P<0.05 compared with control; n=3; mean±s.e.m. as shown).(c) Western blot shows UCP2 expression in NRK-52E cells. The samples were reprobed with anti-β-actin to confirm equal loading. (d) Graphic presentation of relative abundance of UCP2 protein (*P<0.05 compared with control; n=3; mean±s.e.m. as shown).
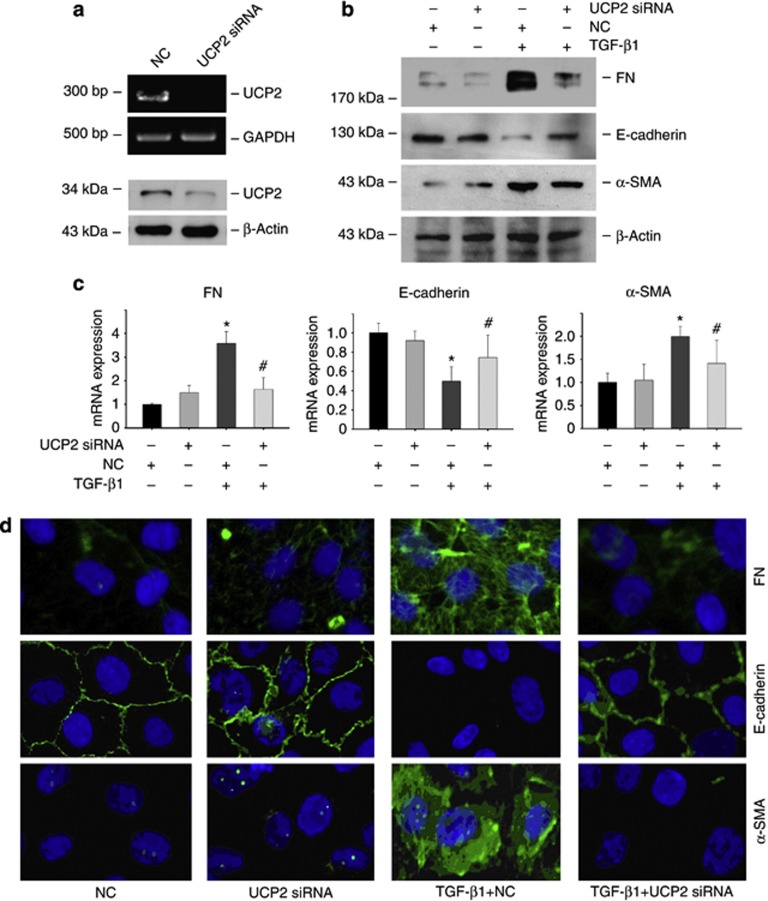
To verify the role of UCP2 in TGF-β1-induced tubular damage in vitro, UCP2 small interfering RNA (siRNA) was transfected into NRK-52E cells. As shown in Figure 4a, UCP2 siRNA transfection was able to efficiently downregulate UCP2 expression and largely abolish TGF-β1-induced α-SMA and FN mRNA upregulation and E-cadherin mRNA downregulation (Figure 4c). Western blotting (Figure 4b) and immunofluorescent staining (Figure 4d) revealed that TGF-β1 treatment induced tubular cell EMT, whereas knocking down UCP2 inhibited such effects. Together, it is concluded that UCP2 induction mediates TGF-β1 promoted signaling transduction and extracellular matrix production in tubular cells.
Figure 4.
Knockdown of uncoupling protein 2 (UCP2) inhibits transforming growth factor-β1 (TGF-β1)-induced extracellular matrix production in NRK-52E cells. Reverse transcriptase PCR and western blot analysis show UCP2 mRNA (a) and protein (d) abundance after UCP2 small interfering RNA (siRNA) transfection. (c) Quantitative PCR analysis shows the mRNA expression for fibronectin (FN), α-smooth muscle actin (α-SMA), and E-cadherin in NRK-52E cells stimulated by TGF-β1 for 48 h along with UCP2 or scramble siRNA transfection. Glyceraldehyde 3-phosphate dehydrogenase (GAPDH) was detected as normalization (*P<0.05 compared with control; n=3; #P<0.05 vs cells treated with TGF-β1 plus scramble siRNA transfection; n=3; mean±s.e.m. as shown). (d) Representative immunofluorescent staining images for FN, α-SMA, and E-cadherin in NRK-52E cells.
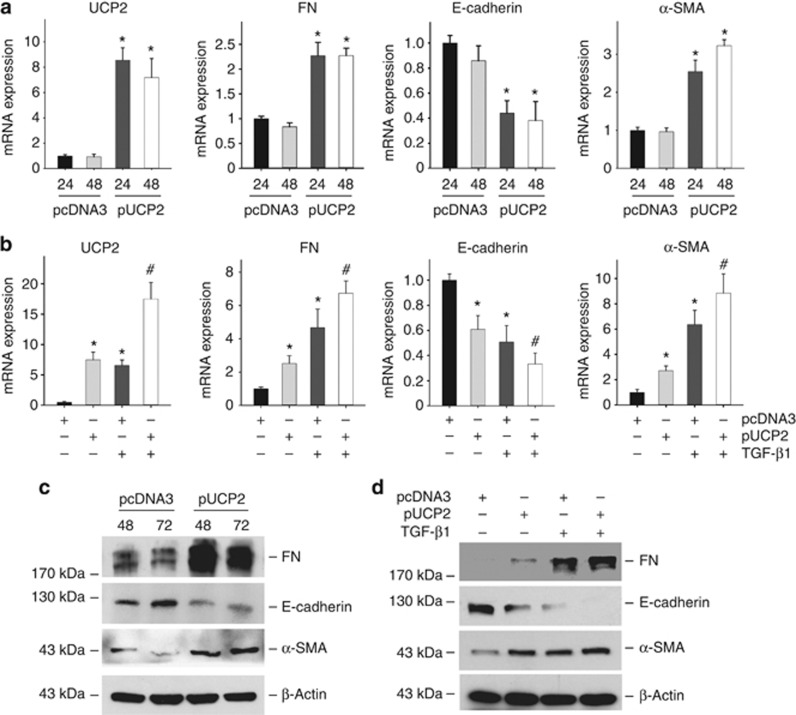
To further investigate if UCP2 can sufficiently induce tubular-cell extracellular matrix production, a UCP2 mammalian expression plasmid was transfected into NRK-52E cells. As shown in Figure 5a and c, similar to TGF-β1 stimulation, NRK-52E cells with UCP2 overexpression displayed a phenotypic conversion by loss of E-cadherin, induction of α-SMA and FN expression. Pre-transfection of UCP2 plasmid could also amplify TGF-β1-induced tubular cell phenotype changes (Figure 5b and d). These findings indicate that UCP2 is an important mediator for TGF-β1-induced kidney tubular-cell extracellular matrix production.
Figure 5.
Ectopic expression of uncoupling protein 2 (UCP2) induces NRK-52E-cell extracellular matrix production. (a) Quantitative real-time PCR reveals UCP2, fibronectin (FN), and α-smooth muscle actin (α-SMA) mRNA upregulation, and E-cadherin mRNA downregulation, in NRK-52E cells after UCP2 plasmid transfection. Glyceraldehyde 3-phosphate dehydrogenase is detected as normalization (*P<0.05 compared with pcDNA3; n=3; mean±s.e.m. as shown). (b) Quantitative real-time PCR shows UCP2, FN, α-SMA, and E-cadherin mRNA abundance in NRK-52E cells (*P<0.05 compared with pcDNA3; #P<0.05 vs transforming growth factor-β1 (TGF-β1) treatment; n=3; mean±s.e.m. as shown). (c) Western blot analysis shows that UCP2 plasmid transfection induced NRK-52E-cell extracellular matrix production. (d) Western blot analysis shows that pre-transfection of UCP2 plasmid amplified the effects of TGF-β1 on NRK-52E cells.
MiR-30e regulates UCP2 expression in NRK-52E cells
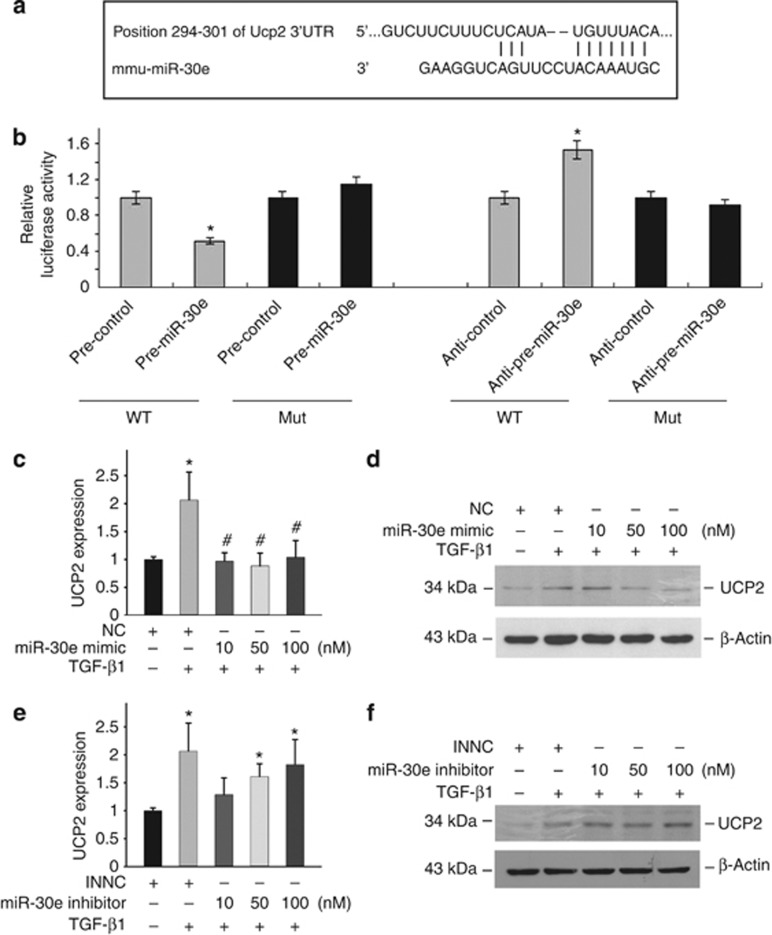
Above data reveal that UCP2 has a critical role in mediating TGF-β1-induced tubular-cell extracellular matrix production, but then how it is regulated remains obscure. Computational tools (TargetScan and PicTar) predicted the existence of evolutionarily conserved binding sites for miR-30e in the 3′ untranslated region (UTR) of UCP2 (Figure 6a). To demonstrate the role of miR-30e in regulating UCP2 expression in tubular cells, UCP2 3′-UTR was fused into a luciferase reporter plasmid, and transiently transfected into NRK-52E cells along with pre-miR-30e, pre-control, anti-miR-30e, and anti-control. Cells transfected with pre-miR-30e decreased luciferase activity, but when 3′-UTR was mutated, there was no decrease in luciferase activity. Although reduction of miR-30e expression by transfecting anti-miR-30e into NRK-52E cells resulted in an induction of luciferase activity, p3′-UTR mutation had no effect on luciferase activity (Figure 6b).
Figure 6.
Uncoupling protein 2 (UCP2) is a direct target of miR-30e. (a) Predicted consequential pairing of UCP2 and miR-30e. (b) Firefly luciferase reporters containing either wild-type (WT) or mutant (Mut) UCP2 3′-untranslated region (UTR) were cotransfected into NRK-52E cells with pre-miR-30e, pre-control, pre-anti-miR-30e, and pre-anti-control. Luciferase activity was determined at 24 h after transfection. Real-time PCR analysis (c) and western blot analysis (d) for UCP2 expression in NRK-52E cells (*P<0.05 compared with control; n=3; #P<0.05 vs cells treated with TGF-β1 plus negative control; n=3; mean±s.e.m. as shown). Real-time PCR analysis (e) and western blot analysis (f) detected UCP2 expression after miR-30e-inhibitor treatment in NRK-52E cells (*P<0.05 compared with inhibitor negative control (INNC); n=3; mean±s.e.m. as shown).
We next investigated the role of miR-30e on UCP2 expression. As shown in Figure 6c and d, transfection of miR-30e mimic could significantly decrease TGF-β1-induced UCP2 mRNA and protein expression at the concentration of 10, 50, and 100 nM, whereas transfection of miR-30e inhibitor alone could induce UCP2 mRNA and protein expression (Figure 6e and f), which mimicked the effect of TGF-β1. In conclusion, these results demonstrated that miR-30e is able to directly regulate UCP2 expression in kidney tubular cells.
MiR-30e/UCP2 axis is involved into TGF-β1-induced tubular cell injury
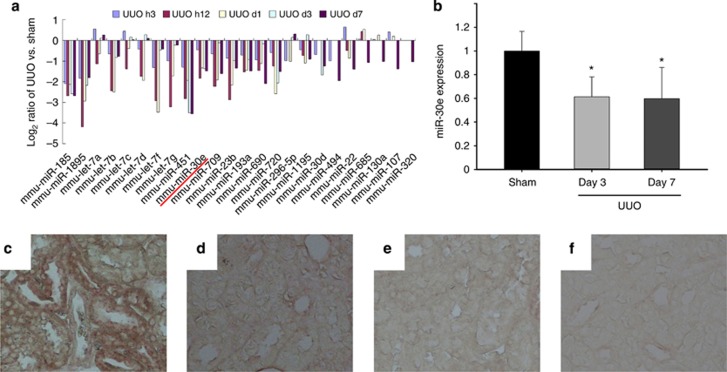
To investigate the role of miR-30e in kidney fibrosis, we examined the abundance of miR-30e in fibrotic kidney induced by UUO. There were as many as 62 miRNAs expressed variably in UUO kidneys compared with sham controls. Among them, miR-30e was drastically decreased after UUO in a time-dependent manner (Figure 7a). Quantitative real-time PCR results indicated that miR-30e expression was also decreased, which confirmed the microarray results (Figure 7b). In situ hybridization assay revealed that miR-30e was constitutively expressed in proximal tubular cells of normal kidneys and was markedly decreased in tubular cells at day 7 after UUO (Figure 7c–f).
Figure 7.
MiR-30e is downregulated in tubular cells from fibrotic kidneys with obstructive nephropathy. (a) The profile of microRNAs (miRNAs) expression in the obstructive kidneys at day 3 and 7 after unilateral ureteral occlusion (UUO). (b) Real-time PCR analysis for miR-30e expression; U6 snRNA was detected as normalization (*P<0.05 compared with sham control; n=5; mean±s.e.m. as shown). (c–f) In situ hybridization results show that miR-30e was detected in kidney tubular cells from sham control (c) and was almost gone in tubular cells at day 7 after UUO (d). (e) Sham, scramble. (f) UUO, scramble.
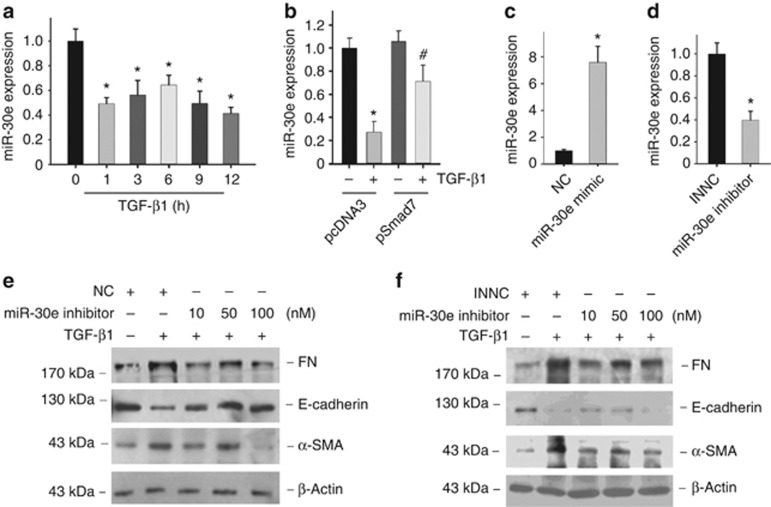
In cultured NRK-52E cells, miR-30e was significantly decreased as early as 1 h after TGF-β1 treatment (Figure 8a). To study whether Smad signaling is involved in TGF-β1-induced miR-30e downregulation, Smad7 plasmid transfection was used to block Smad signaling. As shown in Figure 8b, compared with pcDNA3, Smad7 transfection in NRK-52E cells could partially block TGF-β1-induced miR-30e downregulation, which suggest that Smad signaling activation has a role in regulating miR-30e expression.
Figure 8.
MiR-30e regulates NRK-52E-cell extracellular matrix production. (a) Real-time PCR analysis for miR-30e expression after transforming growth factor-β1 (TGF-β1) (5 ng/ml) treatment in NRK-52E cells; U6 snRNA was detected as normalization (*P<0.05 compared with control; n=3; mean±s.e.m. as shown). (b) Real-time PCR analysis for miR-30e expression after TGF-β1 treatment in NRK-52E cells transfected with or without Smad7 expressed plasmid for 12 h (*P<0.05 compared with pcDNA3 transfection; n=3; #P<0.05 vs TGF-β1 treatment in pcDNA3 transfected cells; n=3; mean±s.e.m. as shown). (c) Real-time PCR analysis for miR-30e expression after miR-30e-mimic treatment; U6 snRNA was detected as normalization (*P<0.05 compared with negative control; n=3; mean±s.e.m. as shown). (d) Real-time PCR analysis for miR-30e expression after miR-30e-inhibitor treatment; U6 snRNA was detected as normalization (*P<0.05 compared with negative control; n=3; mean±s.e.m. as shown). (e) Western blot analysis shows fibronectin (FN), α-smooth muscle actin (α-SMA), and E-cadherin expression after miR-30e-mimic transfection along with TGF-β1 treatment. (f) Western blot analysis shows miR-30e-inhibitor transfection reduced E-cadherin and increased FN and α-SMA expression.
To explore the role of miR-30e in tubular-cell extracellular matrix production, NRK-52E cells were transfected with miR-30e mimic or inhibitor. Figure 8e shows that miR-30e-mimic transfection resisted to TGF-β1-induced damage in NRK-52E cells, whereas miR-30e inhibitor promoted epithelial cell phenotype changes viewed as loss of E-cadherin, induction of α-SMA, and FN expression (Figure 8f).
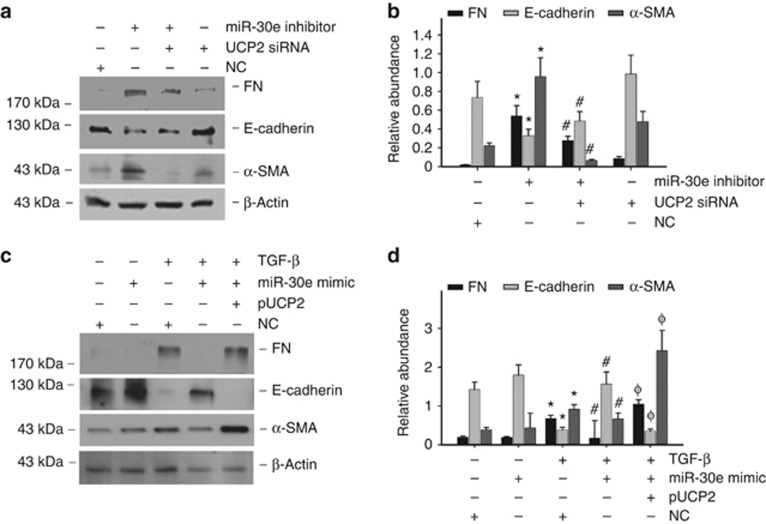
To assess whether UCP2 induction mediates miR-30e-regulated tubular cell EMT, miR-30e inhibitor and UCP2 siRNAs were contransfected into NRK-52E cells. As shown in Figure 9a and b, miR-30e inhibitor alone could remarkably induce tubular-cell extracellular matrix production, whereas UCP2 siRNA transfection could partially block such effects. Meanwhile, overexpression of UCP2 resisted to the effects of miR-30e mimic under TGF-β1 treatment (Figure 9c and d). Hence, UCP2 is required for miR-30e-mediated tubular-cell extracellular matrix production stimulated by TGF-β1.
Figure 9.
miR-30e regulates tubular cell phenotype changes via targeting uncoupling protein 2 (UCP2). (a) Western blot analysis for fibronectin (FN), α-smooth muscle actin (α-SMA), and E-cadherin expression in NRK-52E cells. (b) Graphic presentation of the relative abundance of FN, E-cadherin, and α-SMA protein expression (*P<0.05 compared with negative control (NC) transfection, n=3; #P<0.05 vs miR-30e-inhibitor transfection; n=3; mean±s.e.m. as shown). (c) Western blot detects FN, α-SMA, and E-cadherin expression in NRK-52E cells. (d) Graphic presentation of the relative abundance of FN, E-cadherin, and α-SMA protein expression (*P<0.05 compared with NC transfection; n=3; #P<0.05 vs transforming growth factor-β1 (TGF-β1) with NC transfection; n=3; φP<0.05 vs TGF-β1 with miR-30e-mimic transfection; n=3; mean±s.e.m. as shown).
Inhibition of UCP2-mediated proton leak with genipin attenuates obstructive nephropathy in mice
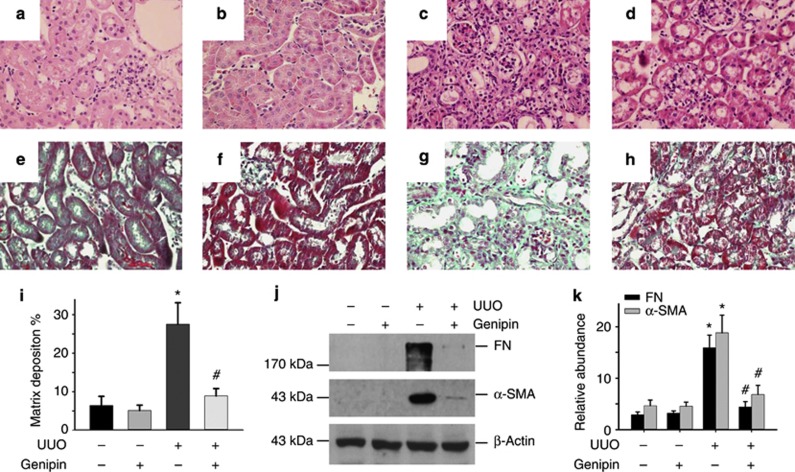
Above data have demonstrated the critical role of miR-30e/UCP2 axis in promoting tubular-cell extracellular matrix production and renal fibrosis, but then we want to know if targeting this axis has any beneficial effect on kidney fibrosis. Genipin is a small molecule derived from the gardenia plant, which specifically impedes UCP2-mediated proton leak in mitochondria.26, 27 Regarding the critical role of UCP2 in promoting tubular-cell extracellular matrix production and kidney fibrosis, it is worthwhile to testing the beneficial effect of genipin on suppressing renal fibrosis. Compared with UUO mice treated with vehicle, tubulointerstitial lesion of UUO mice treated with genipin at 100 mg/kg/day exhibited less kidney tubular damage and interstitial fibrosis (Figure 10a–h). Genipin administration also reduced the collagen matrix deposition compared with UUO plus vehicle group (Figure 10i). Western blot results indicated that administration of genipin could reduce FN and α-SMA abundance (Figure 10j and k).
Figure 10.
Blocking of uncoupling protein 2 (UCP2) with genipin attenuates obstructive nephropathy in mice. (a–h) Representative hematoxylin and eosin staining (a d) or Masson–Trichrome staining (e–h) micrographs show kidney histology in sham control treated with vehicle (a. e) or genipin (b, f), and unilateral ureteral occlusion (UUO) mice treated with vehicle (c, g) or genipin (d, h). (i): Morphometric analysis of kidney fibrosis in the UUO model (*P<0.05 compared with sham control; n=5; #P<0.05 vs UUO mice treated with vehicle; mean±s.e.m. as shown). (j) Western blot results show FN and α-SMA abundance in kidney from mice administrated with genipin or vehicle. (k) Graphic presentation of the relative abundance of FN and α-SMA protein in kidneys (*P<0.05 compared with sham; n=5; #P<0.05 vs UUO mice; n=5; mean±s.e.m. as shown).
DISCUSSION
We report here that UCP2 was induced in the tubular epithelial cells with obstructive nephropathy, and UCP2-knockout mice were resistant to kidney fibrosis. TGF-β1 treatment could induce UCP2 expression, which promoted TGF-β1-induced EMT in NRK-52E cells. Furthermore, our study also demonstrated that UCP2 was a direct target of miR-30e, and targeting UCP2 attenuated tubular-cell extracellular matrix production and kidney fibrosis.
UCP2 is a mitochondrial carrier protein with homology to other uncoupling proteins like UCP1 and UCP3.28 It regulates mitochondrial ATP production by catalyzing the translocation of protons across the mitochondrial membrane to reduce the proton-motive force.29, 30 Under many diseased conditions, such as diabetes, atherosclerosis, and liver fibrosis, UCP2 expression is upregulated. In our study, both UCP2 mRNA and protein expression was induced in the fibrotic kidneys at day 3 after UUO (Figure 1). However, the protein level of UCP2 almost returned to normal, whereas its mRNA level reached peak at day 7. The reason is not quite clear right now. It had been reported that UCP2 expression is tightly regulated at the translational levels,31 and UCP2 mRNA and protein levels are not often synonymous in many other tissues.32 In the UUO kidneys, less UCP2 protein at day 7 may be because of protein degradation. However, the reason for such discrepancy needs more investigation.
The TGF-β1 Smad signaling pathway has a critical role in driving tubular-cell EMT. The level of TGF-β1 expression in the obstructed kidneys was found to be similar in wild-type and UCP2-null mice. But TGF-β1 type I receptor abundance and phosphorylated Smad3 level in the fibrotic kidney were reduced in the UCP2−/− mice compared with wild-type mice. It is plausible that UCP2-promoting tubular-cell extracellular matrix production is associated with Smad signaling activation.
Macrophage infiltration and activation is thought to be another important contributor to kidney fibrosis.33, 34, 35, 36 In this study, macrophage infiltration was little, and no kidney fibrosis was detected in both UCP2+/+ and UCP2−/− sham kidneys, suggesting that UCP2 has little effect on macrophage infiltration and kidney fibrosis under normal conditions. However, at day 7 after UUO, macrophage infiltration was increased much more in UCP2+/+ kidneys compared with those in UCP2−/− kidneys. There are two possible reasons for the less macrophage infiltration in UCP2−/− UUO kidneys: First, it is the consequence of less kidney fibrosis, which is easily to be understood. Second, although UCP2 has no major effect on macrophage infiltration under normal conditions, its deletion may disturb macrophage function under diseased conditions, which may inhibit macrophage infiltration and subsequently ameliorate kidney fibrosis. We have got some preliminary data that indicate that transfer of UCP2−/− macrophages ameliorated UUO-induced kidney fibrosis in the mice. However, the underlying mechanisms are not clear, and more work is still needed to further clarify the role of UCP2−/− macrophages on kidney fibrosis.
Our studies indicate that UCP2 has a critical role in tubular-cell extracellular matrix production in renal fibrosis, but little is known about the regulating mechanisms for UCP2 induction in the fibrotic kidney. Over the past years, miRNAs have been shown to regulate many cellular processes, including EMT. The global analysis of miRNAs expression reported here revealed that the profiles of expression of numerous miRNAs were different between fibrotic kidney and normal kidney (Figure 7). We previously reported that miR-200 family could regulate TGF-β1-induced renal tubular EMT through the Smad pathway by targeting ZEB1 and ZEB2.37 Other groups have found that miR-29 is involved in collagen expression and renal fibrosis.38, 39 In this study, we found that miR-30e expression was relative with renal tubular-cell extracellular matrix production by targeting UCP2.
MiR-30e belongs to miR-30 family, which includes miR-30a, -30b, -30c, -30d, and -30e. They all have the similar ‘seed sequence' in their 5′ terminus. MiR-30 family is abundantly expressed in the kidney, and is required for pronephros development40 and podocyte homeostasis.41 Hepatic miR-30b and miR-30c have been previously detected in CCl4-induced liver fibrosis. Downregulated miR-30 family members promote EMT of epithelial thyroid cells in anaplastic thyroid carcinomas42 and cultured fetal human pancreatic islets in pancreatitis.25 Our studies found that miR-30e expression was dramatically decreased in fibrotic kidney, whereas miR-30d displayed slight changes, and miR-30a, -30b, and -30c were not significantly altered. Although miR-30 family members have a similar sequence, their genes are localized in different chromosomes. It is possible that the gene-expression pattern may be dependent on different stimuli. We also found that TGF-β1 was able to downregulate miR-30e in NRK-52E cells, but the effect of TGF-β1 on miR-30e expression could be partially blocked by Smad7 transfection. Therefore, downregulation of the miR-30e by TGF-β1 at least partially depends on the intracellular Smad signaling activation. By overexpression or knockdown of miR-30e expression in NRK-52E cells, we found that miR-30e was critical for TGF-β1-induced tubular epithelial injury. Taken together, our results indicate that miR-30e downregulation could be an important facilitator for TGF-β1-induced tubular-cell extracellular matrix production in renal fibrosis.
miR-30e is markedly reduced during renal fibrosis process, and the expression of UCP2 is upregulated. This is in line with the TargetScan prediction that UCP2 may be the target of miR-30e. Here our current study provides multiple lines of evidence that UCP2 is regulated by miR-30e. First, the expression of miR-30e was inversely related to the amount of UCP2 mRNA and protein in UUO model of renal fibrosis and NRK-52E cells stimulated by TGF-β1. Second, in NRK-52E cells, miR-30e knockdown increased UCP2 levels both at the mRNA and protein levels and was accompanied by the phenotypic change similar to TGF-β1 treatment. Third, overexpression of miR-30e resulted in a significant downregulation of UCP2, and resisted to TGF-β1-induced epithelial cell phenotype changes. Fourth, analyses of the luciferase reporter carrying the UCP2 3′-UTR indicate that miR-30e directly interacts with this sequence, and the putative miR-30e-binding sites are essential for miR-30e regulation. Fifth, knockdown UCP2 expression could block the effects of miR-30e inhibitor on promoting tubular-cell extracellular matrix production.
As a member of a family of anion-carrier proteins expressed in the inner membrane of the mitochondria, UCP2, by virtue of its proton-leak activity, decreases the generation of ATP and therefore causes tubular cell EMT. Interestingly, decreased miR-30e expression has been found in tubular epithelial cells of fibrotic kidney. These clues lead to pinpoint the role of miR-30e, targeting UCP2 as a heretofore hidden disease regulator of chronic renal diseases. Furthermore, kidney fibrosis was largely inhibited by treatment with genipin, which is a UCP2 blocker. In summary, it is concluded that miR-30e/UCP2 axis has an important role in mediating TGF-β1-induced epithelial-cell extracellular matrix production and kidney fibrosis. Targeting this pathway may shed a new light for the future fibrotic kidney diseases therapy.
Materials and Methods
Animal models
Colonies of homozygous UCP2-knockout (UCP2–/–) mice were kindly provided by Professor Chenyu Zhang of Nanjing University, China.43 UCP2−/− mice were generated on C57BL/6J background. The experiments were performed on male UCP2−/− mice with an average age of 8–10 weeks. Age- and gender-matched C57BL/6J mice (UCP2+/+) were used as wild-type control throughout the experiments. There was no statistical difference as to the body weight, kidney weight, blood urine nitrogen (BUN), and serum creatinine between control and UCP2−/− mice. For UUO experiment, wild-type and UCP2−/− mice were randomly assigned into two groups with five mice for sham and UUO. A well-characterized mouse UUO model was performed as previously reported.44 The mice were killed at day 3 and 7 after UUO.
Cell culture and treatment
Rat renal tubular epithelial cells (NRK-52E) were obtained from American Type Culture Collection (Manassas, VA). Cells were cultured as previous described.45 Human Recombinant TGF-β1 (5 ng/ml) (cat no.: 100-B-010-CF; R&D, Minneapolis, MN) was added to the serum-free medium for various periods of time. MiR-30e mimic, miR-30e inhibitor, UCP2 siRNA (GenePharma, Shanghai, China), UCP2 plasmid (provided by professor Chenyu Zhang), and Smad7 plasmid (obstained from Invitrogen, Grand Island, NY) were transfected into NRK-52E cells using Lipofectamine 2000 reagent (Invitrogen) according to the manufacturer's instructions.
Immunofluorescent and immunohistochemical staining
Immunofluorescent staining of culture NRK-52E cells and immunohistochemical staining of kidney sections was performed by using an established protocol.45 Cell-culture coverslips or kidney sections were immunostained with primary antibodies against FN (cat no.: F3648; Sigma, St Louis, MO), α-SMA (cat no.: a5228, Sigma), E-cadherin (cat no.: 610181; BD Biosciences, San Jose, CA), and F4/80 (cat no.:14-4801-81; ebioscience, San Diego, CA). Paraffin-embedded kidney tissue sections were stained with anti-UCP2 antibody (cat no.:ab77363; Abcam, Cambridge, MA) and Ki-67(cat no. ab15580; Abcam). Slides were viewed with a Nikon Eclipse 80i Epi-fluorescence microscope equipped with a digital camera (DS-Ri1; Nikon, New York, NY).
Western blot analysis
Western blot analysis for specific protein expression was performed according to an established procedure.45 The primary antibodies used were as follows: anti-FN, anti-α-SMA, anti-E-cadherin, and anti-UCP2. Quantification was performed by measuring the intensity of the signals with the aid of National Institutes of Health Image software package.
RNA isolation and microarray analysis
Total RNA was extracted using Trizol reagent (Invitrogen, Carlsbad, CA) according to the manufacturer's guide. RNA labeling and hybridization on miRNA microarray chips were conducted as previously described.46, 47 Briefly, 50 μg of total RNA was purified using the mirVANA miRNA isolation kit (Ambion, Austin, TX) to enrich small RNA fraction. Purified RNA was labeled with fluorescein, and hybridization was carried out on the CapitalBio Mammalian miRNA Array V 3.0 (CapitalBio, Beijing, China) containing 509 probes in triplicate. The miRNA microarray data have been deposited into Gene Expression Omnibus (GEO accession number GSE13840) and can be prepared in a fully minimum information about a microarray experiment compliant manner.
PCR
cDNAs were synthesized using ReverTra Kit (Toyobo, Osaka, Japan) according to the manufacturer's instructions. Gene expression was measured using cDNA, real-time PCR Master Mix Reagents (Roche, Mannheim, Germany), and a set of gene primers with 7300 real-time PCR system (Supplementary Table S1 online) (Applied Biosystems, Foster City, CA). To detect miRNA expression level, miScript PCR system (Qiagen, Valencia, CA) was used for quantification of miRNA transcripts. For real-time PCR analysis, the relative amount of miRNA or gene to internal control was calculated by using the equation 2ΔCT, in which ΔCT=CT gene−CT control.
Plasmid construction and luciferase assay
The entire mouse UCP2 3′-UTR segment was amplified by PCR. The PCR products were inserted into the p-MIR-report plasmid. For luciferase reporter assay, 1 μg firefly luciferase reporter plasmid, 0.5 μg β-galactosidase expression vector (Ambion), and equal amounts (200 pmol) of pre-miR-30e, anti-miR-30e, or scrambled negative control RNA were transfected into cells. At 24 h after transfection, cells were assayed using luciferase assay kits (Promega, Madison, WI).
In situ hybridization
In situ hybridization was used to identify the localization of miR-30e in normal and UUO kidneys following the manufacturer's instructions (Exiqon, Woburn, MA). Briefly, the slides were hybridized with double-digoxygenin-labeled, lucked nucleic acid miR-30e probe, locked nucleic acid scrambled miRNA probe, lucked nucleic acid U6 snRNA probe, and lucked nucleic acid miR-126 probe (positive control). The slides was mounted with mounting medium and viewed under light microscope (Nikon Eclipse 80i).
Statistical analysis
Statistical analysis was performed using SigmaStat software (Jandel Scientific Software, San Rafael, CA).Comparison between groups was made using one-way analysis of variance, followed by the Student–Newman–Keuls test. P<0.05 was considered statistically significant.
Acknowledgments
This work was supported by the National Science Foundation of China Grants 3171093/C1102, National Basic Research Program of China 973 Program (2011CB504005), and Jiangsu Province's Outstanding Medical Academic Leader Program (SWKJ 2006-50) to Junwei Yang. National Basic Research Program of China 973 Program (2012CB517601), National Science Foundation of China Grants 81070550/ H0503 to Chunsun Dai.
All the authors declared no competing interests.
Footnotes
SUPPLEMENTARY MATERIAL
Figure S1. Ki67 staining in kidneys from UCP2−/− or UCP2+/+ mice.
Figure S2. TUNEL staining in kidneys from UCP2−/− or UCP2+/+ mice.
Figure S3. Macrophage infiltration in the kidneys from UCP2−/− or UCP2+/+ mice.
Table S1. Nucleotide sequences of the primers used for PCR.
Supplementary material is linked to the online version of the paper at http://www.nature.com/ki
Supplementary Material
References
- Schnaper HW, Kopp JB. Renal fibrosis. Front Biosci. 2003;8:e68–e86. doi: 10.2741/925. [DOI] [PubMed] [Google Scholar]
- Kalluri R, Neilson EG. Epithelial-mesenchymal transition and its implications for fibrosis. J Clin Invest. 2003;112:1776–1784. doi: 10.1172/JCI20530. [DOI] [PMC free article] [PubMed] [Google Scholar]
- Rastaldi MP. Epithelial-mesenchymal transition and its implications for the development of renal tubulointerstitial fibrosis. J Nephrol. 2006;19:407–412. [PubMed] [Google Scholar]
- Balaban RS, Mandel LJ. Metabolic substrate utilization by rabbit proximal tubule. An NADH fluorescence study. Am J Physiol. 1988;254:F407–F416. doi: 10.1152/ajprenal.1988.254.3.F407. [DOI] [PubMed] [Google Scholar]
- Wirthensohn G, Guder WG. Renal substrate metabolism. Physiol Rev. 1986;66:469–497. doi: 10.1152/physrev.1986.66.2.469. [DOI] [PubMed] [Google Scholar]
- Weinberg JM, Venkatachalam MA, Roeser NF, et al. Energetic determinants of tyrosine phosphorylation of focal adhesion proteins during hypoxia/reoxygenation of kidney proximal tubules. Am J Pathol. 2001;158:2153–2164. doi: 10.1016/S0002-9440(10)64687-1. [DOI] [PMC free article] [PubMed] [Google Scholar]
- Brooks C, Wei Q, Cho SG, et al. Regulation of mitochondrial dynamics in acute kidney injury in cell culture and rodent models. J Clinical Invest. 2009;119:1275–1285. doi: 10.1172/JCI37829. [DOI] [PMC free article] [PubMed] [Google Scholar]
- Hall AM, Unwin RJ. The not so 'mighty chondrion': emergence of renal diseases due to mitochondrial dysfunction. Nephron Physiol. 2007;105:p1–10. doi: 10.1159/000096860. [DOI] [PubMed] [Google Scholar]
- de Cavanagh EM, Ferder M, Inserra F, et al. Angiotensin II, mitochondria, cytoskeletal, and extracellular matrix connections: an integrating viewpoint. American journal of physiology. Heart Circ Physiol. 2009;296:H550–H558. doi: 10.1152/ajpheart.01176.2008. [DOI] [PubMed] [Google Scholar]
- Kim J, Kim DS, Park MJ, et al. Omi/HtrA2 protease is associated with tubular cell apoptosis and fibrosis induced by unilateral ureteral obstruction. Am J Physiol Renal Physiol. 2010;298:F1332–F1340. doi: 10.1152/ajprenal.00737.2009. [DOI] [PMC free article] [PubMed] [Google Scholar]
- Rodrigues MA, Rodrigues JL, Martins NM, et al. Carvedilol protects against cisplatin-induced oxidative stress, redox state unbalance and apoptosis in rat kidney mitochondria. Chem Biol Interact. 2011;189:45–51. doi: 10.1016/j.cbi.2010.10.014. [DOI] [PubMed] [Google Scholar]
- Liang HL, Sedlic F, Bosnjak Z, et al. SOD1 and MitoTEMPO partially prevent mitochondrial permeability transition pore opening, necrosis, and mitochondrial apoptosis after ATP depletion recovery. Free Radic Biol Med. 2010;49:1550–1560. doi: 10.1016/j.freeradbiomed.2010.08.018. [DOI] [PMC free article] [PubMed] [Google Scholar]
- Bouillaud F, Ricquier D, Thibault J, et al. Molecular approach to thermogenesis in brown adipose tissue: cDNA cloning of the mitochondrial uncoupling protein. Proc Natl Acad Sci USA. 1985;82:445–448. doi: 10.1073/pnas.82.2.445. [DOI] [PMC free article] [PubMed] [Google Scholar]
- Negre-Salvayre A, Hirtz C, Carrera G, et al. A role for uncoupling protein-2 as a regulator of mitochondrial hydrogen peroxide generation. FASEB J. 1997;11:809–815. [PubMed] [Google Scholar]
- Arsenijevic D, Onuma H, Pecqueur C, et al. Disruption of the uncoupling protein-2 gene in mice reveals a role in immunity and reactive oxygen species production. Nat Genet. 2000;26:435–439. doi: 10.1038/82565. [DOI] [PubMed] [Google Scholar]
- Mattiasson G, Sullivan PG. The emerging functions of UCP2 in health, disease, and therapeutics. Antioxid Redox Signal. 2006;8:1–38. doi: 10.1089/ars.2006.8.1. [DOI] [PubMed] [Google Scholar]
- Tripathi G, Sharma RK, Baburaj VP, et al. Genetic risk factors for renal failure among north Indian ESRD patients. Clin Biochem. 2008;41:525–531. doi: 10.1016/j.clinbiochem.2008.01.009. [DOI] [PubMed] [Google Scholar]
- Yoshida T, Kato K, Fujimaki T, et al. Association of genetic variants with chronic kidney disease in Japanese individuals. Clin J Am Soc Nephrol. 2009;4:883–890. doi: 10.2215/CJN.04350808. [DOI] [PMC free article] [PubMed] [Google Scholar]
- Mattiasson G, Shamloo M, Gido G, et al. Uncoupling protein-2 prevents neuronal death and diminishes brain dysfunction after stroke and brain trauma. Nat Med. 2003;9:1062–1068. doi: 10.1038/nm903. [DOI] [PubMed] [Google Scholar]
- Moller DE. New drug targets for type 2 diabetes and the metabolic syndrome. Nature. 2001;414:821–827. doi: 10.1038/414821a. [DOI] [PubMed] [Google Scholar]
- Horvath TL, Diano S, Miyamoto S, et al. Uncoupling proteins-2 and 3 influence obesity and inflammation in transgenic mice. Int J Obes Relat Metab Disord. 2003;27:433–442. doi: 10.1038/sj.ijo.0802257. [DOI] [PubMed] [Google Scholar]
- Polonsky KS, Semenkovich CF. The pancreatic beta cell heats up: UCP2 and insulin secretion in diabetes. Cell. 2001;105:705–707. doi: 10.1016/s0092-8674(01)00389-0. [DOI] [PubMed] [Google Scholar]
- Souza BM, Assmann TS, Kliemann LM, et al. The role of uncoupling protein 2 (UCP2) on the development of type 2 diabetes mellitus and its chronic complications. Arq Bras Endocrinol Metabol. 2011;55:239–248. doi: 10.1590/s0004-27302011000400001. [DOI] [PubMed] [Google Scholar]
- Oberkofler H, Iglseder B, Klein K, et al. Associations of the UCP2 gene locus with asymptomatic carotid atherosclerosis in middle-aged women. Arterioscler Thromb Vasc Biol. 2005;25:604–610. doi: 10.1161/01.ATV.0000153141.42033.22. [DOI] [PubMed] [Google Scholar]
- Joglekar MV, Patil D, Joglekar VM, et al. The miR-30 family microRNAs confer epithelial phenotype to human pancreatic cells. Islets. 2009;1:137–147. doi: 10.4161/isl.1.2.9578. [DOI] [PubMed] [Google Scholar]
- Parton LE, Ye CP, Coppari R, et al. Glucose sensing by POMC neurons regulates glucose homeostasis and is impaired in obesity. Nature. 2007;449:228–232. doi: 10.1038/nature06098. [DOI] [PubMed] [Google Scholar]
- Zhang CY, Parton LE, Ye CP, et al. Genipin inhibits UCP2-mediated proton leak and acutely reverses obesity- and high glucose-induced beta cell dysfunction in isolated pancreatic islets. Cell Metab. 2006;3:417–427. doi: 10.1016/j.cmet.2006.04.010. [DOI] [PubMed] [Google Scholar]
- Fleury C, Neverova M, Collins S, et al. Uncoupling protein-2: a novel gene linked to obesity and hyperinsulinemia. Nat Genet. 1997;15:269–272. doi: 10.1038/ng0397-269. [DOI] [PubMed] [Google Scholar]
- Echtay KS, Winkler E, Klingenberg M. Coenzyme Q is an obligatory cofactor for uncoupling protein function. Nature. 2000;408:609–613. doi: 10.1038/35046114. [DOI] [PubMed] [Google Scholar]
- Echtay KS, Roussel D, St-Pierre J, et al. Superoxide activates mitochondrial uncoupling proteins. Nature. 2002;415:96–99. doi: 10.1038/415096a. [DOI] [PubMed] [Google Scholar]
- Hurtaud C, Gelly C, Bouillaud F, et al. Translation control of UCP2 synthesis by the upstream open reading frame. Cell Mol Life Sci. 2006;63:1780–1789. doi: 10.1007/s00018-006-6129-0. [DOI] [PMC free article] [PubMed] [Google Scholar]
- Hurtaud C, Gelly C, Chen Z, et al. Glutamine stimulates translation of uncoupling protein 2mRNA. Cell Mol Life Sci. 2007;64:1853–1860. doi: 10.1007/s00018-007-7039-5. [DOI] [PMC free article] [PubMed] [Google Scholar]
- Anders HJ, Ryu M. Renal microenvironments and macrophage phenotypes determine progression or resolution of renal inflammation and fibrosis. Kidney Int. 2011;80:915–925. doi: 10.1038/ki.2011.217. [DOI] [PubMed] [Google Scholar]
- Ricardo SD, van Goor H, Eddy AA. Macrophage diversity in renal injury and repair. J Clin Invest. 2008;118:3522–3530. doi: 10.1172/JCI36150. [DOI] [PMC free article] [PubMed] [Google Scholar]
- Nishida M, Okumura Y, Fujimoto S, et al. Adoptive transfer of macrophages ameliorates renal fibrosis in mice. Biochem Biophys Res Commun. 2005;332:11–16. doi: 10.1016/j.bbrc.2005.04.083. [DOI] [PubMed] [Google Scholar]
- Ferenbach D, Kluth D. Macrophage cell therapy in renal disease. Semin Nephrol. 2010;30:345–353. doi: 10.1016/j.semnephrol.2010.03.010. [DOI] [PubMed] [Google Scholar]
- Xiong M, Jiang L, Zhou Y, et al. The miR-200 family regulates TGF-beta1-induced renal tubular epithelial to mesenchymal transition through Smad pathway by targeting ZEB1 and ZEB2 expression. Am J Physiol Renal Physiol. 2012;302:F369–F379. doi: 10.1152/ajprenal.00268.2011. [DOI] [PubMed] [Google Scholar]
- Wang B, Komers R, Carew R, et al. Suppression of microRNA-29 expression by tgf-beta1 promotes collagen expression and renal fibrosis. J Am Soc Nephrol. 2012;23:252–265. doi: 10.1681/ASN.2011010055. [DOI] [PMC free article] [PubMed] [Google Scholar]
- Qin W, Chung AC, Huang XR, et al. TGF-beta/Smad3 signaling promotes renal fibrosis by inhibiting miR-29. J Am Soc Nephrol. 2011;22:1462–1474. doi: 10.1681/ASN.2010121308. [DOI] [PMC free article] [PubMed] [Google Scholar]
- Agrawal R, Tran U, Wessely O. The miR-30 miRNA family regulates Xenopus pronephros development and targets the transcription factor Xlim1/Lhx1. Development. 2009;136:3927–3936. doi: 10.1242/dev.037432. [DOI] [PMC free article] [PubMed] [Google Scholar]
- Shi S, Yu L, Chiu C, et al. Podocyte-selective deletion of dicer induces proteinuria and glomerulosclerosis. J Am Soc Nephrol. 2008;19:2159–2169. doi: 10.1681/ASN.2008030312. [DOI] [PMC free article] [PubMed] [Google Scholar]
- Roderburg C, Urban GW, Bettermann K, et al. Micro-RNA profiling reveals a role for miR-29 in human and murine liver fibrosis. Hepatology. 2011;53:209–218. doi: 10.1002/hep.23922. [DOI] [PubMed] [Google Scholar]
- Zhang CY, Baffy G, Perret P, et al. Uncoupling protein-2 negatively regulates insulin secretion and is a major link between obesity, beta cell dysfunction, and type 2 diabetes. Cell. 2001;105:745–755. doi: 10.1016/s0092-8674(01)00378-6. [DOI] [PubMed] [Google Scholar]
- Yang J, Dai C, Liu Y. Systemic administration of naked plasmid encoding hepatocyte growth factor ameliorates chronic renal fibrosis in mice. Gene Ther. 2001;8:1470–1479. doi: 10.1038/sj.gt.3301545. [DOI] [PubMed] [Google Scholar]
- Yang Z, Xiaohua W, Lei J, et al. Uric acid increases fibronectin synthesis through upregulation of lysyl oxidase expression in rat renal tubular epithelial cells. Am J Physiol Renal Physiol. 2010;299:F336–F346. doi: 10.1152/ajprenal.00053.2010. [DOI] [PubMed] [Google Scholar]
- Liu CG, Calin GA, Meloon B, et al. An oligonucleotide microchip for genome-wide microRNA profiling in human and mouse tissues. Proc Natl Acad Sci USA. 2004;101:9740–9744. doi: 10.1073/pnas.0403293101. [DOI] [PMC free article] [PubMed] [Google Scholar]
- Thomson JM, Parker J, Perou CM, et al. A custom microarray platform for analysis of microRNA gene expression. Nat Methods. 2004;1:47–53. doi: 10.1038/nmeth704. [DOI] [PubMed] [Google Scholar]
Associated Data
This section collects any data citations, data availability statements, or supplementary materials included in this article.


