

Abstract
Aim
To determine if cytokine release with a solid phase assay is predictive of adverse responses for a range of therapeutic mAbs.
Methods
Cytokine ELISAs and a multi-array system were used to compare responses generated by different therapeutic mAbs using a solid phase assay. Flow cytometry was employed to determine the cellular source of those cytokines.
Results
Only TGN1412 and muromonab-CD3 stimulated CD4+ T-cell mediated cytokine release characterized by significant (all P < 0.0001) IFNγ, TNFα, IL-2, IL-4, IL-5, IL-10, IL-12, IL-13, IL-17 and IL-22 release, comparable with T-cell mitogen. Significantly greater (P < 0.0001) IL-2 release with TGN1412 (2894–6051 pg ml−1) compared with muromonab-CD3 (62–262 pg ml−1) differentiated otherwise comparable cytokine responses. Likewise, TGN1412 stimulated significantly more (P = 0.0001) IL-2 producing CD4+ T-cells than muromonab-CD3 and induced Th1, Th2, Th17 and Th22 subsets that co-release this cytokine. Significant TNFα release was observed with bevacizumab (P = 0.0001), trastuzumab (P = 0.0031) and alemtuzumab (P = 0.0177), but no significant IL-2 release. TGN1412 and muromonab-CD3 caused pro-inflammatory cytokine release despite significantly (both P < 0.0001) increasing numbers of T-cells with a regulatory phenotype.
Conclusions
The severity of the adverse response to TGN1412 compared with muromonab-CD3 and other therapeutic mAbs correlates with the level of IL-2 release.
Keywords: cytokine release assays, preclinical safety testing, TGN1412, therapeutic monoclonal antibodies
WHAT IS ALREADY KNOWN ABOUT THIS SUBJECT
During the phase I clinical trial of the therapeutic monoclonal antibody (mAb) TGN1412, a life-threatening ‘cytokine storm’ occurred that could have been predicted if new solid phase assays had been applied.
WHAT THIS STUDY ADDS
This study reports cytokine release with a range of therapeutic mAbs using a solid phase assay and demonstrates that Muromonab-CD3 stimulates a TGN1412-like response.
Introduction
TGN1412 is an immunomodulatory CD28 super-agonistic mAb generated to balance therapeutically the immune system in diseases such as rheumatoid arthritis, leukaemia and multiple sclerosis 1. During its first-in-man phase I clinical trial, TGN1412 caused a near fatal systemic inflammatory response in all six healthy trial volunteers, characterized by the rapid induction of pro-inflammatory cytokine release 2. All six volunteers became critically ill with pulmonary infiltrates and lung injury, renal failure and disseminated intravascular coagulation necessitating transfer to intensive care for cardiopulmonary support and dialysis 2. Prolonged cardiovascular shock and acute respiratory distress developed in two patients who required intensive organ support for 8–16 days 2. All six patients survived but have a greatly increased chance of developing cancers and immune system disorders in later life.
During the subsequent investigation it was confirmed that the trial material was not contaminated, had been correctly formulated and that pre-clinical safety tests, repeated with the same trial material, did not predict an adverse response in man 3, 4. It has now emerged that the choice of animal model chosen for pre-clinical safety testing of TGN1412, cynomolgus macaques, had been inappropriate because the CD4+ effector memory T-cell subset of this species does not express CD28 and, therefore, cannot be stimulated by CD28 agonists 5. In contrast the CD4+ effector memory T-cell subset of man expresses high levels of CD28 and, therefore, can be stimulated by TGN1412, causing rapid release of high levels of pro-inflammatory cytokines 5. However, pre-clinical in vitro safety tests with human white blood cells and TGN1412 in aqueous phase did not elicit pro-inflammatory cytokine release despite the presence of CD4+ effector memory T-cells. It was postulated that pre-clinical in vitro safety tests did not replicate in vivo presentation of TGN1412 due to the biology of CD28 4, where engagement with the natural ligands CD80 and CD86 on antigen-presenting cells is localized at the point of cell-to-cell contact promoting the formation of an immunological synapse 6. Presentation of TGN1412 in the aqueous phase in vitro assay would, therefore, involve engagement of CD28 outside of the immunological synapse or disruption of its formation, which is known to impede T-cell activation 4, 7, 8. In order to mimic delivery of a localized signal, TGN1412 was coated onto the surface of tissue culture wells in a solid phase assay so that human T-cells could only interact with the mAb at one interface 4.
The result of this simple change in presentation was dramatic – massive pro-inflammatory cytokine release and lymphoproliferation that mirrored the responses to TGN1412 observed in trial volunteers 4. The possibility that this response was an artefact was ruled out by the observation that white blood cells from cynomolgus macaques were not stimulated by TGN1412 in a solid phase assay at any dose 4. The pro-inflammatory response to TGN1412 was human specific. Although the solid phase assay does not replicate in vivo presentation of TGN1412, which is not fully understood, it does induce substantial cytokine release equivalent to that reported in trial volunteers. Attempts to model in vivo presentation of TGN1412 have focused on endothelial cell co-cultures 4, 9–11 and more recently pre-culture of peripheral blood mononuclear cells (PBMC) at high density 12, with promising results. Whilst these approaches stimulate pro-inflammatory cytokine release with TGN1412 they do not yet mirror the high levels of IL-2 and IFNγ release seen in trial volunteers and the solid phase assay, implying only partial replication of in vivo presentation 2, 4, 5. Despite the application of solid phase assays in the evaluation of emerging therapeutic mAbs, little comparative data exist that evaluate the pre-clinical value of this approach for predicting cytokine release syndrome (CRS), which we now address here.
Methods
Aqueous and solid phase stimulation of PBMC with therapeutic mAbs
The following therapeutic mAbs were compared: TGN1412 (anti-CD28, IgG4κ, TeGenero AG, Wüzburg, Germany), muromonab-CD3 (anti-CD3, murine IgG2a, Orthoclone-OKT3, Johnson and Johnson, New Jersey, USA), alemtuzumab (anti-CD52, IgG1, Alemtuzumab, Genzyme, Massachusetts, USA), rituximab (anti-CD20, IgG1, Mabthera, Roche, Basel, Switzerland), trastuzumab (anti-HER2, IgG1, herceptin, Roche), bevacizumab (anti-VEGF, IgG1, Avastin, Roche), daclizumab (anti-IL-2R, IgG1, Zenopax, Roche), basiliximab (anti-IL-2R, IgG1, Simulect, Novartis, Basel, Switzerland), etanercept (anti-TNFα, IgG1 fusion protein, Enbrel, Pfizer, New York, USA), Infliximab (anti-TNFα, IgG1, Remicade, Merck, New Jersey, USA), adalimumab (anti-TNFα, IgG1, Humira, Abbot, Illinois, USA) and natalizumab (anti-α4 integrin, IgG4κ, Tysabri, Biogen IDEC, Massachusetts, USA). Purified human IgG1 and IgG4κ, endotoxin and preservative free, were used as isotype controls (AMS Biotechnology Ltd, Abingdon, UK). The lectin phytohaemagglutinin (Sigma-Aldrich Ltd, Poole, UK) at 10 μg ml–1 was used as a mitogen control. Responses to therapeutic mAbs were evaluated in both aqueous phase, at 1 μg well–1 in 96 well tissue culture treated polystyrene microtitre plates, and in solid phase by coating 1 μg well–1 in 60 μl of phosphate buffered saline onto non-tissue culture treated 96 well polypropylene microtitre plates (Corning Inc., Corning, NY, USA) for 1–2 h at room temperature followed by two washes to remove unbound mAb, as previously described 5. A concentration of 1 μg well−1 of therapeutic mAb was chosen for comparability with previously published findings on cytokine release using this method 5. The drug/molecular target nomenclature follows Alexander et al. 13.
Human PBMC were isolated from heparinized blood, obtained from healthy donors, with local ethical consent HuMAC (06/022RS), by density gradient separation (Lymphoprep, Axis-Shield, Oslo, Norway), resuspended in RPMI 1640 culture medium (Sigma-Aldrich Ltd) supplemented with 15% foetal calf serum (v/v), 2 mm L-glutamine (Sigma-Aldrich Ltd), 50 U ml–1 penicillin and 0.05 mg ml–1 streptomycin (Sigma-Aldrich Ltd), and rested overnight in a humidified incubator at 37°C with 5% CO2. Donor PBMC were adjusted to 1 × 10⁶ cells ml–1 and 200 μl were added to tissue culture plate wells in triplicate sets and incubated for 24, 48 and 72 h, respectively, for each method and therapeutic mAb tested, in a humidified incubator at 37°C with 5% CO2.
Measurement of cytokine release
Culture supernatants harvested at 24, 48 and 72 h were assayed by enzyme-linked immunosorbent assay (ELISA) for the cytokines IFNγ, TNFα, IL-2 and IL-8 as previously described 5, 14, IL-17 and IL-22 using DuoSet® ELISA kits (R&D Systems Inc, Minneapolis, MN, USA) and TGFβ1 in acid activated samples using the antibody pair MAB240 and BAF240 according to manufacturer's instructions (R&D Systems Inc., Abingdon, UK). The cytokines IFNγ, TNFα, IL-1β, IL-10, IL-12 p70, IL-13, IL-2, IL-4, IL-5 and IL-8 in culture supernatants harvested at 72 h were measured using Human Th1/Th2 7 and 10-Plex MSD® kits (Meso Scale Discovery, Gaithersburg, Maryland, USA), using a mix of corresponding WHO/NIBSC cytokine standards consisting of 86/680, 04/158, 88/656, 90/586, 89/520, 93/722, 95/544, 94/622, 88/786 and 88/606 (NIBSC, Potters Bar, UK) to prepare the calibration curve. Where cytokine release exceeded upper detection limits culture supernatants were diluted ×10 or ×40-fold prior to assay.
Intracellular cytokine staining
Intracellular cytokine staining and immunophenotyping were performed as previously described 4. The following antibody conjugates were used: anti-human CD3 PerCP, anti-human CD4 APC, anti-human TNFα PE (BD Biosciences, Oxford, UK), anti-human-CD3 PE-Cy7, anti-human CD4 APC-Cy7, anti-human CD25 APC, anti-human IFNγ Pacific Blue, anti-human IL-2 PerCP/Cy5.5, anti-human IL-17 FITC (BioLegend Ltd, Cambridge, UK), anti-human IL-17 Alexa Fluor® 647 (eBioscience Ltd, Hatfield, UK) and anti-FoxP3 PE (Miltenyi Biotec, Surrey, UK). A minimum of 30 000 gated lymphocyte events per well was acquired using a FACSCanto II flow cytometer equipped with HTS plate reader and analyzed using FACSDiva software (BD Biosciences).
Statistical analysis
Statistical analysis of cytokine release data was performed using Minitab 16 software (Minitab Ltd, Coventry, UK). A general linear model was employed for repeated measures analysis of log10 transformed data using Dunnett's test with 95% confidence to counteract for multiple comparisons. The corresponding isotype control for each therapeutic mAb, for each time point, was used as the control group for comparisons: human IgG1 was used as the control for most therapeutic mAbs (including muromonab-CD3, a murine IgG2a) with the exception of TGN1412 and natalizumab for which an isotype-matched human IgG4κ control was used. A difference was considered significant if P < 0.05. Cytokine release and magnitude data given are the geometric mean with 95% confidence interval of the geometric mean shown in brackets. ELISA and multiplex data consist of the mean responses of between seven and 16 donors from two to four independent experiments, respectively. All flow cytometry data consist of the mean responses of between eight and 12 donors from two to three independent experiments. A paired t-test was used for comparisons of flow cytometry data. Group flow cytometry data shown are arithmetic mean ± SEM.
Results
A high level of IL-2 release is predictive of a TGN1412-like response
Cytokine release with different therapeutic mAbs presented in aqueous and solid phase assays was compared with isotype controls. In the solid phase assay both muromonab-CD3 and TGN1412 stimulated significant IL-2 release (both P < 0.0001 at 24, 48 and 72 h) at levels comparable with or exceeding mitogen, an immunological toxin, respectively (Figure 1). TGN1412 stimulated significantly more IL-2 release compared with muromonab-CD3 (P < 0.0001 at 24, 48 and 72 h) (Figure 1). TGN1412 caused IL-2 concentration to increase steadily over 72 h, whereas a sharp decrease was noted at 72 h with muromonab-CD3 and mitogen (Figure 1). In the aqueous phase assay TGN1412 stimulated trace amounts of IL-2 release that was significant (P = 0.0080 at 24 h) compared with IgG4, but not IgG1 control (Figure 1). Muromonab-CD3 stimulated significant IL-2 release (P < 0.0001 and P = 0.0081 at 24 and 48 h, respectively) in the aqueous phase assay, at a lower level than mitogen (Figure 1). It was noted that the anti-IL-2 receptor antibodies basiliximab and daclizumab caused a significant increase in IL-2 concentration (P = 0.0003 and P = 0.0004, respectively, at 48 h and for both P < 0.0001 at 72 h) (Figure 1). Conversely, a significant decrease in IL-2 concentration was noted with the anti-TNFα mAbs adalimumab, etanercept and infliximab (P = 0.0038, P = 0.0019 and P = 0.0001, respectively, at 72 h), in the aqueous phase assay (Table 1).
Figure 1.
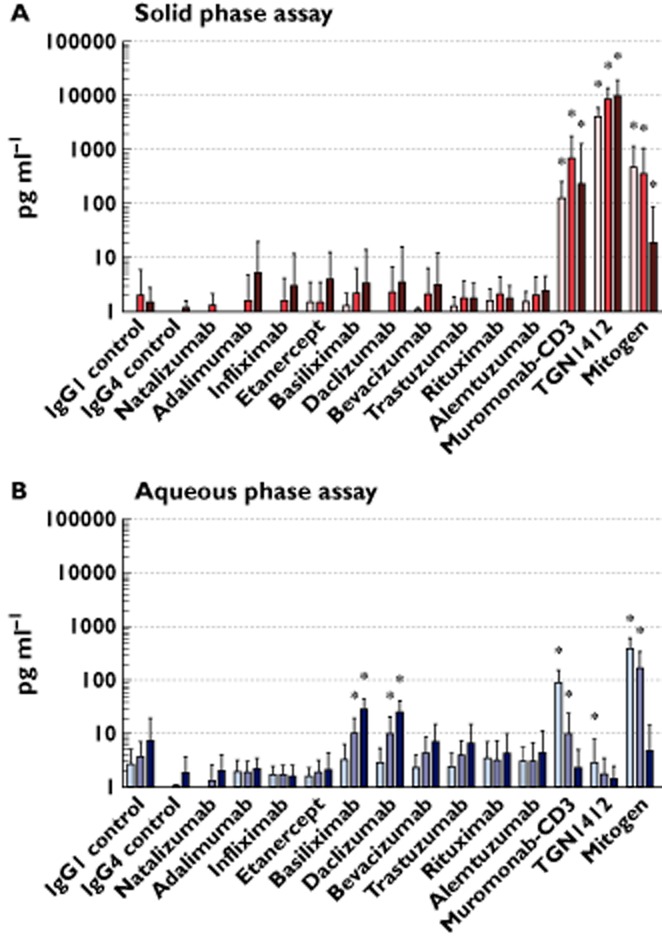
IL-2 released from human PBMC stimulated in vitro for 24, 48 and 72 h with 1 μg well−1 of indicated therapeutic mAbs in solid phase (A) and aqueous (B) phase, measured by ELISA. IL-2 release in pg ml−1 of culture supernatant is shown on a log10 scale. The lectin PHA at 10 μg ml−1 was used as mitogen control. All responses were compared to IgG1 isotype control with the exception of TGN1412 and natalizumab which were compared with IgG4κ isotype control, for respective time points. Group responses shown are geometric means, error bars shown are 95% confidence intervals. * Denotes a response significantly greater than the respective control (repeated measures analysis of log10 transformed data using Dunnett's method and 95% confidence). Donor responses shown (n = 7–16) are from 2–4 independent experiments. IL-2 releasre  , 24 h;
  , 48 h;
  , 72 h
Table 1.
IL-2 release from human PBMC stimulated in vitro for 24, 48 and 72 h with 1 μg well−1 of indicated therapeutic mAbs in aqueous and solid phase. Cytokine release was measured by ELISA. The lectin PHA at 10 μg ml−1 was used as mitogen control. All responses were compared with IgG1 isotype control with the exception of TGN1412 and natalizumab which were compared with IgG4κ isotype control. Group responses shown are geometric mean followed by 95% confidence interval in brackets. Significant results are shown in bold (repeated measures analysis of log10 transformed data using Dunnett's method and 95.0% confidence). Donor responses shown (n = 7–16) are from 2–4 independent experiments
| Therapeutic mAb | Aqueous phase IL-2 release at: | Solid phase IL-2 release at: | ||||
|---|---|---|---|---|---|---|
| 24 h | 48 h | 72 h | 24 h | 48 h | 72 h | |
| IgG1 control | 2.6 pg ml−1 (1.4, 5.0) | 3.7 pg ml−1 (1.9, 7.0) | 7.3 pg ml−1 (2.8, 19.0) | 1.0 pg ml−1 (1.0, 1.0) | 2.0 pg ml−1 (0.7, 6.0) | 1.5 pg ml−1 (0.8, 2.7) |
| IgG4 control | 1.0 pg ml−1 (1.0, 1.0) | 1.0 pg ml−1 (1.0, 1.1) | 1.8 pg ml−1 (0.9, 3.6) | 1.0 pg ml−1 (1.0, 1.0) | 1.0 pg ml−1 (1.0, 1.0) | 1.2 pg ml−1 (0.9, 1.5) |
| Natalizumab | 1.0 pg ml−1 (1.0, 1.0) | 1.3 pg ml−1 (0.7, 2.5) | 2.00 pg ml−1 (0.9, 4.1) | 1.0 pg ml−1 (1.0, 1.0) | 1.3 pg ml−1 (0.8, 2.1) | 1.0 pg ml−1 (1.0, 1.0) |
| Adalimumab | 1.9 pg ml−1 (1.2, 3.1) | 1.9 pg ml−1 (1.1, 3.0) | 2.2 pg ml−1 (1.4, 3.4) | 1.0 pg ml−1 (1.0, 1.0) | 1.6 pg ml−1 (0.5, 4.6) | 5.2 pg ml−1 (1.3, 19.8) |
| Infliximab | 1.6 pg ml−1 (1.1, 2.5) | 1.7 pg ml−1 (1.1, 2.6) | 1.6 pg ml−1 (1.0, 2.5) | 1.0 pg ml−1 (1.0, 1.0) | 1.5 pg ml−1 (0.6, 4.1) | 3.0 pg ml−1 (0.7, 11.7) |
| Etanercept | 1.6 pg ml−1 (1.1, 2.3) | 1.9 pg ml−1 (1.1, 3.1) | 2.1 pg ml−1 (1.0, 4.3) | 1.5 pg ml−1 (0.6, 3.5) | 1.5 pg ml−1 (0.6, 3.5) | 3.9 pg ml−1 (1.2, 12.6) |
| Basiliximab | 3.2 pg ml−1 (1.7, 6.3) | 10.3 pg ml−1 (5.7, 18.7) | 27.7 pg ml−1 (17.9, 42.9) | 1.3 pg ml−1 (0.7, 2.2) | 2.2 pg ml−1 (0.8, 6.2) | 3.3 pg ml−1 (0.8, 14.1) |
| Daclizumab | 2.8 pg ml−1 (1.5, 5.3) | 10.1 pg ml−1 (5.1, 20.2) | 24.8 pg ml−1 (15.2, 40.3) | 1.0 pg ml−1 (1.0, 1.0) | 2.3 pg ml−1 (0.8, 6.7) | 3.5 pg ml−1 (0.8, 15.8) |
| Bevacizumab | 2.3 pg ml−1 (1.3, 3.9) | 4.2 pg ml−1 (2.1, 8.4) | 6.8 pg ml−1 (3.2, 14.7) | 1.1 pg ml−1 (0.9, 1.2) | 2.1 pg ml−1 (0.7, 6.2) | 3.1 pg ml−1 (0.8, 11.8) |
| Trastuzumab | 2.4 pg ml−1 (1.4, 4.2) | 3.9 pg ml−1 (2.1, 7.3) | 6.6 pg ml−1 (2.9, 14.8) | 1.2 pg ml−1 (0.8, 1.8) | 1.8 pg ml−1 (0.9, 3.6) | 1.7 pg ml−1 (0.9, 3.3) |
| Rituximab | 3.4 pg ml−1 (1.6, 7.3) | 3.1 pg ml−1 (1.3, 7.3) | 4.3 pg ml−1 (1.9, 9.8) | 1.5 pg ml−1 (0.9, 2.6) | 2.0 pg ml−1 (1.0, 4.3) | 1.8 pg ml−1 (1.0, 3.0) |
| Alemtuzumab | 2.9 pg ml−1 (1.6, 5.4) | 3.0 pg ml−1 (1.3, 6.6) | 4.5 pg ml−1 (1.8, 11.0) | 1.5 pg ml−1 (1.0, 2.3) | 2.0 pg ml−1 (0.9, 4.2) | 2.4 pg ml−1 (1.3, 4.5) |
| Muromonab-CD3 | 87.4 pg ml−1 (50.2, 152) | 9.9 pg ml−1 (4.1, 23.6) | 2.3 pg ml−1 (1.1, 5.0) | 128 pg ml−1 (62.9, 262) | 709 pg ml−1 (278, 1 806) | 234 pg ml−1 (41.8, 1 310) |
| TGN1412 | 2.8 pg ml−1 (1.0, 7.8) | 1.7 pg ml−1 (0.9, 3.4) | 1.4 pg ml−1 (0.8, 2.4) | 4185 pg ml−1 (2894, 6051) | 8 657 pg ml−1 (5 476, 13 687) | 10 037 pg ml−1 (5 230, 19 263) |
| Mitogen | 390 pg ml−1 (253, 601) | 165 pg ml−1 (82.7, 328) | 4.7 pg ml−1 (1.6, 14.0) | 470 pg ml−1 (190, 1163) | 353 pg ml−1 (116, 1 070) | 18.1 pg ml−1 (3.83, 85.9) |
Muromonab-CD3 and TGN1412 stimulated significant IFNγ release (both P < 0.0001 at 24, 48 and 72 h), at levels comparable with mitogen (Table 2). Muromonab-CD3 also stimulated significant IFNγ release in the aqueous phase assay (P < 0.0001 at 24, 48 and 72 h), but TGN1412 did not. Alemtuzumab stimulated low but significant levels of IFNγ release (P = 0.0020 and P = 0.0007 at 24 and 72 h, respectively) in the aqueous phase assay, but not in the solid phase assay (Table 2). Natalizumab, adalimumab, infliximab, etanercept, basiliximab, daclizumab, bevacizumab, trastuzumab and rituximab did not stimulate significant IFNγ release in either aqueous or solid phase assays (Table 2).
Table 2.
IFNγ release from human PBMC stimulated in vitro for 24, 48 and 72 h with 1 μg well−1 of indicated therapeutic mAbs in aqueous and solid phase. Cytokine release was measured by ELISA. The lectin PHA at 10 μg ml−1 was used as mitogen control. All responses were compared with IgG1 isotype control with the exception of TGN1412 and natalizumab which were compared with IgG4κ isotype control. Group responses shown are geometric mean followed by 95% confidence interval in brackets. Significant results are shown in bold (repeated measures analysis of log10 transformed data using Dunnett's method and 95% confidence). Donor responses shown (n = 7–16) are from 2–4 independent experiments
| Therapeutic mAb | Aqueous phase IFNγ release at: | Solid phase IFNγ release at: | ||||
|---|---|---|---|---|---|---|
| 24 h | 48 h | 72 h | 24 h | 48 h | 72 h | |
| IgG1 control | 1.6 pg ml−1 (0.6, 4.8) | 1.6 pg ml−1 (0.8, 3.0) | 1.4 pg ml−1 (0.8, 2.5) | 2.1 pg ml−1 (0.4, 12.7) | 3.9 pg ml−1 (0.4, 34.7) | 4.6 pg ml−1 (0.9, 23.5) |
| IgG4 control | 1.4 pg ml−1 (0.7, 2.9) | 2.4 pg ml−1 (1.0, 5.5) | 1.8 pg ml−1 (0.9, 3.7) | 3.4 pg ml−1 (1.3, 8.5) | 3.1 pg ml−1 (1.2, 7.9) | 1.0 pg ml−1 (1.0, 1.1) |
| Natalizumab | 1.0 pg ml−1 (1.0, 1.0) | 1.0 pg ml−1 (1.0, 1.0) | 1.5 pg ml−1 (0.9, 2.6) | 2.5 pg ml−1 (1.1, 5.4) | 2.3 pg ml−1 (1.0, 5.2) | 1.0 pg ml−1 (1.0, 1.0) |
| Adalimumab | 1.3 pg ml−1 (0.7, 2.6) | 1.0 pg ml−1 (1.0, 1.0) | 1.0 pg ml−1 (1.0, 1.0) | 5.4 pg ml−1 (0.9, 32.1) | 26.1 pg ml−1 (4.4, 155.4) | 31.2 pg ml−1 (5.4, 182) |
| Infliximab | 1.0 pg ml−1 (1.0, 1.0) | 1.2 pg ml−1 (0.8, 2.0) | 1.6 pg ml−1 (0.8, 3.4) | 4.0 pg ml−1 (0.7, 23.2) | 8.0 pg ml−1 (1.4, 45.5) | 8.4 pg ml−1 (1.2, 57.6) |
| Etanercept | 1.0 pg ml−1 (1.0, 1.0) | 1.0 pg ml−1 (1.0, 1.0) | 1.2 pg ml−1 (0.8, 1.7) | 7.2 pg ml−1 (1.1, 48.3) | 7.3 pg ml−1 (1.1, 50.8) | 6.4 pg ml−1 (1.0, 41.3) |
| Basiliximab | 1.0 pg ml−1 (1.0, 1.0) | 1.0 pg ml−1 (1.0, 1.0) | 1.2 pg ml−1 (0.8, 1.6) | 2.1 pg ml−1 (0.4, 11.9) | 2.2 pg ml−1 (0.4, 13.7) | 2.2 pg ml−1 (0.3, 14.4) |
| Daclizumab | 1.2 pg ml−1 (0.8, 1.7) | 1.1 pg ml−1 (0.9, 1.3) | 1.1 pg ml−1 (0.9, 1.4) | 2.2 pg ml−1 (0.3, 13.7) | 2.2 pg ml−1 (0.3, 14.6) | 3.3 pg ml−1 (0.5, 23.6) |
| Bevacizumab | 1.0 pg ml−1 (1.0, 1.0) | 1.2 pg ml−1 (0.8, 1.9) | 1.3 pg ml−1 (0.7, 2.3) | 2.1 pg ml−1 (0.4, 11.3) | 10.6 pg ml−1 (1.1, 107) | 41.9 pg ml−1 (4.7, 374) |
| Trastuzumab | 1.0 pg ml−1 (1.0, 1.0) | 1.0 pg ml−1 (1.0, 1.0) | 1.5 pg ml−1 (0.8, 2.8) | 5.5 pg ml−1 (1.4, 22.6) | 23.3 pg ml−1 (5.0, 108) | 15.9 pg ml−1 (3.5, 71.6) |
| Rituximab | 1.3 pg ml−1 (0.7, 2.2) | 2.2 pg ml−1 (0.7, 6.7) | 2.1 pg ml−1 (0.8, 5.2) | 4.6 pg ml−1 (1.2, 17.1) | 10.3 pg ml−1 (2.3, 46.5) | 9.5 pg ml−1 (2.8, 32.3) |
| Alemtuzumab | 6.7 pg ml−1 (1.5, 30.4) | 3.6 pg ml−1 (1.1, 12.0) | 6.8 pg ml−1 (2.0, 22.3) | 7.5 pg ml−1 (1.8, 31.2) | 15.8 pg ml−1 (3.9, 65.0) | 8.6 pg ml−1 (2.5, 30.1) |
| Muromonab-CD3 | 361 pg ml−1 (211, 616) | 1 406 pg ml−1 (590, 3 350) | 2 209 pg ml−1 (1 096, 4 453) | 462 pg ml−1 (185, 1 154) | 5 554 pg ml−1 (3 061, 10 077) | 14 589 pg ml−1 (10 353, 20 559) |
| TGN1412 | 1.5 pg ml−1 (0.63, 3.3) | 1.4 pg ml−1 (0.7, 2.8) | 3.4 pg ml−1 (1.1, 10.1) | 624 pg ml−1 (363, 1 070) | 23 484 pg ml−1 (11 870, 46 462) | 36 714 pg ml−1 (23 090, 58 378) |
| Mitogen | 616 pg ml−1 (450, 844) | 8 747 pg ml−1 (6 232, 12 278) | 12 240 pg ml−1 (9 718, 15 416) | 1 001 pg ml−1 (700, 1 434) | 8 221 pg ml−1 (5 473, 12 351) | 17 840 pg ml−1 (13 199, 24 113) |
Muromonab-CD3 stimulated significant TNFα release in the solid and aqueous phase assay (both P < 0.0001 at 24, 48 and 72 h), at levels comparable with mitogen (Table 3). Similarly, TGN1412 stimulated significant TNFα release in the solid (P < 0.0001 at 24, 48 and 72 h) and aqueous phase assay (P = 0.0113, P = 0.0168 and P = 0.0363 at 24, 48 and 72 h, respectively), but TNFα release was 238 (53.5–1061) fold lower in the latter (Table 3). Significant TNFα release was noted with bevacizumab (P = 0.0001 at 24 h), trastuzumab (P = 0.0031 and P = 0.0423 at 24 and 48 h, respectively) and alemtuzumab (P = 0.0177 and P = 0.0387 at 24 and 48 h, respectively) in the solid phase assay (Table 3). Increased TNF-α release with daclizumab and rituximab was not significant (Table 3). This was only repeated with alemtuzumab (P < 0.0001 and P = 0.0002 at 24 and 48 h, respectively) in the aqueous phase assay (Table 3). The anti-TNFα mAbs adalimumab, infliximab and etanercept significantly reduced TNFα concentration in aqueous (at 24 h P = 0.0006, P = 0.0005 and P = 0.0126, respectively, all P < 0.0001 at 48 and 72 h) and solid phase assays (all P < 0.0001 at 24, 48 and 72 h) (Table 3). A significant reduction in TNFα release with natalizumab in the solid phase assay (P = 0.0001, P < 0.0001 and P < 0.0001 at 24, 48 and 72 h, respectively) and daclizumab in the aqueous phase assay (P = 0.0245 at 24 h) was noted (Table 3).
Table 3.
TNFα release from human PBMC stimulated in vitro for 24, 48 and 72 h with 1 μg well−1 of indicated therapeutic mAbs in aqueous and solid phase. Cytokine release was measured by ELISA. The lectin PHA at 10 μg ml−1 was used as mitogen control. All responses were compared with IgG1 isotype control with the exception of TGN1412 and natalizumab which were compared with IgG4κ isotype control. Group responses shown are geometric mean followed by 95% confidence interval in brackets. Significant results are shown in bold (repeated measures analysis of log10 transformed data using Dunnett's method and 95% confidence). Donor responses shown (n = 7–16) are from 2–4 independent experiments
| Therapeutic mAb | Aqueous phase TNFα release at: | Solid phase TNFα release at: | ||||
|---|---|---|---|---|---|---|
| 24 h | 48 h | 72 h | 24 h | 48 h | 72 h | |
| IgG1 control | 10.3 pg ml−1 (3.9, 27.0) | 21.0 pg ml−1 (6.5, 68.1) | 137 pg ml−1 (40.1, 466) | 1 005 pg ml−1 (455, 2 222) | 1 232 pg ml−1 (600, 2 527) | 1 196 pg ml−1 (600, 2 383) |
| IgG4 control | 7.4 pg ml−1 (2.4, 22.6) | 26.5 pg ml−1 (8.6, 81.9) | 45.9 pg ml−1 (8.9, 236) | 56.9 pg ml−1 (18.6, 174) | 33.3 pg ml−1 (6.9, 160) | 55.9 pg ml−1 (22.8, 137) |
| Natalizumab | 1.5 pg ml−1 (0.8, 2.9) | 14.6 pg ml−1 (3.3, 64.3) | 123 pg ml−1 (36.6, 415) | 5.9 pg ml−1 (2.1, 16.6) | 2.0 pg ml−1 (0.8, 5.1) | 4.6 pg ml−1 (2.1, 10.1) |
| Adalimumab | 1.7 pg ml−1 (1.1, 2.5) | 1.2 pg ml−1 (0.9, 1.6) | 1.7 pg ml−1 (1.0, 2.9) | 270 pg ml−1 (116, 630) | 340 pg ml−1 (122, 948) | 337 pg ml−1 (126, 899) |
| Infliximab | 1.7 pg ml−1 (1.1, 2.5) | 1.1 pg ml−1 (0.9, 1.5) | 1.1 pg ml−1 (0.9, 1.3) | 64.4 pg ml−1 (33.9, 123) | 82.2 pg ml−1 (35.8, 188) | 94.5 pg ml−1 (43.9, 204) |
| Etanercept | 2.4 pg ml−1 (1.3, 4.4) | 1.8 pg ml−1 (0.9, 3.6) | 1.8 pg ml−1 (1.0, 3.2) | 62.6 pg ml−1 (23.8, 164) | 77.1 pg ml−1 (25.4, 234) | 87.6 pg ml−1 (30.7, 250) |
| Basiliximab | 5.4 pg ml−1 (2.2, 13.4) | 6.8 pg ml−1 (2.6, 17.8) | 61.9 pg ml−1 (24.0, 159) | 939 pg ml−1 (450, 1 956) | 1 090 pg ml−1 (551, 2 157) | 946 pg ml−1 (445, 2 014) |
| Daclizumab | 2.6 pg ml−1 (1.5, 4.6) | 7.8 pg ml−1 (2.3, 26.7) | 86.2 pg ml−1 (31.9, 233) | 1 429 pg ml−1 (673, 3 037) | 1 614 pg ml−1 (788, 3 303) | 1 406 pg ml−1 (666, 2 968) |
| Bevacizumab | 2.9 pg ml−1 (1.5, 5.8) | 11.8 pg ml−1 (4.2, 33.6) | 158 pg ml−1 (63.3, 396) | 2 107 pg ml−1 (935, 4 752) | 2 144 pg ml−1 (1 049, 4 382) | 2 039 pg ml−1 (915, 4 547) |
| Trastuzumab | 3.8 pg ml−1 (1.6, 8.8) | 14.3 pg ml−1 (4.7, 43.9) | 135 pg ml−1 (49.1, 369) | 1 849 pg ml−1 (1 143, 2 989) | 2 100 pg ml−1 (1 320, 3 341) | 1 790 pg ml−1 (1 107, 2 896) |
| Rituximab | 17.4 pg ml−1 (7.4, 41.1) | 35.7 pg ml−1 (10.1, 127) | 104 pg ml−1 (33.7, 318) | 1 531 pg ml−1 (957, 2 450) | 1 680 pg ml−1 (1 057, 2 672) | 1 439 pg ml−1 (917, 2 258) |
| Alemtuzumab | 167 pg ml−1 (119, 234) | 184 pg ml−1 (135, 249) | 272 pg ml−1 (188, 392) | 1 700 pg ml−1 (1 017, 2 842) | 2 114 pg ml−1 (1 301, 3 434) | 1 804 pg ml−1 (1 205, 2 699) |
| Muromonab-CD3 | 1544 pg ml−1 (899, 2650) | 2133 pg ml−1 (1210, 3760) | 1 760 pg ml−1 (1 047, 2 957) | 5 754 pg ml−1 (2 798, 11 831) | 16 099 pg ml−1 (8 656, 29 943) | 17 646 pg ml−1 (11 562, 26 931) |
| TGN1412 | 32.0 pg ml−1 (8.2, 125) | 110 pg ml−1 (30.1, 401) | 134 pg ml−1 (31.2, 579) | 5 685 pg ml−1 (3 920, 8 243) | 17 095 pg ml−1 (10 336, 28 276) | 18 469 pg ml−1 (12 909, 26 425) |
| Mitogen | 3290 pg ml−1 (2272, 4765) | 6215 pg ml−1 (4421, 8738) | 8 267 pg ml−1 (4 261, 16 040) | 2 978 pg ml−1 (2 325, 3 815) | 7 454 pg ml−1 (5 848, 9 501) | 7 587 pg ml−1 (5 885, 9 781) |
Comparable levels of IL-8 release were observed with muromonab-CD3 and TGN1412 in the solid phase assay, but only the latter response was significant (P < 0.0001 at 24, 48 and 72 h). A high level of IL-8 release with IgG1 but not IgG4 control in the solid phase assay accounted for this statistical difference (Table 4). In the aqueous phase assay muromonab-CD3 and alemtuzumab stimulated significant levels of IL-8 release (both P < 0.0001 at 24, 48 and 72 h), but TGN1412 did not at 24 and 48 h (Table 4). The anti-TNFα mAbs adalimumab, infliximab and etanercept all significantly reduced IL-8 concentration at 24 (P = 0.0022, P = 0.0005 and P = 0.0045, respectively), 48 (P = 0.0001, P = 0.0020 and P = 0.0065, respectively) and at 72 h (all P < 0.0001) in the aqueous phase assay, whereas in the solid phase assay only etanercept significantly reduced IL-8 concentration (P < 0.0001 at 24, 48 and 72 h) (Table 4). The anti-α4 integrin mAb natalizumab also decreased IL-8 concentration in the aqueous (P = 0.0013 and P = 0.0163 at 24 and 48 h, respectively) and solid phase assays (P < 0.0001, P = 0.0005 and P = 0.0001 at 24, 48 and 72 h, respectively), compared with IgG4 control (Table 4). Lastly, a decrease in IL-8 levels in the aqueous phase assay, compared with IgG1 control, was noted with daclizumab (P = 0.0008 at 24 h) and bevacizumab (P = 0.0048 at 24 h) (Table 4).
Table 4.
IL-8 release from human PBMC stimulated in vitro for 24, 48 and 72 h with 1 μg well−1 of indicated therapeutic mAbs in aqueous and solid phase. Cytokine release was measured by ELISA. The lectin PHA at 10 μg ml−1 was used as mitogen control. All responses were compared with IgG1 isotype control with the exception of TGN1412 and natalizumab which were compared with IgG4κ isotype control. Group responses shown are geometric mean followed by 95% confidence interval in brackets. Significant results are shown in bold (repeated measures analysis of log10 transformed data using Dunnett's method and 95% confidence). Donor responses shown (n = 7–16) are from 2–4 independent experiments
| Therapeutic mAb | Aqueous phase IL-8 release at: | Solid phase Il-8 release at: | ||||
|---|---|---|---|---|---|---|
| 24 h | 48 h | 72 h | 24 h | 48 h | 72 h | |
| IgG1 control | 275 pg ml−1 (89, 855) | 416 pg ml−1 (129, 1 346) | 724 pg ml−1 (256, 2 045) | 16 862 pg ml−1 (10 974, 25 909) | 25 089 pg ml−1 (15 365, 40 967) | 33 284 pg ml−1 (20 478, 54 100) |
| IgG4 control | 470 pg ml−1 (206, 1 070) | 845 pg ml−1 (489, 1 459) | 502 pg ml−1 (167, 1 511) | 764 pg ml−1 (230, 2 542) | 1 001 pg ml−1 (280, 3 583) | 960 pg ml−1 (341, 2 707) |
| Natalizumab | 66 pg ml−1 (43.4, 99.5) | 245 pg ml−1 (90.8, 658) | 326 pg ml−1 (109, 976) | 107 pg ml−1 (54.3, 211) | 118 pg ml−1 (58.5, 238) | 121 pg ml−1 (65.8, 224) |
| Adalimumab | 59.4 pg ml−1 (40.9, 86.2) | 50.0 pg ml−1 (50.0, 50.0) | 71.2 pg ml−1 (47.4, 107) | 16 061 pg ml−1 (9 049, 28 507) | 24 209 pg ml−1 (11 809, 49 631) | 30 220 pg ml−1 (12 838, 71 133) |
| Infliximab | 50.0 pg ml−1 (50.0, 50.0) | 69.2 pg ml−1 (42.8, 112) | 85.5 pg ml−1 (37.8, 193) | 18 816 pg ml−1 (10 358, 34 180) | 26 130 pg ml−1 (13 012, 52 474) | 30 838 pg ml−1 (15 075, 63 083) |
| Etanercept | 71.3 pg ml−1 (47.1, 108) | 80.6 pg ml−1 (39.5, 164) | 66.0 pg ml−1 (41.9, 104) | 3 495 pg ml−1 (1 655, 7 381) | 4 416 pg ml−1 (1 731, 11 267) | 4 197 pg ml−1 (1 482, 11 886) |
| Basiliximab | 135 pg ml−1 (47.0, 387) | 150 pg ml−1 (64.1, 352) | 785 pg ml−1 (363, 1 702) | 12 231 pg ml−1 (7 793, 19 197) | 18 684 pg ml−1 (11 695, 29 849) | 21 788 pg ml−1 (12 617, 37 627) |
| Daclizumab | 60.3 pg ml−1 (44.7, 81.3) | 193 pg ml−1 (74.1, 500) | 1 336 pg ml−1 (706, 2 530) | 19 556 pg ml−1 (13 764, 27 785) | 29 025 pg ml−1 (18 947, 44 465) | 35 308 pg ml−1 (21 726, 57 380) |
| Bevacizumab | 70.6 pg ml−1 (44.1, 113) | 229 pg ml−1 (86.3, 606) | 1 198 pg ml−1 (518, 2 772) | 28 368 pg ml−1 (20 021, 40 196) | 43 355 pg ml−1 (28 858, 65 137) | 53 843 pg ml−1 (34 771, 83 375) |
| Trastuzumab | 86.2 pg ml−1 (50.9, 146) | 217 pg ml−1 (93.9, 501) | 911 pg ml−1 (405, 2 052) | 14 410 pg ml−1 (4 501, 46 129) | 39 916 pg ml−1 (29 875, 53 332) | 48 426 pg ml−1 (35 804, 65 498) |
| Rituximab | 222 pg ml−1 (72.7, 678) | 523 pg ml−1 (160, 1 708) | 832 pg ml−1 (288, 2 405) | 13 649 pg ml−1 (4 347, 42 852) | 36 294 pg ml−1 (28 656, 45 968) | 41 739 pg ml−1 (30 839, 56 492) |
| Alemtuzumab | 4 551 pg ml−1 (2 264, 9 146) | 6 050 pg ml−1 (3 719, 9 842) | 11 595 pg ml−1 (7 152, 18 799) | 15 276 pg ml−1 (4 689, 49 766) | 40 659 pg ml−1 (30 677, 53 890) | 45 493 pg ml−1 (35 229, 58 747) |
| Muromonab-CD3 | 7 115 pg ml−1 (2 865, 17 671) | 9 231 pg ml−1 (5 839, 14 595) | 11 355 pg ml−1 (8 007, 16 102) | 18 052 pg ml−1 (12 296, 26 504) | 40 426 pg ml−1 (25 755, 63 453) | 54 846 pg ml−1 (34 370, 87 520) |
| TGN1412 | 508 pg ml−1 (165, 1 565) | 1 266 pg ml−1 (409, 3 920) | 1 220 pg ml−1 (394, 3 779) | 14 137 pg ml−1 (9 347, 21 382) | 36 431 pg ml−1 (23 768, 55 842) | 46 037 pg ml−1 (33 392, 63 471) |
| Mitogen | 25 720 pg ml−1 (10 267, 64 431) | 65 723 pg ml−1 (29 621, 145 827) | 80 929 pg ml−1 (37 229, 175 925) | 20 577 pg ml−1 (10 110, 41 879) | 103 293 pg ml−1 (61 336, 173 949) | 107 001 pg ml−1 (72 335, 158 280) |
Only muromonab-CD3 and TGN1412 stimulated significant IL-17 release (all P < 0.0001 at 24, 48 and 72 h) in the solid phase assay, at levels comparable with mitogen, and only muromonab-CD3 stimulated significant IL-17 release in the aqueous phase assay (P < 0.0001 at 24, 48 and 72 h) (Table 5). In contrast to other therapeutic mAbs evaluated, only muromonab-CD3 and TGN1412 stimulated in the solid phase assay a cytokine profile consistent with a mitogen response. The major difference between these two therapeutic mAbs was the ability of TGN1412 to stimulate 28.4 (18.6–43.8) fold more IL-2 release than muromonab-CD3 in the solid phase assay, after 24 h.
Table 5.
IL-17 release from human PBMC stimulated in vitro for 24, 48 and 72 h with 1 μg well−1 of indicated therapeutic mAbs in aqueous and solid phase. Cytokine release was measured by ELISA. The lectin PHA at 10 μg ml−1 was used as mitogen control. All responses were compared with IgG1 isotype control with the exception of TGN1412 and natalizumab which were compared with IgG4κ isotype control. Group responses shown are geometric mean followed by 95% confidence interval in brackets. Significant results are shown in bold (repeated measures analysis of log10 transformed data using Dunnett's method and 95% confidence). Donor responses shown (n = 7–16) are from 2–4 independent experiments
| Therapeutic mAb | Aqueous phase IL-17 release at: | Solid phase IL-17 release at: | ||||
|---|---|---|---|---|---|---|
| 24 h | 48 h | 72 h | 24 h | 48 h | 72 h | |
| IgG1 control | 1.7 pg ml−1 (0.79, 3.9) | 3.3 pg ml−1 (0.9, 11.9) | 4.5 pg ml−1 (2.2, 9.3) | 1.5 pg ml−1 (0.8, 2.6) | 1.0 pg ml−1 (1.0, 1.0) | 1.0 pg ml−1 (1.0, 1.0) |
| IgG4 control | 1.0 pg ml−1 (1.0, 1.0) | 1.0 pg ml−1 (1.0, 1.0) | 1.2 pg ml−1 (0.8, 2.0) | 1.0 pg ml−1 (1.0, 1.0) | 1.0 pg ml−1 (1.0, 1.0) | 1.0 pg ml−1 (1.0, 1.0) |
| Natalizumab | 1.0 pg ml−1 (1.0, 1.0) | 1.0 pg ml−1 (1.0, 1.0) | 1.0 pg ml−1 (1.0, 1.0) | 1.1 pg ml−1 (0.9, 1.2) | 1.0 pg ml−1 (1.0, 1.0) | 1.6 pg ml−1 (0.7, 3.7) |
| Adalimumab | 2.0 pg ml−1 (1.1, 3.7) | 7.9 pg ml−1 (4.9, 12.7) | 1.8 pg ml−1 (0.9, 3.5) | 1.4 pg ml−1 (0.6, 2.9) | 1.3 pg ml−1 (0.7, 2.4) | 2.5 pg ml−1 (0.9, 7.2) |
| Infliximab | 1.5 pg ml−1 (0.8, 2.8) | 3.4 pg ml−1 (1.4, 7.8) | 2.7 pg ml−1 (0.6, 11.8) | 1.0 pg ml−1 (1.0, 1.0) | 1.0 pg ml−1 (1.0, 1.0) | 1.4 pg ml−1 (0.8, 2.4) |
| Etanercept | 1.4 pg ml−1 (0.8, 2.5) | 2.9 pg ml−1 (1.4, 5.8) | 3.3 pg ml−1 (1.2, 9.7) | 1.9 pg ml−1 (0.7, 5.3) | 1.0 pg ml−1 (1.0, 1.0) | 2.9 pg ml−1 (0.5, 15.3) |
| Basiliximab | 4.2 pg ml−1 (1.8, 10.2) | 1.9 pg ml−1 (1.0, 3.7) | 2.6 pg ml−1 (1.0, 6.7) | 1.8 pg ml−1 (0.7, 4.1) | 1.0 pg ml−1 (1.0, 1.0) | 1.0 pg ml−1 (1.0, 1.0) |
| Daclizumab | 1.2 pg ml−1 (0.8, 2.0) | 5.4 pg ml−1 (2.2, 13.2) | 1.5 pg ml−1 (0.8, 2.9) | 1.3 pg ml−1 (0.7, 2.1) | 1.0 pg ml−1 (1.0, 1.0) | 1.5 pg ml−1 (0.8, 2.9) |
| Bevacizumab | 1.9 pg ml−1 (1.0, 3.9) | 7.0 pg ml−1 (2.4, 20.4) | 4.0 pg ml−1 (1.2, 13.1) | 1.3 pg ml−1 (0.8, 2.1) | 1.0 pg ml−1 (1.0, 1.0) | 1.0 pg ml−1 (1.0, 1.1) |
| Trastuzumab | 1.5 pg ml−1 (0.7, 3.3) | 4.8 pg ml−1 (2.6, 8.9) | 5.5 pg ml−1 (2.1, 14.5) | 1.6 pg ml−1 (0.8, 3.4) | 1.0 pg ml−1 (1.0, 1.0) | 1.1 pg ml−1 (0.9, 1.5) |
| Rituximab | 2.7 pg ml−1 (1.2, 6.1) | 1.5 pg ml−1 (0.7, 3.0) | 4.4 pg ml−1 (2.0, 9.8) | 1.3 pg ml−1 (0.7, 2.2) | 1.0 pg ml−1 (1.0, 1.0) | 1.1 pg ml−1 (0.9, 1.4) |
| Alemtuzumab | 2.1 pg ml−1 (0.9, 4.9) | 1.0 pg ml−1 (0.6, 1.8) | 1.7 pg ml−1 (1.0, 3.1) | 1.7 pg ml−1 (0.8, 3.8) | 1.0 pg ml−1 (1.0, 1.0) | 1.4 pg ml−1 (0.8, 2.5) |
| Muromonab-CD3 | 63.1 pg ml−1 (34.1, 117) | 183 pg ml−1 (82.3, 406) | 244 pg ml−1 (114, 525) | 154 pg ml−1 (66.5, 356) | 1338 pg ml−1 (566, 3164) | 4851 pg ml−1 (2807, 8384) |
| TGN1412 | 1.0 pg ml−1 (1.0, 1.0) | 3.4 pg ml−1 (0.8, 14.1) | 3.1 pg ml−1 (0.8, 11.7) | 98.1 pg ml−1 (38.5, 250) | 1540 pg ml−1 (920, 2577) | 4733 pg ml−1 (3385, 6618) |
| Mitogen | 48.5 pg ml−1 (22.2, 106) | 303 pg ml−1 (171, 536) | 529 pg ml−1 (275, 1020) | 127 pg ml−1 (71.8, 225) | 450 pg ml−1 (238, 850) | 596 pg ml−1 (389, 912) |
TGN1412 and muromonab-CD3 stimulate Th1, Th2, Th17 and Th22 cytokine release
Since the pattern of cytokine release stimulated by TGN1412 and muromonab-CD3 in the solid phase assay was consistent with a CD4+ Th1 (IFNγ) and Th17 (IL-17) response, a wider panel of cytokines was measured to determine if other T helper cell subsets were involved. Using a Th1/Th2 multiplex assay muromonab-CD3 and TGN1412 were found to stimulate significant (all P < 0.0001) IFNγ, IL-1β, IL-2, IL-4, IL-5,IL-8, IL-10, IL-12, IL-13 and TNFα release after 72 h (Table 6). In contrast, rituximab and alemtuzumab did not stimulate significant release of IFNγ, IL-2, IL-5, IL-10, IL-12 or IL-13 (Table 6). Multiplex analysis of IFNγ and IL-2 release, with muromonab-CD3 and TGN1412, was comparable with ELISA data generated using different donors. Interestingly, muromonab-CD3 stimulated significantly more IL-1β (P = 0.0073) and IL-10 (P < 0.0001) release than TGN1412 (Table 6). To determine if TGN1412 stimulated CD4+ Th22 or regulatory T-cells (Tregs), IL-22 and TGFβ release were measured by ELISA after 72 h (Table 6). Muromonab-CD3 and TGN1412 stimulated significant (both P < 0.0001) IL-22 release in the solid phase assay (Table 6). TGN1412 stimulated significant TGFβ release (P < 0.0001) compared with IgG4 control, but the level was equivalent to that obtained with IgG1 control, rituximab and muromonab-CD3 (Table 6).
Table 6.
Cytokine release from human PBMC stimulated in vitro for 72 h in a solid phase assay with 1 μg well−1 of indicated therapeutic mAbs. Th1/Th2 7 and 10-Plex MSD® kits was used to measure IFNγ, TNFα, IL-1β, IL-2, IL-4, IL-5, IL-8, IL-10, IL-12 and IL-13 release. Cytokine ELISA was used to measure IL-22 and TGFβ release. The lectin PHA 10 μgml−1 was used as mitogen control. All responses were compared with IgG1 isotype control with the exception of TGN1412 which was compared with IgG4κ isotype control. Group responses shown are geometric mean followed by 95% confidence interval in brackets. Significant results are shown in bold (repeated measures analysis of log10 transformed data using Dunnett's method and 95% confidence). Donor responses shown (n = 7–16) are from 2–4 independent experiments
| Therapeutic mAb | IFNγ | TNFα | IL-1β | IL-2 | IL-4 | IL-5 |
|---|---|---|---|---|---|---|
| IgG1 control | 59.4 pg ml−1 (35.2, 100) | 726 pg ml−1 (494, 1066) | 30.9 pg ml−1 (20.0, 47.9) | 41.8 pg ml−1 (34.1, 51.1) | 9.8 pg ml−1 (8.8, 10.9) | 11.4 pg ml−1 (10.5, 12.3) |
| IgG4 control | 3.1 pg ml−1 (2.6, 3.6) | 25.4 pg ml−1 (16.3, 39.7) | 1.9 pg ml−1 (1.2, 3.2) | 9.5 pg ml−1 (7.2, 12.5) | 3.4 pg ml−1 (2.8, 4.0) | 3.7 pg ml−1 (2.2, 6.2) |
| Rituximab | 75.3 pg ml−1 (26.7, 212) | n.d. | n.d. | 33.3 pg ml−1 (26.5, 41.9) | 9.7 pg ml−1 (7.9, 11.8) | 11.5 pg ml−1 (9.7, 13.6) |
| Alemtuzumab | 88.8 pg ml−1 (43.3, 182) | 1972 pg ml−1 (1097, 3547) | 107 pg ml−1 (41.0, 280) | 41.7 pg ml−1 (35.2, 49.5) | 13.8 pg ml−1 (10.8, 17.7) | 14.6 pg ml−1 (11.6, 18.3) |
| Muromonab-CD3 | 18 013 pg ml−1 (13 598, 23 861) | 9855 pg ml−1 (7939, 12235) | 392 pg ml−1 (166, 926) | 2781 pg ml−1 (1453, 5325) | 41.0 pg ml−1 (31.1, 54.2) | 498 pg ml−1 (146, 1693) |
| TGN1412 | 30 748 pg ml−1 (20 767, 45 527) | 11314 pg ml−1 (10123, 12644) | 148 pg ml−1 (103, 212) | 8600 pg ml−1 (5229, 14144) | 54.0 pg ml−1 (46.6, 62.6) | 1904 pg ml−1 (1450, 2502) |
| Mitogen | 19 491 pg ml−1 (16 164, 23 503) | 6322 pg ml−1 (4953, 8070) | 289 pg ml−1 (194, 431) | 113 pg ml−1 (51.2, 247) | 35.9 pg ml−1 (29.4, 43.9) | 225 pg ml−1 (109, 465) |
| IL-8 | IL-10 | IL-12 | IL-13 | IL-22 | TGFβ | |
|---|---|---|---|---|---|---|
| IgG1 Control | 14 916 pg ml−1 (14 394, 15 457) | 28.8 pg ml−1 (25.8, 32.1) | 12.3 pg ml−1 (11.3, 13.4) | 16.0 pg ml−1 (12.9, 20.0) | 30.6 pg ml−1 (4.3, 219) | 1177 pg ml−1 (899, 1541) |
| IgG4 Control | 1 413 pg ml−1 (825, 2 423) | 11.1 pg ml−1 (8.3, 14.9) | 3.9 pg ml−1 (3.2, 4.7) | 2.4 pg ml−1 (1.8, 3.3) | 19.8 pg ml−1 (2.9, 132) | 715 pg ml−1 (560, 911) |
| Rituximab | n.d. | 26.7 pg ml−1 (21.0, 33.9) | 13.0 pg ml−1 (10.8, 15.6) | 17.8 pg ml−1 (12.5, 25.4) | 46.7 pg ml−1 (8.6, 254) | 1139 pg ml−1 (936, 1386) |
| Alemtuzumab | 15 218 pg ml−1 (14 482, 15 991) | 38.8 pg ml−1 (31.3, 48.0) | 17.5 pg ml−1 (13.3, 23.0) | 22.4 pg ml−1 (16.3, 30.9) | 37.0 pg ml−1 (6.5, 211) | 856 pg ml−1 (702, 1044) |
| Muromonab-CD3 | 15 445 pg ml−1 (14 604, 16 336) | 1060 pg ml−1 (695, 1616) | 35.1 pg ml−1 (25.6, 48.1) | 562 pg ml−1 (221, 1432) | 2870 pg ml−1 (1585, 5197) | 1036 pg ml−1 (840, 1277) |
| TGN1412 | 16 158 pg ml−1 (15 237, 17 134) | 240 pg ml−1 (166, 348) | 47.9 pg ml−1 (36.6, 62.7) | 1235 pg ml−1 (930, 1642) | 4743 pg ml−1 (2747, 8188) | 1050 pg ml−1 (743, 1484) |
| Mitogen | 15 132 pg ml−1 (14 741, 15 534) | 331 pg ml−1 (252, 435) | 44.3 pg ml−1 (30.6, 64.2) | 467 pg ml−1 (319, 683) | 872 pg ml−1 (522, 1457) | 1193 pg ml−1 (803, 1774) |
TGN1412 and muromonab-CD3 stimulate T-cell mediated cytokine release
Since TGN1412 and Muromonab-CD3 stimulated a similar pattern of cytokine release, then it could be hypothesized that both stimulate the same cellular subsets. To test this premise, we examined the cellular sources of IL-2, IFNγ and IL-17 release after overnight stimulation with therapeutic mAbs. Both TGN1412 and muromonab-CD3 stimulated cytokine release from CD4+ T-cells (Figure 2A). Muromonab-CD3 stimulated CD4+ T-cell cytokine release comparable with mitogen (data not shown). However, TGN1412 stimulated significantly more CD4+ T-cells that produced IL-2 (P = 0.0001), IL-17 (P = 0.0008) and IFNγ (P = 0.0309) compared with muromonab-CD3 (Figure 2A). Moreover, stimulation of 28.4 ± 5.04 fold more IL-2 producing CD4+ T-cells by TGN1412 compared with muromonab-CD3 matches the magnitude difference in IL-2 release. Alemtuzumab did not stimulate CD4+ T-cell cytokine release (Figure 2A). Neither did adalimumab, infliximab, etanercept, basiliximab, daclizumab, bevacizumab, trastuzumab or rituximab (data not shown). Alemtuzumab and muromonab-CD3 stimulated significantly more CD4− cells that produced IFNγ (P = 0.0014 and P = 0.0115, respectively), compared with TGN1412 (Figure 2A). These CD4− cells were mostly CD3− NK cells with some CD3+CD8+ T-cells, and reflected an NK cell pattern of cytokine release with alemtuzumab, muromonab-CD3 and rituximab (data not shown). Comparison of IFNγ vs. IL-17 producing CD4+ T-cells confirmed that these are separate populations corresponding to TH1 and TH17 cell subsets, respectively (Figure 2B). Muromonab-CD3 stimulated TH1 and TH17 cells that characteristically produced either IFNγ or IL-17, respectively (Figure 2C), whereas TGN1412 stimulated TH1 and TH17 cells that co-release IL-2, yielding a different pattern of CD4+ T-cell mediated cytokine release (Figure 2C). This same pattern of IL-2 co-production with TGN1412 was observed with IL-13 (Th2) and IL-22 (Th22) producing cells (data not shown). In addition, a large proportion of TGN1412 stimulated CD4+ T-cells appeared to produce only IL-2 (Figure 2C).
Figure 2.
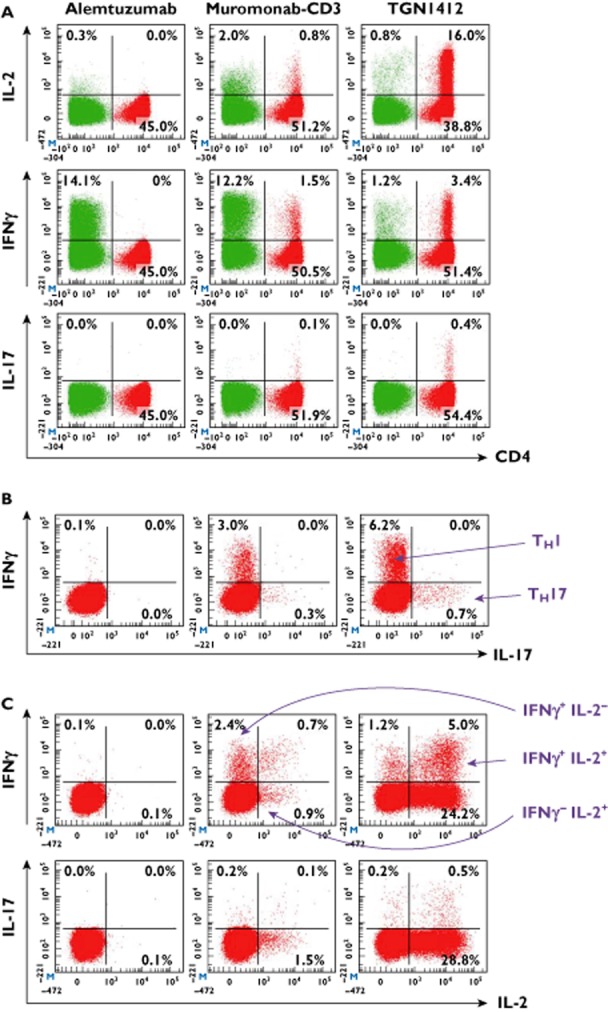
Intracellular cytokine staining of human PBMC stimulated for 24 h with 1 μg well−1 alemtuzumab, muromonab-CD3 and TGN1412 in a solid phase assay. CD4+ cells are shown in red and CD4− cells in green. (A) shows CD4 vs. IL-2, IFNγ and IL-17, (B) shows IFNγ vs. IL-17 gated on CD4+ cells and (C) shows IL-2 vs. IFNγ and IL-17 gated on CD4+ cells. Th1 cells are IFNγ+ and Th17 are IL-17+. TGN 1412 stimulates cytokine release from CD4+ cells, muromonab-CD3 from CD4+ and CD4− cells and alemtuzumab from CD4− cells. Data from one representative donor are shown. For comparison, the mitogen response of eight donors was 3.4 ± 0.79% CD4+IL-2+, 0.44 ± 0.06% CD4+IFNγ+ and 0.03 ± 0.01% CD4+IL-17+ (not shown).  , CD4+;
  , CD4−
TGN1412 and muromonab–CD3 expand CD4+CD25+FoxP3+ T-cells
In rodent models, treatment with CD28 super-agonists, orthologous to TGN1412, stimulated the release of anti-inflammatory cytokines and the expansion of CD4+ Tregs believed to counter autoimmune responses 15–17. To determine if TGN1412 specifically expands human CD4+ Tregs in the solid phase assay we assessed the proportion of CD4+CD25+FoxP3+ cells. Stimulation of human PBMC with TGN1412 and muromonab-CD3 for 24 and 72 h significantly (all P < 0.0001) increased the proportion of CD4+CD25+FoxP3+ cells compared with isotype controls (Figure 3).
Figure 3.
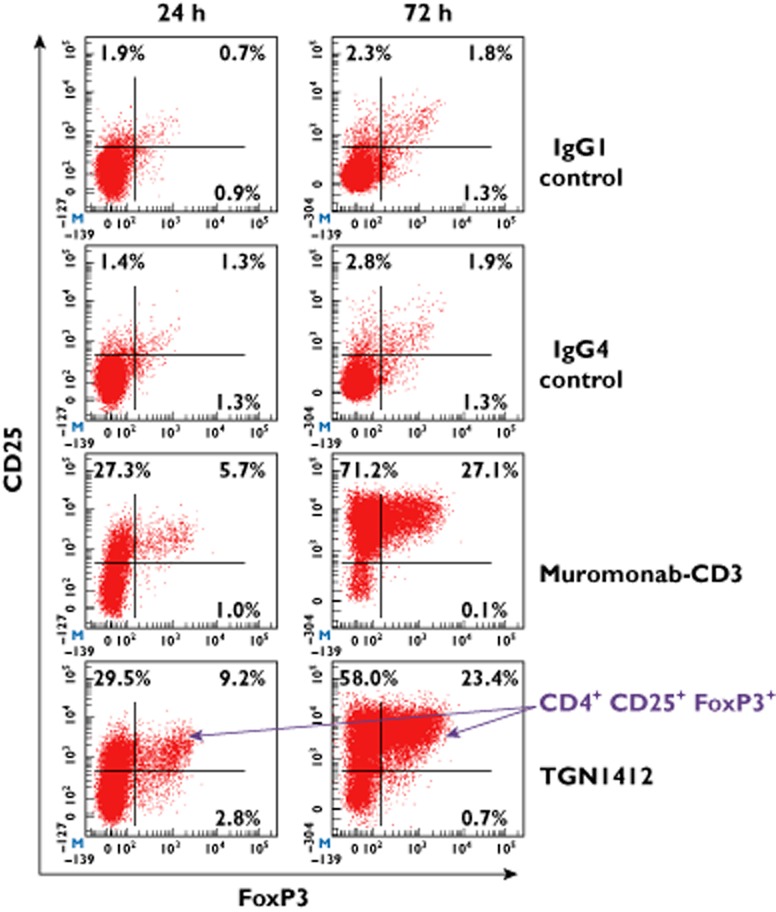
Intranuclear and surface staining of human PBMC stimulated for 24 and 72 h with 1 μg well−1 muromonab-CD3, TGN1412, IgG1 and IgG4κ isotype controls in a solid phase assay. CD3+CD4+ T-cells are shown in red. Events in the right hand quadrants are positive for FoxP3 and events in the upper quadrants are positive for CD25. T-cells with the regulatory phenotype CD4+CD25+FoxP3+ are increased following stimulation with muromonab-CD3 (8.4 ± 1.5% and 20.7 ± 1.7% at 24 and 72 h, respectively) and TGN1412 (11.3 ± 1.9% and 15.6 ± 1.6% at 24 and 72 h, respectively), compared with isotype controls. Data from one representative donor are shown.  , CD3+ CD4+
Discussion
Correctly predicting the cytokine releasing properties of new therapeutic mAbs is a major safety concern recently emphasized by the ‘cytokine storm’ and near fatalities of volunteers administered TGN1412 in a first-in-man phase 1 clinical trial 2. Cytokine release syndrome (CRS) is associated with a number of therapeutic mAbs and carries a high morbidity and fatality rate 18–21. For example, severe CRS occurs in approximately 50% of recipients administered muromonab-CD3, to treat renal allograft rejection, if not pre-treated with high dose corticosteroids 22, 23. Moderate to severe CRS is associated with the use of alemtuzumab, for the treatment of B-cell chronic lymphocytic leukaemia and rituximab, for the treatment of haematological neoplasms and lymphomas, in a minority of patients 21, 24–26. Yet many therapeutic mAbs such as bevacizumab, used for the treatment of metastatic cancers, and infliximab, used to treat Crohn's disease and rheumatoid arthritis, are not associated with CRS 10. Currently, no fully validated in vitro assay that can predict CRS associated with the use of novel therapeutic mAbs exists 20. Ideally, in terms of predicting the safety of novel therapeutic mAbs in man, a cytokine release assay (CRA) should rank bevacizumab and infliximab > alemtuzumab and rituximab > muromonab-CD3 > TGN1412. New solid phase cytokine release assays are now being widely applied to the pre-clinical safety testing of therapeutic mAbs in order to prevent a re-occurrence of the TGN1412 trial failure, but little comparative data exist to demonstrate the predictive value of this new approach for determining the safety or potential CRS severity when applied to other therapeutic mAbs 27, 28.
The solid phase assay carried out using PBMC is predictive of CRS severity associated with the use of TGN1412 and muromonab-CD3. Similar levels of TNFα, IFNγ, IL-8 and IL-17 release were obtained with both of these therapeutic mAbs, but IL-2 release was 28.4-fold greater with TGN1412. A similar order of magnitude difference is mirrored in renal allograft patients who are not pre-treated with high dose corticosteroids and whose serum concentrations of IL-2 peak at around 400 pg ml−1 after muromonab-CD3 administration 23, compared with >4000 pg ml−1 in TGN1412 trial volunteers 2. This difference implies that massive IL-2 release was the driving force responsible for CRS severity associated with TGN1412 compared with muromonab-CD3. It should be noted that CRS associated with muromonab-CD3 is self-limiting due to depletion of CD3+ T-cells by this therapeutic mAb, whereas TGN1412 does not cause lysis of CD28+ T-cells, so would not be self-limiting. The cytokine profile obtained with both TGN1412 and muromonab-CD3 is consistent with a T-cell mediated response which is different from that observed with other therapeutic mAbs tested here which do not induce this type of cytokine release. With the exception of IL-8, the level of cytokine release with TGN1412 and muromonab-CD3 was markedly higher compared with other therapeutic mAbs, consistent with CRS severity associated with these therapeutic mAbs.
A statistical difference in cytokine release was observed between therapeutic mAbs known to cause CRS and those that do not. Therefore, a similar statistical difference in cytokine release with a candidate mAb is likely to indicate the potential to cause CRS. In the case of TGN1412, where the magnitude of cytokine release was greater than mitogen control, the potential to cause CRS is evident and can be used to define clear criteria: a level of cytokine release similar to TGN1412 or muromonab-CD3 is likely to cause CRS. However, this is at one end of the CRS scale which covers a continuous range of responses whereas at the lower end only a small proportion of patients may experience low to moderate CRS. In such cases observed increases in cytokine release may not always be statistically significant, but this does not exclude the possibility of causing CRS, e.g. alemtuzumab and rituximab.
In contrast to TGN1412 and muromonab-CD3, the solid phase assay was not predictive of moderate to severe CRS associated with alemtuzumab and rituximab compared with non-CRS associated bevacizumab and infliximab and the IgG1 isotype control. Comparable levels of IFNγ, TNFα and IL-8 release observed with these therapeutic mAbs did not permit ranking of responses. Exceptions included the anti-TNFα therapeutic mAbs infliximab, adalimumab and the fusion protein etanercept, which reduced TNFα release in both the solid and aqueous phase assays, probably by binding to this cytokine and preventing measurement, and natalizumab which suppressed TNFα and IL-8 release in the solid phase assay compared with the IgG4κ isotype control. Reduced IL-8 release was likely secondary to reduced TNFα release which regulates IL-8 release 29.
Increased levels of IFNγ, TNFα and IL-8 release in the solid phase compared with aqueous phase assay with the IgG1 isotype control, alemtuzumab, rituximab, trastuzumab, bevacizumab, daclizumab, basiliximab, etanercept, infliximab and adalimumab, but not TGN1412, muromonab-CD3 or natalizumab is likely to be non-specific. Random orientation of immobilized mAb such that both the fragment crystallisable region (Fc) and fragment antigen-binding region (Fab) are presented at high density to lymphocytes is the likely culprit. This mechanism of cytokine release would likely involve engagement of CD16 (FcgammaRIII) on NK cells by the Fc component of immobilized therapeutic mAbs 25. This conclusion is supported by low levels of cytokine release with the IgG4κ isotype control, which has low affinity for Fc receptors and is therefore less likely to stimulate NK cells 30. Moreover, the reason that IL-2 and IL-17 release is not observed with either alemtuzumab, rituximab, bevacizumab, infliximab or the IgG1 isotype control is that NK cells do not produce these cytokines. To exclude the contribution of the Fc component in a solid phase assay, it may be necessary to orientate therapeutic mAbs such that only the Fab component is presented to PBMC, for example by using Fc-capture antibody for immobilization 5. Therapeutic mAb Fc-receptor interaction induces a mechanism of cytokine release that is different from that stimulated by TGN1412, which is Fab-mediated, and which in vivo is likely a function of target antigen and cell density.
The cytokine response to TGN1412 in the trial volunteers occurred rapidly, within 4 h, and we have previously shown that the cytokine response in vitro occurs with the same rapid kinetics by intracellular cytokine staining and cytokine PCR 5. However, in vitro assays utilize peripheral blood lymphocytes that contain few CD4+ effector memory T-cells, previously identified as the source of most of the pro-inflammatory cytokine release triggered by TGN1412 5. In contrast, CD4+ effector memory T-cells are found in high numbers in mucosal and lymphoid tissues within the body which likely accounted for the rapid release of high levels of cytokines in the trial volunteers. For in vitro studies, 24 h incubation was utilized to allow the low numbers of CD4+ effectors present in peripheral blood lymphocytes to release levels of cytokines consistent with in vivo responses. A 72 h incubation was required for certain cytokines such as IFNγ to reach levels seen in the trial volunteers due to the time required for peripheral blood lymphocytes to differentiate into effector memory T-cells capable of producing this cytokine.
The aqueous phase assay appears more predictive of the severity of non T-cell mediated CRS, where the target cell is present in blood, as is the case with alemtuzumab that targets lymphocytes and rituximab that targets B-cells. Significant increases in TNFα and IL-8 release with alemtuzumab and non-significant increases in these cytokines with rituximab hint at potential CRS severity ranking, when compared with muromonab-CD3. Significant increases in IL-2 concentration with basiliximab and daclizumab, which target the IL-2 receptor (CD25), were likely due to autocrine or paracrine accumulation caused by receptor blockade. Muromonab-CD3 produced an unequivocal cytokine response using the aqueous phase assay that was remarkably similar in magnitude to the solid phase assay response at 24 h. Thereafter, IL-2 release with muromonab-CD3 declined in the aqueous phase assay as this cytokine is only transiently produced after T-cell activation and consumed by proliferating T-cells. In the solid phase assay, IL-2 release stimulated by muromonab-CD3 peaked later at 48 h, probably amplifying other cytokine release over time due to IL-2 driven T-cell proliferation, but declined by 72 h indicating T-cell unresponsiveness. However, with TGN1412, IL-2 release and T-cell proliferation continued unabated over 72 h. Normally, IL-2 differentially regulates its own receptors, so continued T-cell proliferation and prevention of T-cell unresponsiveness by TGN1412 in the solid phase assay is not normal and may have been a consequence of prolonged expression of the IL-2Rα and β-chains, up-regulated by CD28 co-stimulation 31.
The ability of TGN1412 to stimulate 28.4 fold more IL-2 release than muromonab-CD3 correlates with its ability to stimulate 28.4 times more CD4+ T-cells to produce this cytokine, after 24 h. However, a higher percentage of CD4+ T-cells producing IFNγ and IL-17 with TGN1412 compared with muromonab-CD3 was not so clearly reflected in ELISA data, but those differences were small in comparison with IL-2. Furthermore, muromonab-CD3 also stimulated an NK cell mediated mechanism of cytokine release similar to alemtuzumab, which may have masked differences in IFNγ release by CD4+ T-cells. Since muromonab-CD3 stimulates both T-cell and NK cell mediated cytokine release it could be expected to stimulate more cytokine release than TGN1412, which only stimulates CD4+ T-cells. However this was not the case, highlighting the significant role that IL-2 release likely played in amplifying cytokine release stimulated by TGN1412. IL-2 is a T-cell growth factor produced during the primary immune response which declines upon differentiation to be replaced by Th1-like (promotes cellular immunity), Th2-like (promotes humoral immunity), Th17-like (implicated in autoimmune disease) and Th22 (implicated in inflammatory skin disease) cytokines 32, 33. This is consistent with the cytokine profile observed with muromonab-CD3 in the aqueous phase assay where IL-2 release declines after 24 h, but in the solid phase assay IL-2 production continues to increase. In the case of TGN1412, a short circuit of the immune system, possibly due to prolonged activation of IL-2 transcription via super-agonistic CD28 stimulation may have caused continued IL-2 release 34.
TGN1412 and muromonab-CD3 produce high levels of IFNγ consistent with a Th1 response, IL-4, IL-5, IL-10 and IL-13 consistent with a Th2 response, IL-17 consistent with a Th17 response and IL-22 consistent with a Th22 response. This T-cell specific cytokine response was not observed with rituximab, alemtuzumab, bevacizumab, infliximab and the IgG1 isotype control, expanding the list of TGN1412 and muromonab-CD3 specific biomarkers. The CD4+ Tregs subset is responsible for maintaining peripheral tolerance and homeostasis 35, and the development of TGN1412 was based on pre-clinical findings in rodent models where CD28 super-agonists had been successfully used to expand the Treg compartment and suppress autoimmune and inflammatory disease models 1, 15–17. These CD4+ regulatory T-cells can be divided into natural Tregs (nTregs) that develop in the thymus and inducible Tregs (iTregs) generated in the periphery 36. The iTregs subset includes Tr1 cells that produce IL-10 and T helper 3 cells (Th3) that produce TGFβ. Since TGN1412 did not stimulate more TGFβ release than other therapeutic mAbs, then a major role for a Th3 response is unlikely, but TGN1412 did stimulate significant IL-10 release consistent with a Tr1 response. However, IL-10 release is also consistent with a Th2 response and muromonab-CD3 stimulates greater IL-10 release than TGN1412, making an expansion of Tr1 cells unlikely. A feature of nTregs is expression of high levels of the IL-2 receptor (CD25) and the forkhead box P3 (FoxP3) transcription factor essential for their function, although non-regulatory T-cells can transiently express FoxP3 when activated 35, 37 and CD25 is a CD4+ T-cell activation marker 38. Stimulation of PBMC with TGN1412 in the solid phase assay led to a prolonged expansion of CD4+CD25+FoxP3+ T-cells that could be interpreted as expansion of nTregs, if it were not for a similar expansion caused by muromonab-CD3. Moreover, stimulation with immobilized CD3 mAb is known to increase FoxP3 expression that is strongly associated with hypo-responsiveness by activated CD4+ T-cells and is not directly correlated with suppressive capability 37. It is, therefore, likely that this is also the case with TGN1412 in the solid phase assay since both TGN1412 and muromonab-CD3 stimulate a similar cytokine response.
A complicated picture is emerging in which multiple mechanisms of cytokine release involving NK cells, T-cells, combinations of both and subsets of these cells can be involved in CRS associated with the use of therapeutic mAbs. Furthermore, it may not be possible to evaluate all these possibilities with a single cytokine release assay. Co-culture assays that can better replicate physiological presentation may be the way forward but these are technically demanding and so far only partially replicate cytokine responses to TGN1412 9. Nevertheless, a greater understanding of the mechanisms of cytokine release that therapeutic mAbs can stimulate can only aid in future prediction of potential CRS in man.
Competing Interests
There are no competing interests to declare. The authors are alone responsible for the content and writing of this paper.
This work was supported by National Institute for Health Research Funding.
This material is reproduced by permission of the Medicines and Healthcare products Regulatory Agency MHRA.
References
- 1.Hünig T. Manipulation of regulatory T-cell number and function with CD28-specific monoclonal antibodies. Adv Immunol. 2007;95:111–148. doi: 10.1016/S0065-2776(07)95004-X. [DOI] [PubMed] [Google Scholar]
- 2.Suntharalingam G, Perry MR, Ward S, Brett SJ, Castello-Cortes A, Brunner MD, Panoskaltsis N. Cytokine storm in a phase 1 trial of the anti-CD28 monoclonal antibody TGN1412. N Engl J Med. 2006;355:1018–1028. doi: 10.1056/NEJMoa063842. [DOI] [PubMed] [Google Scholar]
- 3.Duff GW. Expert Group on Phase One Clinical Trials: Final Report. London: The Stationery Office; 2006. (Chairman) [Google Scholar]
- 4.Stebbings R, Findlay L, Edwards C, Eastwood D, Bird C, North D, Mistry Y, Dilger P, Liefooghe E, Cludts I, Fox B, Tarrant G, Robinson J, Meager T, Dolman C, Thorpe SJ, Bristow A, Wadhwa M, Thorpe R, Poole S. ‘Cytokine storm’ in the phase I trial of monoclonal antibody TGN1412: better understanding the causes to improve preclinical testing of immunotherapeutics. J Immunol. 2007;179:3325–3331. doi: 10.4049/jimmunol.179.5.3325. [DOI] [PubMed] [Google Scholar]
- 5.Eastwood D, Findlay L, Poole S, Bird C, Wadhwa M, Moore M, Burns C, Thorpe R, Stebbings R. Monoclonal antibody TGN1412 trial failure explained by species differences in CD28 expression on CD4+ effector memory T-cells. Br J Pharmacol. 2010;161:512–526. doi: 10.1111/j.1476-5381.2010.00922.x. [DOI] [PMC free article] [PubMed] [Google Scholar]
- 6.Dustin ML, Olszowy MW, Holdorf AD, Li J, Bromley S, Desai N, Widder P, Rosenberger F, van der Merwe PA, Allen PM, Shaw AS. A novel adaptor protein orchestrates receptor patterning and cytoskeletal polarity in T-cell contacts. Cell. 1998;94:667–677. doi: 10.1016/s0092-8674(00)81608-6. [DOI] [PubMed] [Google Scholar]
- 7.Sanchez-Lockhart M, Miller J. Engagement of CD28 outside of the immunological synapse results in up-regulation of IL-2 mRNA stability but not IL-2 transcription. J Immunol. 2006;176:4778–4784. doi: 10.4049/jimmunol.176.8.4778. [DOI] [PubMed] [Google Scholar]
- 8.Thoulouze MI, Sol-Foulon N, Blanchet F, Dautry-Varsat A, Schwartz O, Alcover A. Human immunodeficiency virus type-1 infection impairs the formation of the immunological synapse. Immunity. 2006;24:547–561. doi: 10.1016/j.immuni.2006.02.016. [DOI] [PubMed] [Google Scholar]
- 9.Findlay L, Sharp G, Fox B, Ball C, Robinson CJ, Bird C, Stebbings R, Eastwood D, Wadhwa M, Poole S, Thorpe R, Thorpe SJ. Endothelial cells co-stimulate peripheral blood mononuclear cell responses to monoclonal antibody TGN1412 in culture. Cytokine. 2011;55:141–151. doi: 10.1016/j.cyto.2011.03.019. [DOI] [PubMed] [Google Scholar]
- 10.Dhir V, Fort M, Mahmood A, Higbee R, Warren W, Narayanan P, Wittman V. A predictive biomimetic model of cytokine release induced by TGN1412 and other therapeutic monoclonal antibodies. J Immunotoxicol. 2012;9:34–42. doi: 10.3109/1547691X.2011.613419. [DOI] [PubMed] [Google Scholar]
- 11.Weissmüller S, Semmler LY, Kalinke U, Christians S, Müller-Berghaus J, Waibler Z. ICOS-LICOS interaction is critically involved in TGN1412-mediated T-cell activation. Blood. 2012;119:6268–6277. doi: 10.1182/blood-2011-12-401083. [DOI] [PubMed] [Google Scholar]
- 12.Römer PS, Berr S, Avota E, Na SY, Battaglia M, ten Berge I, Einsele H, Hünig T. Preculture of PBMCs at high cell density increases sensitivity of T-cell responses, revealing cytokine release by CD28 super-agonist TGN1412. Blood. 2011;118:6772–6782. doi: 10.1182/blood-2010-12-319780. [DOI] [PubMed] [Google Scholar]
- 13.Alexander SPH, Mathie A, Peters JA. Guide to receptors and channels (GRAC), 4th edn. Br J Pharmacol. 2009;158:S1–254. doi: 10.1111/j.1476-5381.2009.00499.x. [DOI] [PMC free article] [PubMed] [Google Scholar]
- 14.Findlay L, Eastwood D, Stebbings R, Sharp G, Mistry Y, Ball C, Hood J, Thorpe R, Poole S. Improved in vitro methods to predict the in vivo toxicity in man of therapeutic monoclonal antibodies including TGN1412. J Immunol Methods. 2010;352:1–12. doi: 10.1016/j.jim.2009.10.013. [DOI] [PubMed] [Google Scholar]
- 15.Rodríguez-Palmero M, Hara T, Thumbs A, Hünig T. Triggering of T cell proliferation through CD28 induces GATA-3 and promotes T helper type 2 differentiation in vitro and in vivo. Eur J Immunol. 1999;29:3914–3924. doi: 10.1002/(SICI)1521-4141(199912)29:12<3914::AID-IMMU3914>3.0.CO;2-#. [DOI] [PubMed] [Google Scholar]
- 16.Lin CH, Hünig T. Efficient expansion of regulatory T cells in vitro and in vivo with a CD28 superagonist. Eur J Immunol. 2003;33:626–638. doi: 10.1002/eji.200323570. [DOI] [PubMed] [Google Scholar]
- 17.Beyersdorf N, Gaupp S, Balbach K, Schmidt J, Toyka KV, Lin CH, Hanke T, Hünig T, Kerkau T, Gold R. Selective targeting of regulatory T cells with CD28 superagonists allows effective therapy of experimental autoimmune encephalomyelitis. J Exp Med. 2005;202:445–455. doi: 10.1084/jem.20051060. [DOI] [PMC free article] [PubMed] [Google Scholar]
- 18.Chung CH. Managing premedications and the risk for reactions to infusional monoclonal antibody therapy. Oncologist. 2008;13:725–732. doi: 10.1634/theoncologist.2008-0012. [DOI] [PubMed] [Google Scholar]
- 19.Descotes J. Immunotoxicity of monoclonal antibodies. MAbs. 2009;1:104–111. doi: 10.4161/mabs.1.2.7909. [DOI] [PMC free article] [PubMed] [Google Scholar]
- 20.Bugelski PJ, Achuthanandam R, Capocasale RJ, Treacy G, Bouman-Thio E. Monoclonal antibody-induced cytokine-release syndrome. Expert Rev Clin Immunol. 2009;5:499–521. doi: 10.1586/eci.09.31. [DOI] [PubMed] [Google Scholar]
- 21.Kulkarni HS, Kasi PM. Rituximab and cytokine release syndrome. Case Rep Oncol. 2012;5:134–141. doi: 10.1159/000337577. [DOI] [PMC free article] [PubMed] [Google Scholar]
- 22.Suthanthiran M, Fotino M, Riggio RR, Cheigh JS, Stenzel KH. OKT3-associated adverse reactions: mechanistic basis and therapeutic options. Am J Kidney Dis. 1989;14:39–44. [PubMed] [Google Scholar]
- 23.Chatenoud L, Ferran C, Legendre C, Thouard I, Merite S, Reuter A, Gevaert Y, Kreis H, Franchimont P, Bach JF. In vivo cell activation following OKT3 administration. Systemic cytokine release and modulation by corticosteroids. Transplantation. 1990;49:697–702. doi: 10.1097/00007890-199004000-00009. [DOI] [PubMed] [Google Scholar]
- 24.Moreau T, Coles A, Wing M, Isaacs J, Hale G, Waldmann H, Compston A. Transient increase in symptoms associated with cytokine release in patients with multiple sclerosis. Brain. 1996;119:225–237. doi: 10.1093/brain/119.1.225. [DOI] [PubMed] [Google Scholar]
- 25.Wing MG, Moreau T, Greenwood J, Smith RM, Hale G, Isaacs J, Waldmann H, Lachmann PJ, Compston A. Mechanism of first-dose cytokine-release syndrome by CAMPATH 1-H: involvement of CD16 (FcgammaRIII) and CD11a/CD18 (LFA-1) on NK cells. J Clin Invest. 1996;98:2819–2826. doi: 10.1172/JCI119110. [DOI] [PMC free article] [PubMed] [Google Scholar]
- 26.Winkler U, Jensen M, Manzke O, Schulz H, Diehl V, Engert A. Cytokine-release syndrome in patients with B-cell chronic lymphocytic leukemia and high lymphocyte counts after treatment with an anti-CD20 monoclonal antibody (rituximab, IDEC-C2B8) Blood. 1999;94:2217–2224. [PubMed] [Google Scholar]
- 27.Walker MR, Makropoulos DA, Achuthanandam R, Van Arsdell S, Bugelski PJ. Development of a human whole blood assay for prediction of cytokine release similar to anti-CD28 superagonists using multiplex cytokine and hierarchical cluster analysis. Int Immunopharmacol. 2011;11:1697–1705. doi: 10.1016/j.intimp.2011.06.001. [DOI] [PubMed] [Google Scholar]
- 28.Findlay L, Eastwood D, Ball C, Robinson CJ, Bird C, Wadhwa M, Thorpe SJ, Thorpe R, Stebbings R, Poole S. Comparison of novel methods for predicting the risk of pro-inflammatory clinical infusion reactions during monoclonal antibody therapy. J Immunol Methods. 2011;371:134–142. doi: 10.1016/j.jim.2011.06.022. [DOI] [PubMed] [Google Scholar]
- 29.Fujishima S, Hoffman AR, Vu T, Kim KJ, Zheng H, Daniel D, Kim Y, Wallace EF, Larrick JW, Raffin TA. Regulation of neutrophil interleukin 8 gene expression and protein secretion by LPS, TNF-alpha, and IL-1 beta. J Cell Physiol. 1993;154:478–485. doi: 10.1002/jcp.1041540305. [DOI] [PubMed] [Google Scholar]
- 30.Bruhns P, Iannascoli B, England P, Mancardi DA, Fernandez N, Jorieux S, Daëron M. Specificity and affinity of human Fcgamma receptors and their polymorphic variants for human IgG subclasses. Blood. 2009;113:3716–3725. doi: 10.1182/blood-2008-09-179754. [DOI] [PubMed] [Google Scholar]
- 31.Cerdan C, Martin Y, Courcoul M, Mawas C, Birg F, Olive D. CD28 costimulation up-regulates long-term IL-2R beta expression in human T cells through combined transcriptional and post-transcriptional regulation. J Immunol. 1995;154:1007–1013. [PubMed] [Google Scholar]
- 32.Hwang ES, Hong JH, Glimcher LH. IL-2 production in developing Th1 cells is regulated by heterodimerization of RelA and T-bet and requires T-bet serine residue 508. J Exp Med. 2005;202:1289–1300. doi: 10.1084/jem.20051044. [DOI] [PMC free article] [PubMed] [Google Scholar]
- 33.Annunziato F, Romagnani S. Heterogeneity of human effector CD4+ T cells. Arthritis Res Ther. 2009;11:257. doi: 10.1186/ar2843. [DOI] [PMC free article] [PubMed] [Google Scholar]
- 34.Verweij CL, Geerts M, Aarden LA. Activation of interleukin-2 gene transcription via the T-cell surface molecule CD28 is mediated through an NF-kB-like response element. J Biol Chem. 1991;266:14179–14182. [PubMed] [Google Scholar]
- 35.Bilate AM, Lafaille JJ. Induced CD4+Foxp3+ regulatory T cells in immune tolerance. Annu Rev Immunol. 2012;30:733–758. doi: 10.1146/annurev-immunol-020711-075043. [DOI] [PubMed] [Google Scholar]
- 36.Lu L, Zhou X, Wang J, Zheng SG, Horwitz DA. Characterization of protective human CD4CD25 FOXP3 regulatory T cells generated with IL-2, TGF-β and retinoic acid. PLoS One. 2010;5:e15150. doi: 10.1371/journal.pone.0015150. [DOI] [PMC free article] [PubMed] [Google Scholar]
- 37.Wang J, Ioan-Facsinay A, van der Voort EI, Huizinga TW, Toes RE. Transient expression of FOXP3 in human activated nonregulatory CD4+ T cells. Eur J Immunol. 2007;37:129–138. doi: 10.1002/eji.200636435. [DOI] [PubMed] [Google Scholar]
- 38.Caruso A, Licenziati S, Corulli M, Canaris AD, De Francesco MA, Fiorentini S, Peroni L, Fallacara F, Dima F, Balsari A, Turano A. Flow cytometric analysis of activation markers on stimulated T cells and their correlation with cell proliferation. Cytometry. 1997;27:71–76. doi: 10.1002/(sici)1097-0320(19970101)27:1<71::aid-cyto9>3.0.co;2-o. [DOI] [PubMed] [Google Scholar]