

Abstract
Increased fatty acid availability and oxidative stress are physiological consequences of exercise (Ex) and a high-fat, high-sugar (HFHS) diet. Despite these similarities, the global effects of Ex are beneficial, whereas HFHS diets are largely deleterious to the cardiovascular system. The reasons for this disparity are multifactorial and incompletely understood. We hypothesized that differences in redox adaptations following HFHS diet in comparison to exercise may underlie this disparity, particularly in mitochondria. Our objective in this study was to determine mechanisms by which heart and skeletal muscle (red gastrocnemius, RG) mitochondria experience differential redox adaptations to 12 weeks of HFHS diet and/or exercise training (Ex) in rats. Surprisingly, both HFHS feeding and Ex led to contrasting effects in heart and RG, in that mitochondrial H2O2 decreased in heart but increased in RG following both HFHS diet and Ex, in comparison to sedentary animals fed a control diet. These differences were determined to be due largely to increased antioxidant/anti-inflammatory enzymes in the heart following the HFHS diet, which did not occur in RG. Specifically, upregulation of mitochondrial thioredoxin reductase-2 occurred with both HFHS and Ex in the heart, but only with Ex in RG, and systematic evaluation of this enzyme revealed that it is critical for suppressing mitochondrial H2O2 during fatty acid oxidation. These findings are novel and important in that they illustrate the unique ability of the heart to adapt to oxidative stress imposed by HFHS diet, in part through upregulation of thioredoxin reductase-2. Furthermore, upregulation of thioredoxin reductase-2 plays a critical role in preserving the mitochondrial redox status in the heart and skeletal muscle with exercise.
Key points
For reasons not completely understood, obesogenic high-fat, high-sucrose (HFHS) diets and exercise training both increase free fatty acid utilization and chronic oxidative stress, yet the former is deleterious to cardiovascular/metabolic health, whereas the latter is beneficial.
Here, we report that the heart shows decreased mitochondrial H2O2 (mH2O2) generation following HFHS diet, while skeletal muscle shows increased mH2O2, and uncover a novel role for thioredoxin reductase-2 (TxnRd2) underlying these differences.
We also show that TxnRd2 is critical to controlling mH2O2 levels during mitochondrial fatty acid oxidation, especially following exercise training in skeletal muscle.
These findings are important in that they illustrate how the heart and skeletal muscle have contrasting adaptations in antioxidant capacity in response to HFHS diet, and uncover a new role for TxnRd2 in the overall control of mH2O2 in these organs with HFHS diet and exercise training.
Introduction
Diets high in fat and sucrose (HFHS) content (i.e. ‘Western style’ or ‘junk food’ diet) are well known to promote the development of obesity and the metabolic syndrome. Investigation into the mechanisms responsible for such a phenomenon by our group (Anderson et al. 2009b) and others (Houstis et al. 2006) has firmly established an increase in the generation of reactive oxygen species (ROS) as a key aetiological contributor. In this respect, the principal consequence of HFHS feeding is believed to be elevated production of peroxide secondary to increased fatty acid supply/utilization within mitochondria of peripheral tissues (Houstis et al. 2006; Anderson et al. 2009b). The ability of increased H2O2 to alter protein function and thereby contribute to metabolic disease stems from its integration into and regulation of various redox signalling networks operating within the cell (Adimora et al. 2010; Fisher-Wellman & Neufer, 2012). The intracellular redox environment is comprised of the principal thiol/disulfide redox couples, [glutathione (2GSH/GSSG) and thioredoxin (TrxRed/TrxOx)], as well as their associated enzyme networks, all of which derive reducing power from NADPH/NADP+ (Schafer & Buettner, 2001; Kemp et al. 2008). Continual electron flux through these redox couples serves to prevent excessive accumulation of H2O2, as well as to promote the steady-state reduction of the 22,000 cysteine-containing proteins, collectively referred to as the redox-sensitive proteome (Jones, 2008). Transient fluctuations in oxidative (H2O2) or reductive (NADPH) input throughout these couples and resultant changes in protein cysteine redox status are believed to be the mechanism whereby redox signalling events are propagated in vivo (Go et al. 2011).
In addition to H2O2, lipid peroxides are capable of propogating changes in the redox environment throughout cells and tissues, and perhaps more capable at propagating changes throughout cellular membranes given their lipophilic nature. The relative abundance of n-6 polyunsaturated fatty acids (PUFAs) in the Western diet leads to constitutively high levels of α,β-unsaturated aldehydes in vivo, such as 4-hydroxynonenal (HNE) and malondialdehyde (MDA), formed as a result of enzymatic and non-enzymatic (i.e. spontaneous) PUFA oxidation. Spontaneous PUFA oxidation occurs largely via ROS and reactive nitrogen species (RNS). Irrespective of the nature of their origin, these PUFA-derived aldehydes are highly reactive and cause carbonyl modification of proteins, phospholipids and DNA (Esterbauer et al. 1991). Total levels of protein carbonylation rise and fall within tissues in response to variations in oxidative stress and fatty acid availability, and levels of HNE-modified protein have been reported by us (Anderson et al. 2009a) and others (Toyokuni et al. 2000) to be considerably higher in cardiovascular tissues of patients with metabolic disease, in comparison to healthy patients. Indeed, a role for PUFA-derived aldehydes is overlooked and probably underappreciated, as both a cause and a consequence of metabolic disease (Baynes, 2003; Alt et al. 2004; Shanmugam et al. 2008; Iacobini et al. 2009).
Regardless of the nature of the peroxide, based on this model it is evident that physiological conditions known to elevate cellular peroxide production or to compromise NADPH generation can lead to widespread disruptions in redox signalling, and subsequently, disease. This is especially true if adaptive upregulation in cellular antioxidant networks does not occur to offset any increased peroxide burden. Endogenous antioxidant and phase II-detoxification enzyme systems are responsible for keeping oxidative/carbonyl stress under control, either by countering oxidative stress directly (i.e. the glutathione- and thioredoxin-related enzymes) or by metabolizing the aldehydes as they are formed (e.g. glutathione S-transferase and aldehyde dehydrogenase enzymes).
Both HFHS diet and chronic exercise are lifestyle interventions that are well known to cause increased fatty acid availability and oxidative stress. Despite sharing these common features, HFHS diet and chronic exercise lead to dramatically different cardiovascular/metabolic outcomes, with exercise leading to improved cardiovascular and metabolic fitness and HFHS diet leading to disease. It was hypothesized that one of the primary mechanisms underlying the different outcomes between these interventions may be the way in which each intervention impacts the redox environment of oxidative tissues, such as cardiac and skeletal muscle (SkM), and in particular, the way in which these tissues adapt to the oxidative stress imposed. Repeated exposure to subtoxic levels of oxidative stress is generally considered to be a primary mechanism by which exercise enhances antioxidant redox buffering capacity in heart (Ascensão et al. 2007; Frasier et al. 2011) as well as skeletal muscle (Powers et al. 1999; Powers & Lennon, 1999).
In the present study, using a novel HFHS diet formulated in our laboratory, we performed a comprehensive examination of the effects of HFHS diet and exercise training on redox adaptations and mitochondrial function in cardiac and skeletal muscle, to determine whether these tissues have differential redox adaptations to these interventions and to uncover novel mechanisms by which they occur. Particular attention was focused on mitochondrial antioxidant buffering systems, because mitochondrial H2O2 (mH2O2) emission is principally involved in the establishment and regulation of the intracellular redox environment (Houstis et al. 2006; Anderson et al. 2009b). Our findings reveal completely divergent redox adaptations to HFHS diet between heart and skeletal muscle and uncover a novel role for mitochondrial thioredoxin reductase-2 (TxnRd2) as a mechanism by which this occurs. Specifically, HFHS diet markedly decreased mH2O2 in heart but increased mH2O2 in skeletal muscle. Despite the divergent response to HFHS diet, exercise training increased TxnRd2 in both organs, most particularly in skeletal muscle, illustrating that the redox adaptations to this intervention share convergent mechanisms. Finally, using a systematic experimental approach to measure the relative contribution of TxnRd2 to maintaining the mitochondrial redox status in heart and skeletal muscle, TxnRd2 was found to be more efficacious at suppressing mH2O2 by the electron transport system when fatty acids are the predominant oxidative substrate in comparison to when multiple substrates are present.
Methods
Animals, reagents and experimental design
Chemicals and reagents used in this study were all obtained from Sigma-Aldrich, except for Amplex Red and Calcium Green 5-N, which were obtained from Invitrogen (Grand Island, NY, USA). All interventions and procedures were approved by the East Carolina University (ECU) Animal Care and Use Committee and performed in accordance with the Guide for the Care and Use of Laboratory Animals published by the US National Institutes of Health (NIH publication no. 85-23, revised 1996). Male Sprague–Dawley rats aged 5 weeks were purchased (Charles River Laboratories, Wilmington, MA, USA) and housed in conditions of controlled temperature and light within the Department of Comparative Medicine at Brody School of Medicine, ECU. After several days to permit adjustment to new environment, rats were randomized into four groups. Two groups received a high-calorie, n-6 PUFA-enriched, high-fat, high-sucrose diet (HFHS), developed in partnership with a nutritionist at Harlan-Teklad Laboratories (Madison, WI, USA). The two remaining groups were fed a low-calorie control diet (Ctl) matched for fatty acid composition with the HFHS diet, but far lower in total fatty acid content. A detailed description of these diets can be found in Table 1. Within each diet group, rats were then randomized either to be sedentary (Sed) or to undergo 12 weeks of an aerobic interval exercise regimen throughout the duration of the diet (Ex). The exercise regimen was designed to approximate the training protocols used in previous studies and to approximate ‘high-intensity interval training’ models in humans (Wisløff et al. 2001; Haram et al. 2009). Prior to initiating the exercise training, rats underwent an acclimation period by walking on a treadmill at 15 m min−1 (0 deg incline) for 10 min day−1 for 7 days consecutively. The training protocol consisted of 5 days week−1 of exercise, with a maximal work capacity test on the first training day of each week, followed by aerobic interval training the following 4 days week−1. The maximal work capacity test consisted of a 20 min warm-up at 50% maximal O2 uptake, then incremental increases in speed of 2.0 m min−1 every 2 min until volitional fatigue, then followed by a 10 min cooling down period at <50% maximal O2 uptake. Aerobic interval training protocols consisted of a 10 min warm-up followed by eight intervals, each consisting of a 4 min high-intensity phase and 3 min low-intensity phase, followed by a cooling down phase. Compressed air was used as the primary motivational tool, and this was done to minimize contact between the rats and the electric shock grid at the back of the treadmill. Collectively, the four groups of rats used in this study were designated Ctl (control diet), Ctl + Ex, HFHS and HFHS + Ex, for data presentation and this manuscript.
Table 1.
Macronutrient composition of the diets formulated by our laboratory and used in this study
| Component | Ctl diet TD110367 | HFHS diet TD110365 |
|---|---|---|
| Protein (% kcal) | 15 | 14.8 |
| Carbohydrate (% kcal) | 72.4 | 40.7 |
| Sucrose (g kg−1) | 150 | 340 |
| Corn starch (g kg−1) | 445 | 62 |
| Fat (% kcal) | 12.7 | 44.6 |
| Anhydrous milkfat | 26 | 120 |
| Soybean oil | 18 | 30 |
| Safflower oil | 6 | 80 |
| Total kcal g−1 | 3.67 | 4.68 |
| Fatty acid composition | ||
| SFA (% total fatty acids) | 40 | 39 |
| MUFA (% total fatty acids) | 26 | 24 |
| PUFA (% total fatty acids) | 33 | 37 |
| C18:2 linoleic (% by wt) | 15.01 | 8.2 |
| C18:3 linolenic (% by wt) | 1.57 | 0.3 |
| n-6 to n-3 ratio | 9.6 | 27 |
The catalogue number is provided for each diet (TDxxxxxx), and they can now be ordered from Harlan Laboratories (Madison, WI, USA). Abbreviations: MUFA, monounsaturated fatty acids; PUFA, polyunsaturated fatty acids; and SFA, saturated fatty acids.
Measurement of metabolic parameters and muscle tissue dissection
All rats were subjected to an overnight fast before they were killed, and this corresponded to ∼15 h after the last bout of exercise for those animals that were in the exercise groups. Before the rats were killed, blood was drawn from the tail vein of each rat for measurement of glucose using standard glucometer (Accu-Check; Roche, Basel, Switzerland), and serum was collected for measurement of insulin using an enzyme-linked immunosorbent assay (Millipore, Billerica, MA, USA). Serum triglycerides and cholesterol were measured using a clinical mass analyser (UniCel DxC 600; Beckman Coulter, Indianapolis, IN, USA). The final body weight of each animal was recorded using a triple beam balance, and lean and fat mass were measured using nuclear magnetic resonance imaging (EchoMRI 700; Echo Medical Systems, Houston, TX, USA). Rats were then killed with an i.p. injection of ketamine (90 mg kg−1) and xylazine (10 mg kg−1), hearts removed, briefly rinsed in saline, dried and weighed. A portion of the left ventricle near the apex was removed from the heart for mitochondrial experiments. The remaining left ventricle and septum were snap-frozen in liquid N2 for biochemistry. Portions (∼300 mg) of red (RG) and white gastrocnemius (WG) skeletal muscle were also quickly removed at this time. A small sample was used immediately for mitochondrial experiments and the remainder frozen in liquid N2 for biochemistry.
Preparation of permeabilized cardiac myofibres
This technique has been described by our group (Anderson et al. 2007) and others (Saks et al. 1998) in detail. Following dissection, muscle samples were placed in ice-cold (4°C) Buffer X containing (mm): 7.23 K2EGTA, 2.77 CaK2EGTA, 20 imidazole, 20 taurine, 5.7 ATP, 14.3 phosphocreatine, 6.56 MgCl2.6H2O and 50 Mes (pH 7.1, 295 mosmol l−1). Under a dissecting microscope, fat and connective tissue were removed from muscle samples and then small bundles of fibres were prepared (>1 mg wet weight per fibre bundle). Fibre bundles were treated with 50 μg ml−1 saponin for 30 min as previously described (Anderson & Neufer, 2006). Following permeabilization, myofibre bundles were washed in ice-cold Buffer Z containing (mm): 110 K-Mes, 35 KCl, 1 EGTA, 5 K2HPO2, 3 MgCl2.6H2O and 5 mg ml−1 bovine serum albumin (BSA; pH 7.4, 295 mosmol l−1) and remained in Buffer Z on a rotator at 4°C until analysis (<4 h). We have observed that permeabilized myofibre bundles exhibit a very strong Ca2+-independent contraction that is temperature sensitive and can occur even at 4°C (Perry et al. 2011); therefore, 20 μm blebbistatin was added to the wash buffer, in addition to the respiration medium during experiments, to prevent contraction as previously described. Following permeabilization and washing in Buffer Z, all mitochondrial function measurements in this study were performed in exactly the same order from one animal to another and among groups, to minimize the potential influence that the timing and duration of washing may have on the end-points measured.
Measurement of mitochondrial O2 consumption, H2O2 emission and Ca2+ retention capacity in permeabilized cardiac and skeletal myofibres
All mitochondrial measurements were performed at 37°C with 20 μm blebbistatin in the assay buffer to prevent contraction during the course of the experiments. The Oroboros O2K Oxygraph system (Oroboros Instruments, Innsbruck, Austria) was used for O2 consumption ( ) measurements. The H2O2 and Ca2+ measurements were performed in a spectrofluorometer (Photon Technology Instruments, Birmingham, NJ, USA or Horiba Jobin Yvon, Ann Arbor, MI, USA), equipped with a thermo-jacketed cuvette chamber. All mitochondrial experiments were performed in Buffer Z plus 5 mg ml−1 BSA, with the exception of the skeletal muscle (SkM) permeabilized myofibre bundles, which required that Ca2+ retention experiments be performed in Buffer Y, containing (mm): 250 sucrose, 10 Tris–HCl, 20 Tris base, 10 KH2PO4, 2 MgCl2.6H2O and 0.5 mg ml−1 BSA). During the course of the
  experiments, substrates, nucleotides and respiratory inhibitors were provided as indicated in the figure legends.
Unless otherwise indicated, all  (mitochondrial H2O2 release/emission) experiments were performed in presence of 100 μm ADP (cardiac permeabilized myofibre bundles) or 25 μm ADP (SkM permeabilized myofibre bundles), 5 mm glucose and 1 U ml−1 hexokinase to keep the mitochondria in a permanent, submaximal phosphorylating state, to best mimic the in vivo conditions. Substrates used to cause
  are indicated in the figure legends, and rates of
  were calculated as outlined by Anderson et al. (2007). To assess the contribution of TxnRd2 to preserving the mitochondrial matrix redox state, all mitochondrial
  experiments were performed both in absence and presence of the TxnRd2-specific inhibitor auranofin (1 μm). This is a simple and effective method used recently by others to determine the total contribution of TxnRd2 to mitochondrial antioxidant buffering capacity in the heart (Stanley et al. 2011).
For mitochondrial Ca2+ retention measurements, Buffer Z (or Buffer Y for SkM fibres) contained 1 μm Calcium Green 5-N (Invitrogen), 5 mm pyruvate and 2 mm malate. At the start of Ca2+ retention experiments, 1 μm thapsigargin was added to inhibit sarco(endo)plasmic reticulum Ca2+-ATPase, and 40 μm EGTA added to chelate residual Ca2+ and to establish minimum fluorescence. Pulses of 4 nmol Ca2+ (CaCl2) were sequentially added, and Ca2+ uptake followed until mitochondrial permeability transition pore opening as shown by Anderson et al. (2011). At the end of the experiment, 1 mm CaCl2 was added to saturate the probe and establish maximum fluorescence. Changes in free Ca2+ in the cuvette during mitochondrial Ca2+ uptake were then calculated using the known Kd for Calcium Green 5-N and the equations established by Tsien's group for calculating free ion concentrations using ion-sensitive fluorophores (Tsien, 1989). At the conclusion of all the experiments, the fibres were rinsed in double deionized H2O, lyophilized in a freeze-dryer (Labconco, Kansas City, MO, USA) for >2 h and weighed on a microscale (Mettler-Toledo XS3DU, Columbus OH, USA). Data are expressed as picomoles per second per milligram of dry weight ( ), picomoles per minute per milligram of dry weight (
 ) or nanaomoles per milligram of dry weight (Ca2+ retention).
Real-time qPCR of redox and anti-inflammatory gene expression
For mRNA extraction, cardiac and SkM samples frozen in liquid N2 were homogenized in a glass grinder (Kimble Chase, Vineland, NJ, USA) and then subjected to a brief proteinase K treatment (55°C for 10 min). Total mRNA was then extracted in RNeasy columns according to the manufacturer's instructions (Qiagen, Inc., Valencia, CA, USA). Reverse transcription and relative changes in mRNA of all redox- and anti-inflammatory target genes were determined by fluorescence-based real-time PCR using SsoAdvanced SYBR Green Supermix (BioRad Laboratories, Hercules, CA, USA). The primer pairs used in these experiments are listed in Table 2, along with their respective source, whether determined in our laboratory using NIH PrimerBlast (http://www.ncbi.nlm.nih.gov/tools/primer-blast/) or published elsewhere. The mRNA for β-actin was used as the normalizing control.
Table 2.
Primer sequences for redox and anti-inflammatory target genes analysed in this study
| Target | Sense (5′–3′) | Antisense (3′–5′) | Source/reference |
|---|---|---|---|
| GR | TGC CTG CTC TGG GCC ATT | CTC CTC TGA AGA GGT AGG AT | (Cao et al. 2006) |
| GST-A1 | GAA GCC AGT CCT TCA CTA CT | CAG CTC TTC CAC ATG GTA GA | (Cao et al. 2006) |
| NQO1 | CCA TTC TGA AAG GCT GGT TTG | CTA GCT TTG ATC TGG TTG TC | (Cao et al. 2006) |
| GPx | CTC TCC GCG GTG GCA CAG T | CCA CCA CCG GGT CGG ACA TAC | (Yeh & Yen, 2006) |
| TrxR2 | TGT CAA CGA GCA CAC AGT TCA CGG | ACG TTT TCC CAG GGG ACT CCT TCA | (Yonehara et al. 2003) |
| TXN | TGC CGA CCT TCC AGT TCT AT | GGC TTC GAG CTT TTC CTT GT | (Khanna et al. 2012) |
| HO-1 | TTT GTC CGA GGC CTT GAA GG | TCA TGC GAG CAC GAT AGA GC | (Tamion et al. 2002) |
| GCLC | ACC CCG AGC CCA CTC AGA CG | GGG CGG AAA CCT GGT GGC TG | NIH Primer BLAST |
| GPx4 | CGA GAT GAG CTG GGG CCG TC | CCA CAC TCG GCG TAT CGG GC | NIH Primer BLAST |
| β-Actin | CCC AGC ACA ATG AAG ATC AA | GAT CCA CAC GGA GTA CTT G | (Khanna et al. 2012) |
The source of each primer sequence is indicated either from primary literature or as generated in our laboratory using the NIH Primer Blast resource (http://www.ncbi.nlm.nih.gov/tools/primer-blast/). Abbreviations: GCLC, γ-glutamylcysteine ligase catalytic subunit; GPx, glutathione peroxidase; GPx4, glutathione peroxidase 4; GR, glutathione reductase; GST-A1, glutathione s-transferase A-1; HO-1, haem oxygenase-1; NQO1, NAD(P)H:quinone oxidoreductase 1; TXN, thioredoxin; and TxnRd2, thioredoxin reductase-2.
Total glutathione and redox enzyme measurements
Cardiac and SkM tissue samples frozen in liquid N2 were homogenized in 10 times (w/v) TEE buffer containing (mm): 10 Tris base, 1 EDTA and 1 EGTA, with 0.5% Tween-20, using a glass grinder (Kimble Chase). All enzyme activity assays were performed within the same day as the protein extraction. Total glutathione measurements were performed as described previously (Anderson et al. 2009b, 2012) using a modified Tietze method (Tietze, 1969). Glutathione reductase (GR) activity in myocardial tissue was measured in TEE buffer containing 1 mm GSSG and 0.5 mm NADPH, where activity was calculated from the linear decrease in NADPH absorbance with time (Carlberg & Mannervik, 1985). The total content of TxnRd2 in cardiac and SkM tissue was determined in protein homogenates prepared from these tissues using immunoblotting with an antibody specific for TxnRd2 (ThermoScientific, Rockford, IL, USA).
Measurement of HNE-modified protein adducts in serum, cardiac and SkM tissue
The absolute amount of HNE-modified protein adducts in serum, cardiac and SkM of animals in this study was determined by a quantitative enzyme-linked immunosorbent assay approach developed and validated in our laboratory (La Favor et al. 2012). A standard curve of HNE-modified protein adducts was first established by incubating HNE with predetermined concentrations of BSA. Following an overnight incubation at 37°C, HNE–BSA adducts were added to an Immunolon-coated 96-well assay plate (Fisher Scientific) along with diluted serum (1:40 in PBS), cardiac protein (1:50) or SkM protein (1:20). Samples were incubated overnight at 4°C, and subsequently washed with PBS and 0.05% Tween-20 and blocked for 2 h with NB4025 (NOF America, White Plains, NY, USA). Samples were then incubated with anti-HNE antibody (1 μg ml−1 in PBS; Percipio Biosciences, Foster City, CA, USA), for 2 h at 37°C. Samples were washed with PBS and 0.05% Tween-20 and incubated with secondary antibody for 2 h at 27°C (goat anti-mouse HRP; Bio-Rad). Following this incubation, samples were washed as before and incubated with N-(3-Sulfopropyl)-3,3′,5,5′-tetramethylbenzidine sodium salt for 20 min. The reaction was quenched with 1 m sulfuric acid, and the absorbance of the samples at 450 nm was determined. The total quantities of HNE-modified proteins in each group were determined using a standard curve of HNE-modified BSA, and expressed as an absolute amount, as millimoles per gram of protein (cardiac and SkM) or millimolar (serum).
Statistical analysis
Data are presented as means ± SEM. All data were normally distributed and equally dispersed among groups, which allowed for the use of parametric statistics. Therefore, interval variables between groups of all end-points measured in this study were compared using one-way ANOVA or, in the case of mitochondrial function measurements, two-way ANOVA, with treatment group (Ctl, Ctl+Ex, HFHS and HFHS+Ex) as the main effect. Statistically significant differences across groups were determined by a post hoc Newman–Keuls multiple comparison test for one-way ANOVA or Bonferonni's post hoc test for two-way ANOVA (GraphPad Prism, La Jolla, CA, USA), with α-level of significance set at 0.05.
Results
Metabolic characteristics
Terminal body composition and metabolic characteristics of the four experimental groups are depicted in Table 3. Compared with sedentary Ctl rats, 12 weeks of HFHS feeding led to significant elevations in fat mass, despite the lack of changes in lean mass, total body weight or heart weight. Fasting blood glucose was elevated in the HFHS sedentary group, although given the cohort size used in this study, the insulin level was not significantly different between groups. Twelve weeks of exercise training completely prevented the elevations in fat mass and blood glucose/insulin induced by the HFHS diet. Blood lipids were similar for all experimental groups, except for a slight depression in total cholesterol in the HFHS exercised group compared with sedentary control animals. Citrate synthase activity was not affected by either diet or exercise in the heart; however, citrate synthase activity was higher in SkM for Ctl+Ex compared with sedentary HFHS rats.
Table 3.
Body composition and metabolic parameters in animals at termination of diet and/or exercise intervention
| Ctl Sed | Ctl+Ex | HFHS Sed | HFHS+Ex | |
|---|---|---|---|---|
| Terminal body weight (g) | 458 ± 8.0 | 424 ± 12.5 | 499 ± 11.1† | 456 ± 17.2 |
| Heart weight (g) | 1.14 ± 0.08 | 1.03 ± 0.13 | 1.12 ± 0.1 | 1.15 ± 0.11 |
| Fat mass (g) | 52.0 ± 5.97 | 34.8 ± 7.48 | 76.9 ± 4.93‡ | 44.3 ± 8.48 |
| Lean mass (g) | 341 ± 6.1 | 328 ± 7.8 | 356 ± 8.3 | 349 ± 10.3 |
| Body fat (%) | 13.1 ± 1.30 | 9.3 ± 1.82 | 17.7 ± 0.98‡ | 10.9 ± 1.52 |
| Glucose (mg dl−1) | 107 ± 3.5 | 99 ± 1.6 | 121 ± 3.5‡ | 109 ± 3.7 |
| Insulin (pm) | 125 ± 43.5 | 142 ± 28.1 | 174 ± 24.3 | 116 ± 23.4 |
| Homeostatic model assessment – insulin resistance | 4.94 ± 1.84 | 4.87 ± 0.95 | 7.34 ± 1.04 | 4.51 ± 1.09 |
| Cholesterol (mg dl−1) | 39.0 ± 4.53 | 34.0 ± 2.59 | 30.2 ± 1.91 | 27.1 ± 2.14* |
| Triglycerides (mg dl−1) | 58.0 ± 9.8 | 54.8 ± 12.2 | 45.3 ± 10.0 | 27.3 ± 6.1 |
| Citrate synthase in heart (μmol min−1 (g protein)−1) | 108.8 ± 11.62 | 119.6 ± 3.01 | 130 ± 3.29 | 120 ± 3.59 |
| Citrate synthase in skeletal muscle (μmol min−1 (g protein)−1) | 66.81 ± 2.28 | 76.41 ± 3.80 | 59.8 ± 3.55† | 69.86 ± 2.71 |
Values are shown as means ± SEM, n= 6–9 per group. *P < 0.05 vs. Ctl Sed (control sedentary). †P < 0.05 vs. Ctl Ex (control exercised). ‡P < 0.05 vs. all other groups. HFHS sed (high fat high sucrose sedentary) and HFHS+Ex (high fat high sucrose exercised).
Mitochondrial respiratory capacity and Ca2+ tolerance is altered by HFHS diet and Ex
Maximal glutamate-supported respiration was not affected by either diet or exercise in the heart (Fig. 1A, Heart), but was significantly depressed by HFHS in SkM (Fig. 1A, RG SkM). Also, the sensitivity of RG mitochondria to glutamate increased with Ex and HFHS diet, as manifested by a decreased Km for this substrate (Supplemental Table 1). Maximal palmitoyl carnitine-supported respiratory capacity was increased in the heart following 12 weeks of aerobic Ex regardless of diet (Fig. 1B, Heart) but was unaffected by both diet and Ex in SkM (Fig. 1B, RG SkM). The sensitivity of heart mitochondria to palmitoyl carnitine increased with HFHS diet, but not Ex, manifested by a decreased Km for this substrate (Supplemental Table 1). Respiratory capacity in saturating concentrations of complex I- (glutamate/malate) and complex II (succinate)-based substrates was not significantly affected by HFHS diet in either heart or SkM (Fig. 1C). However, 12 weeks of aerobic exercise increased complex I + II respiratory capacity within SkM of Ctl diet-fed rats (Fig. 1C, RG SkM). These effects were maintained following the addition of rotenone and exclusion of complex I (Fig. 1D), suggesting that total mitochondrial oxidative capacity and enzyme content were higher with Ctl+Ex. It should be noted that similar results were also observed using permeabilized fibres prepared from glycolytic skeletal muscle (white gastrocnemius, WG), with the exception that HFHS-induced depressions in glutamate-supported respiration were not apparent (Supplemental Fig. 1). Mitochondrial Ca2+ retention capacity, an index of the susceptibility to cell death and Ca2+ overload in the tissue, was also assessed in permeabilized myofibres prepared from heart and SkM. Compared with sedentary control animals, Ca2+ retention capacity was unaltered by diet or exercise in heart, was increased in HFHS diet-fed exercised rats in RG and was decreased in control diet-fed exercised rats in WG (Supplemental Fig. 2).
Figure 1. Mitochondrial respiratory capacity and function in cardiac and skeletal muscle following high-fat, high-sucrose (HFHS) diet and/or exercise.
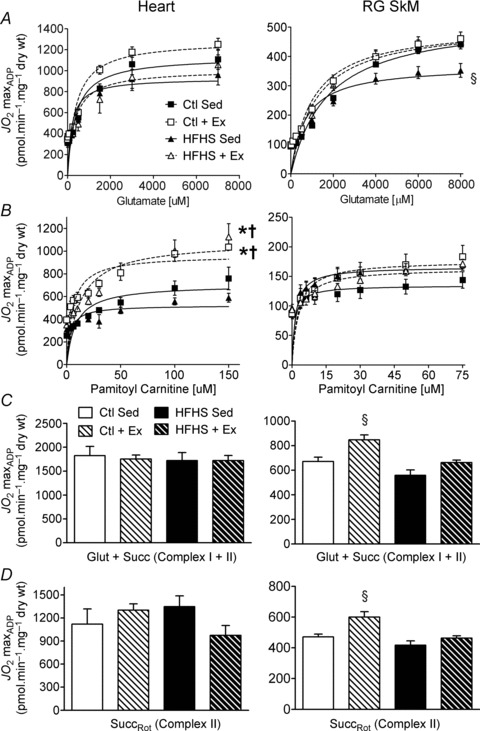
Rates of mitochondrial O2 consumption ( ) in maximal ADP-stimulated conditions (5 mm) with progressive titrations of glutamate (A) and palmitoyl-l-carnitine (B) are shown for cardiac (Heart, left panels) and red gastrocnemius skeletal muscle (RG SkM, right panels) in all four experimental groups. Maximal ADP-stimulated
  in cardiac (left panels) and skeletal muscle (right panels) supported by complex I and II substrates glutamate/malate and succinate are shown in C, or complex II-only substrate succinate in presence of rotenone (D). Data are shown as means ± SEM, n= 6–8 per group. *P < 0.05 vs.
 Vmax in Ctl Sed (control sedentary). †P < 0.05 vs.
 Vmax in HFHS Sed (high fat high sucrose sedentary). §P < 0.05 vs.
  Vmax in all other groups (Ctl + Ex = control exercised; HFHS + Ex = high fat high sucrose exercised).
Divergent adaptations in mH2O2 following HFHS feeding and exercise within heart and SkM
To determine the impact of HFHS diet and Ex on mitochondrial redox status and H2O2 production, maximal mH2O2 supported by succinate was assessed in permeabilized fibres prepared from heart and SkM of each experimental group. Surprisingly, both HFHS diet and Ex lowered mH2O2 in heart (Fig. 2A, Heart), but HFHS diet markedly increased mH2O2 within SkM, an effect which was completely attenuated in the HFHS+Ex group (Fig. 2A, RG SkM). Maximal mH2O2 was also elevated in SkM of Ctl+Ex rats (Fig. 2B, SkM). To address whether these increases in maximal mH2O2 were linked to PUFA-derived carbonyl stress, HNE-modified proteins were measured quantitatively in the tissues. Levels of HNE-modified proteins were unchanged in heart regardless of treatment. Interestingly, SkM of HFHS+Ex rats displayed significantly higher levels of HNE-modified proteins than SkM from any other group (Fig. 2B, RG SkM). Serum levels of HNE-adducts were reduced by exercise regardless of diet (Fig. 2C).
Figure 2. Polyunsaturated fatty acid (PUFA)-derived carbonyl stress and mitochondrial reactive oxygen species (ROS) in cardiac and skeletal muscle following HFHS diet and/or exercise.
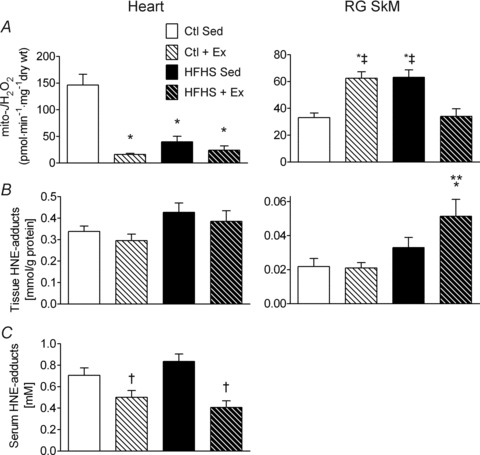
Rates of mitochondrial H2O2 emission (mito- ) in the presence of succinate are shown in A for cardiac (left panel) and red gastrocnemius skeletal muscle (right panel) in all four experimental groups. Levels of PUFA-derived carbonyl stress in the four groups, as determined by the quantity of 4-hydroxynonenal (HNE)-modified proteins, are shown in B for cardiac tissue (left panel) and skeletal muscle tissue (right panel). Shown in C is the quantity of HNE-modified proteins in serum of animals from all four experimental groups. Data are shown as means + SEM, n= 7–8 per group. *P < 0.05 vs. Ctl Sed, **P < 0.05 vs. Ctl + Ex, †P < 0.05 vs. HFHS Sed and ‡P < 0.05 vs. HFHS + Ex.
Rates of mH2O2 are governed by TxnRd2 in a substrate-dependent manner and are differentially regulated by HFHS diet and Ex within heart and SkM
To determine the contribution of TxnRd2 to the overall mitochondrial redox status in heart and SkM, as well any potential modification by HFHS and Ex, mH2O2 experiments were conducted using a variety of substrate combinations in the presence and absence of a specific inhibitor of TxnRd2 (auranofin). In these experiments, mH2O2 was assessed in submaximal ADP-phosphorylating conditions in order to mimic the physiological state of the muscle tissue in vivo. With respect to energization with fatty acids, palmitoyl-carnitine-supported mH2O2 was decreased by both HFHS diet and Ex in heart, and by inhibiting TxnRd2 with auranofin the levels of mH2O2 in heart across all groups were normalized to levels comparable to Ctl (Fig. 3A). Similar effects were observed within SkM in the presence of auranofin, although surprisingly, the effect of auranofin was enhanced ∼4-fold by exercise (Fig. 3B).
Figure 3. Thioredoxin reductase-2 (TxnRd2) and mitochondrial ROS supported only by fatty acid in cardiac and skeletal muscle following HFHS diet and/or exercise.
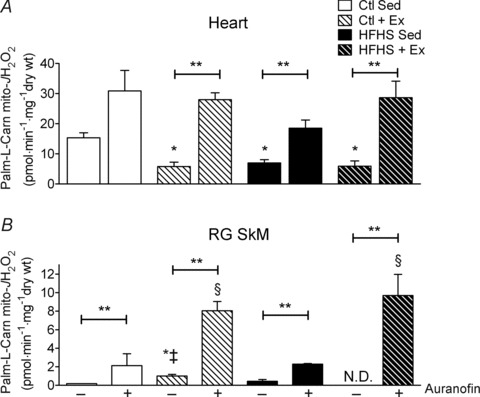
Rates of mitochondrial H2O2 emission (mito- ) supported by palmitoyl-l-carnitine in state 3 (i.e. phosphorylating) conditions in the absence and presence of the TxnRd2 inhibitor auranofin are shown for cardiac (A) and red gastrocnemius skeletal muscle (B). Data are shown as means + SEM, n= 5–8 per group. *P < 0.05 vs. Ctl Sed (–auranofin), ‡P < 0.05 vs. HFHS + Ex (–auranofin), §P < 0.05 vs. Ctl + HFHS Sed (+auranofin) and **P < 0.05 indicates main effect of auranofin within group.
Next, a more detailed examination of the role of TxnRd2 in maintaining mitochondrial redox status with HFHS diet and Ex was performed by measuring heart and SkM mH2O2 supported by a combination of substrates (palmitoyl-carnitine, malate, glutamate and succinate). Assessment of mH2O2 supported by this substrate combination in submaximal ADP-phosphorylating conditions revealed similar reductions in rates of mH2O2 by both HFHS diet and Ex in heart (Fig. 4A, –Auranofin). Inhibiting TxnRd2 by auranofin in the presence of multiple substrates increased mH2O2 only in the Ex groups (Fig. 4A, +Auranofin) but had no effect on mH2O2 in the sedentary groups. The results for SkM mH2O2 were similar to those observed in the presence of succinate alone, in that both Ex and HFHS diet increased mH2O2, while HFHS+Ex was similar to Ctl (Fig. 4B, –Auranofin). Here again, inhibiting TxnRd2 with auranofin increased mH2O2 only in the Ex groups (Fig. 4B, +Auranofin).
Figure 4. Thioredoxin reductase-2 and mitochondrial ROS supported by a combination of substrates in cardiac and skeletal muscle following HFHS diet and/or exercise.
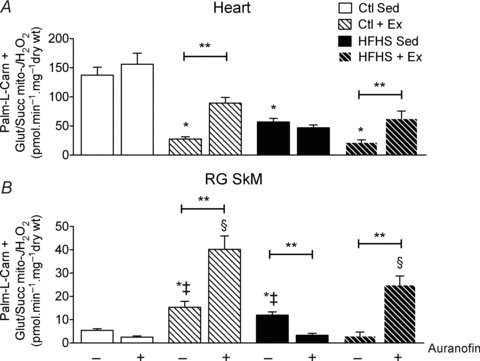
Rates of mitochondrial H2O2 emission (mito- ) supported by palmitoyl-l-carnitine + glutamate/malate + succinate in state 3 (i.e. phosphorylating) conditions in the absence and presence of the TxnRd2 inhibitor auranofin are shown for cardiac (A) and red gastrocnemius skeletal muscle (B). Data are shown as means + SEM, n= 5–8 per group. *P < 0.05 vs. Ctl Sed (–auranofin), ‡P < 0.05 vs. HFHS + Ex (–auranofin), **P < 0.05 indicates main effect of auranofin within group and §P < 0.05 vs. Ctl + HFHS Sed (+auranofin).
Differential adaptations between heart and SkM within the redox signalling network following HFHS diet and Ex
To determine whether expression of antioxidant genes other than TxnRd2 were differentially affected in heart and SkM by HFHS diet and Ex, a quantitative RT-PCR approach was used to examine the impact of these interventions on a large number of antioxidant/phase II-detoxifying genes. Consistent with the adaptive decrease in mH2O2 observed in heart, the relative mRNA levels of a large number of genes (GCLC, GR, GPx4, NQO1 and TxnRd2) involved in maintaining the reducing power of the intracellular redox environment were elevated in this tissue following both HFHS diet and Ex (Fig. 5A). Within SkM, only GPx4 and NQO1 were upregulated by HFHS diet, and none of the mRNA levels in SkM significantly changed with Ex alone (Fig. 5B). The impact of HFHS diet and Ex on additional antioxidant genes can be viewed in Supplemental Fig. 3.
Figure 5. Redox and anti-inflammatory gene expression in cardiac and skeletal muscle following HFHS diet and/or exercise.
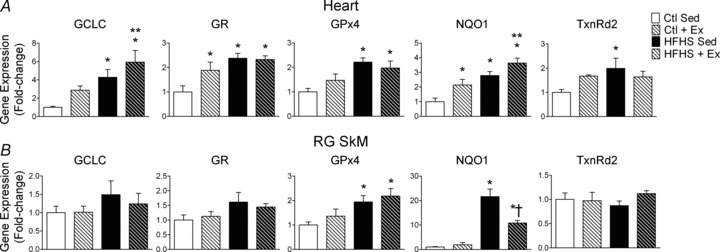
Relative differences in mRNA are shown for the target genes indicated above each panel for cardiac (A) and red gastrocnemius skeletal muscle (B) among all four experimental groups. Data are shown as means + SEM, n= 8–9 per group. *P < 0.05 vs. Ctl Sed, **P < 0.05 vs. Ctl + Ex, †P < 0.05 vs. HFHS Sed.
Given that enzymes are regulated at many levels following transcription, an effort was made to examine whether increased mRNA of TxnRd2 and GR coincided with increased enzyme content and activity. Consistent with the effect of auranofin on mH2O2, TxnRd2 enzyme content increased dramatically in SkM with Ex, and in heart the TxnRd2 enzyme content was increased with both HFHS diet and Ex to an equal extent (Fig. 6A and B). Interestingly, GR activity was reduced in heart with Ex and HFHS diet in comparison to Ctl, but maintained at levels comparable to Ctl with HFHS+Ex (Fig. 6B, Heart). No changes in GR activity with any intervention were observed in SkM. Total glutathione, another indicator of tissue redox status, was largely similar for all groups in both heart and skeletal muscle (Fig. 6C).
Figure 6. Redox enzyme and total glutathione (GSHt) content in cardiac and skeletal muscle following HFHS diet and/or exercise.
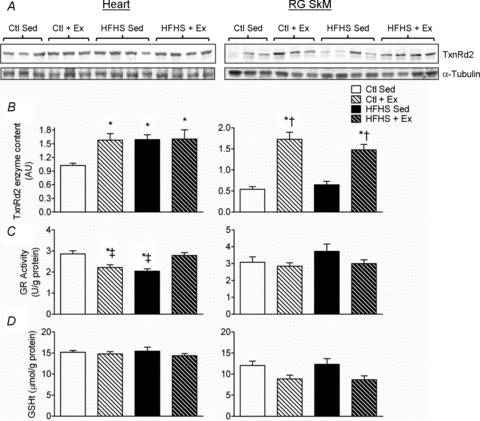
The enzyme activity of TxnRd2 (A) and GR (B), along with GSHt (C) among all four experimental groups are shown for cardiac (left panels) and red gastrocnemius skeletal muscle (right panels). Data are shown as means + SEM, n= 8–9 per group. *P < 0.05 vs. Ctl Sed, ‡P < 0.05 vs. HFHS + Ex, †P < 0.05 vs. HFHS Sed.
Discussion
The goals of this study were to determine the impact of HFHS diet and exercise training on mitochondrial function and redox signalling within heart and skeletal muscle, with specific emphasis being placed on the mechanisms of adaptation. In addition, a systematic experimental approach was used to measure the relative contribution of TxnRd2 to the maintainance of mitochondrial redox status in heart and skeletal muscle following these two interventions. Bearing these objectives in mind, the findings presented in this report are novel and important for a number of reasons. First, this study is, to our knowledge, the first to examine the effect of HFHS diet and exercise training on antioxidant/phase II-detoxification gene expression in heart and skeletal muscle within the same cohort of animals and to show that these tissues have distinctly contrasting redox adaptations in response to HFHS diet. Second, these experiments are the first to demonstrate that HFHS diet and exercise training both lead to decreased mH2O2 in heart due, at least in part, to increased expression and activity of TxnRd2; and the first to demonstrate that TxnRd2 is more efficacious at suppressing mH2O2 by the electron transport system when fatty acids are the predominant oxidative substrate in comparison to the situation when multiple substrates are present. Finally, these findings are the first to show that TxnRd2 is critical for maintaining mitochondrial redox status in skeletal muscle with exercise training.
Given the design of the present study, it is impossible to know conclusively which transcriptional regulators are driving the increased expression of antioxidant/phase II-detoxifying genes in the heart following HFHS diet and exercise training, and it is likely that multiple transcription factors are responsible. Rindler and co-workers investigated antioxidant enzyme changes following a 60% lard-based high-fat diet in mice and observed that catalase enzyme content and activity were markedly induced in cardiac mitochondria following 30 weeks of the diet (Rindler et al. 2012). They also demonstrated that this increase in mitochondrial catalase still occurred after a high-fat diet in the hearts of NF-E2-related factor 2 null and peroxisome proliferator-activated receptor-α null mice, implying that these transcriptional regulators are not mandatory for this adaptation to occur. Although it is somewhat difficult to draw comparisons from that model in relationship to our own, largely due to the differences in the animal model used, dietary composition and the fact that their study was 30 weeks in duration, it is nevertheless important to note that the present results are not completely without precedent. The authors interpreted the high-fat diet-induced increase in cardiac mitochondrial catalase activity to be due to the requirement for augmented mitochondrial antioxidant capacity necessary to offset the increased mH2O2 produced by elevated mitochondrial fatty acid oxidation occurring as a result of the diet. This is a compelling argument, and the present data support this interpretation, given that maximal palmitoyl-carnitine-supported respiration was dramatically increased in the heart with exercise, regardless of the composition of the diet. While catalase expression or activity was not measured in the heart in the present study, it is entirely possible that an increase in mitochondrial catalase partly explains the decreased mH2O2 that was observed in this organ following both HFHS diet and exercise training interventions. By inhibiting TxnRd2 with auranofin in the Ex groups (Ctl and HFHS), cardiac mH2O2 was completely restored to Ctl levels (Fig. 3), but in HFHS Sed group, auranofin did not completely restore mH2O2 to Ctl levels, suggesting that other antioxidant enzymes in addition to TxnRd2 (e.g. catalase) were contributing to offset the cardiac mH2O2 following HFHS diet.
The cardioprotective role of TxnRd2 has been the subject of intense investigation recently, as it has been shown to be critical for preserving the structural integrity and function of mitochondria in various disease states. Within the past year, a role for TxnRd2 in preserving mitochondrial function during postischaemic reperfusion was reported (Horstkotte et al. 2011), as was the effect of TxnRd2 mutations in causing dilated cardiomyopathy (Sibbing et al. 2011). These findings highlight the importance of this antioxidant enzyme to the preservation of myocardial function and vitality in various disease states. This is not entirely surprising when considering the indispensability of TxnRd2 for embryonic cardiac development (Conrad et al. 2004; Conrad, 2009). In this context, the present findings strengthen and support these previous studies by demonstrating that increased TxnRd2 expression and activity underlies cardiac adaptation to nutrient overload, at least in part, and also represents a major mechanism by which exercise decreases mH2O2 in heart and skeletal muscle following exercise training.
Despite the previous studies characterizing the cardioprotective role of TxnRd2 in transgenic mice, very little investigation of the basic biochemistry of this important enzyme has been performed, particularly as it relates to the control of mH2O2 and mitochondrial redox state. Elegant work by Aon's group recently detailed how the Txn2/TxnRd2 redox couple maintains cardiac mitochondrial redox homeostasis in various states of energization (Stanley et al. 2011). The present findings support this work in that inhibition of TxnRd2 increased mH2O2 supported by palmitoyl-carnitine in a submaximal phosphorylating state (i.e. forward electron transport). Importantly, the effect of TxnRd2 inhibition by auranofin becomes most potent after exercise training, especially in skeletal muscle (Figs 3B and 4B), where a 2- to 3-fold increase in TxnRd2 protein exists in this tissue (Fig. 6). However, despite the increased TxnRd2 protein, no change in TxnRd2 mRNA was observed in skeletal muscle with exercise, and this can probably be attributed to the fact that the muscle was dissected ∼14 h after the last bout of exercise, so that any transient upregulation of mRNA following the most recent bout had probably returned to baseline. Regardless of the timing of TxnRd2 expression following exercise, these findings imply that the Txn2/TxnRd2 redox couple is tightly regulated in skeletal muscle and that TxnRd2 is critical for preserving the mitochondrial redox environment in this tissue with exercise training. This makes sense from a standpoint of cellular energetics, because the increase in skeletal muscle fatty acid oxidation that accompanies exercise training would be expected to have the following pronounced impacts on the mitochondrial redox environment: (i) an increase in reducing equivalents, namely NADPH, coming from β-oxidation; and (ii) an increase in mitochondrial superoxide radical production coming also from β-oxidation. From Fig. 6D, it is clear that exercise places an increased burden on the redox balance of skeletal muscle, because the total GSH in this tissue appears to be chronically lower than in sedentary animals. It can also be inferred from these data that skeletal muscle GSH is likely to be strongly coupled with the Txn/TxnRd2 redox couple, to maintain the redox balance in this tissue with exercise training (Aon et al. 2012).
It is also interesting to note that when mitochondria are supplied with a combination of energy substrates, the effect of TxnRd2 inhibition is diminished compared with when fatty acids are the sole substrate (Fig. 4). Inhibition of TxnRd2 did not change mH2O2 at all in sedentary animals when supported by multiple substrates, suggesting that the Txn2/TxnRd2 redox couple is maximally oxidized in this energetic state and that inhibiting TxnRd2 cannot lead to further oxidation and subsequently, more mH2O2. However, the effect of auranofin on mH2O2 was still present in heart and skeletal muscle following exercise training in conditions of multiple substrate oxidation. This may be a reflection of enhanced mitochondrial matrix redox buffering capacity caused by exercise training (or enhanced NADPH coming from β-oxidation, as discussed above), thereby leading to a more reduced Txn2/TxnRd2 redox couple and allowing for the auranofin effect. In any case, the critical role of TxnRd2 in maintaining the mitochondrial redox state in skeletal muscle following exercise training is striking.
It is well known that chronic HFHS diet causes obesity and metabolic syndrome, and indeed, in the present study the increased weight gain, fat mass and fasting glucose/insulin levels indicate that metabolic syndrome is present in the HFHS sedentary rats. Therefore, the implications of these findings with respect to the aetiology of metabolic disease (i.e. insulin resistance) cannot be ignored. What is clear from the data is that the heart has an intrinsic ability to adapt its redox environment in response to nutrient overload, and skeletal muscle does not. Evidence of this striking divergence in adaptability between these two organ systems is manifested by the difference in mitochondrial redox state following HFHS diet. Several reports have now linked increased skeletal muscle mH2O2 to the aetiology of insulin resistance with high-fat diet and/or obesity (Houstis et al. 2006; Anderson et al. 2009b; Hoehn et al. 2009), although currently no cellular mechanisms linking these phenomena to one another have been established. The findings herein support these previous reports and provide new evidence that an inability to augment the endogenous antioxidant network is a major reason why skeletal muscle mH2O2 increases with HFHS diet. Mitochondrial deficiency and/or dysfunction in skeletal muscle has been suggested to be a causal factor in the aetiology of insulin resistance (Petersen et al. 2003; Morino et al. 2005; Befroy et al. 2007). No evidence of mitochondrial deficiency or dysfunction was present following HFHS diet, with the exception of maximal glutamate-supported respiratory capacity, which was markedly diminished in RG following the HFHS diet. While the precise mechanism explaining why this parameter is decreased was not explored in this study, it is plausible that redox modification of α-ketoglutarate dehydrogenase, the rate-limiting enzyme in glutamate oxidation, may be partly responsible for this, particularly given that HNE has been shown to inhibit glutamate-supported respiration in a dose-dependent manner due to inhibition of α-ketoglutarate dehydrogenase (Humphries et al. 1998; McLain et al. 2011).
The observation that exercise training and HFHS diet both increase skeletal muscle mH2O2 to a similar extent was unexpected, although there are several potential reasons to explain this. First, exercise training increased citrate synthase activity (Table 3) and maximal respiratory capacity in skeletal muscle (Fig. 1 and Supplemental Fig. 1), and given that mH2O2 was not normalized to mitochondrial content but rather to tissue dry weight, this represents a substantial reason for the increased mH2O2. Next, the dramatic effect of auranofin on mH2O2 in skeletal muscle following exercise training indicates that sites within the electron transport system are capable of generating an enormous amount of H2O2 following exercise training, but this increased potential for H2O2 production is offset by the enhanced ability of the Txn2/TxnRd2 redox couple to suppress H2O2. The translational significance of the high-fat diet–exercise interaction in the context of insulin sensitivity was also recently explored by Skovbro and co-workers, who showed that 2.5 weeks of high-fat diet in healthy untrained men abolished the exercise-induced increase in maximal skeletal muscle oxidation capacity, but did not have any effects on insulin sensitivity (Skovbro et al. 2011). Although that study did not evaluate exercise training per se, the overall outcome is the same in the present study, where exercise training caused a substantial increase in maximal O2 consumption rates in skeletal muscle, but this was abolished with the HFHS diet (Fig. 1). In any case, the present data show that insulin resistance cannot be linked inextricably to increased mH2O2 in every circumstance because of the fact that heart mH2O2 decreases with HFHS diet despite the presence of insulin resistance. Furthermore, there is the fact that HFHS diet and exercise training both increased mH2O2 in skeletal muscle, which is confounding because the former causes insulin resistance and the latter insulin sensitivity.
To conclude, these findings have outlined a novel mechanism by which heart and skeletal muscle display contrasting responses in redox environment to HFHS diet and exercise training. They have demonstrated a critical role for TxnRd2 in these adaptations and lay groundwork for future studies directed towards exploiting these pathways to prevent and treat cardiovascular and metabolic diseases.
Translational perspective
An increased knowledge of the mechanisms by which nutrient overload (i.e. high-fat, high-sucrose diet) and exercise impact the redox environment of oxidative tissues is mandatory for understanding the causes of cardiovascular and metabolic disease. From a clinical standpoint, the findings of this study are important for a number of reasons. First, they demonstrate that the heart is a unique organ in that it can positively adapt to the increased burden of oxidative stress that accompanies obesity by upregulating endogenous antioxidant/anti-inflammatory enzyme systems, particularly thioredoxin reductase-2, while skeletal muscle cannot. Second, as skeletal muscle insulin resistance with obesity and nutrient overload has been linked to oxidative stress, particularly in mitochondria, the findings of this study are important because they suggest that the inability of skeletal muscle to upregulate these antioxidant systems may contribute to this pathology. Third, these results also provide important clinical insight regarding how heart and skeletal muscle adapt with exercise training, and they outline a critical role for thioredoxin reductase-2 in maintaining the redox balance within these tissues, particularly in skeletal muscle, with this intervention.
In total, this study illustrates novel mechanisms by which cardiac and skeletal muscle adapt to nutrient overload and exercise training, and lays groundwork for future studies directed towards exploiting these adaptive mechanisms to prevent or treat cardiovascular and metabolic diseases.
Translational perspective
An increased knowledge of the mechanisms by which nutrient overload (i.e. high-fat, high-sucrose diet) and exercise impact the redox environment of oxidative tissues is mandatory for understanding the causes of cardiovascular and metabolic disease. From a clinical standpoint, the findings of this study are important for a number of reasons. First, they demonstrate that the heart is a unique organ in that it can positively adapt to the increased burden of oxidative stress that accompanies obesity by upregulating endogenous antioxidant/anti-inflammatory enzyme systems, particularly thioredoxin reductase-2, while skeletal muscle cannot. Second, as skeletal muscle insulin resistance with obesity and nutrient overload has been linked to oxidative stress, particularly in mitochondria, the findings of this study are important because they suggest that the inability of skeletalmuscle to upregulate these antioxidant systems may contribute to this pathology. Third, these results also provide important clinical insight regarding how heart and skeletal muscle adapt with exercise training, and they outline a critical role for thioredoxin reductase-2 in maintaining the redox balance within these tissues, particularly in skeletal muscle, with this intervention.
In total, this study illustrates novel mechanisms by which cardiac and skeletal muscle adapt to nutrient overload and exercise training, and lays groundwork for future studies directed towards exploiting these adaptive mechanisms to prevent or treat cardiovascular and metabolic diseases.
Acknowledgments
The authors would like to thank Jillian Dawkins for assistance with exercising the rats, and Barb Mickelson at Harlan-Teklad for her indispensable assistance with formulating the diets used in this study.
Glossary
- BSA
bovine serum albumin
- Ctl
control diet
- Ex
exercise training
- GCLC
glutamate-cycteine ligase catalytic subunit
- GPx
glutathione peroxidase
- GPx4
glutathione peroxidase 4
- GR
glutathione reductase
- GST-A1
glutathione s-transferase A-1
- HFHS
high-fat, high-sucrose diet
- HNE
4-hydroxynonenal
- HO-1
heme oxygenase-1

O2 consumption
- MDA
malondialdehyde
- mH2O2
mitochondrial H2O2
- NQO1
NAD(P)H:quinone oxidoreductase 1
- PUFA
polyunsaturated fatty acid
- RG
red gastrocnemius
- RNS
reactive nitrogen species
- ROS
reactive oxygen species
- Sed
sedentary
- SkM
skeletal muscle
- TXN
thioredoxin
- Txn2
thioredoxin 2
- TxnRd2
thioredoxin reductase-2
- WG
white gastrocnemius
- 2GSH/GSSG
reduced/oxidized glutathione ratio
Additional information
Competing interests
None declared.
Author contributions
K.H.F.-W. and T.A.M. collected and analysed the data and assisted in manuscript preparation. K.T. and L.A.K. collected and analysed data, J.D.L.F. designed the exercise intervention and directed the diet and exercise interventions, and P.D.N., R.C.H. and C.J.W. provided some financial support. E.J.A. conceived the study, designed the diets and experiments, directed the experiments and wrote the manuscript. All authors approved the final version of the manuscript.
Funding
Funding for this study was provided by National Institutes of Health grants HL098780 to E.J.A. and DK096907 to P.D.N.
Supplementary material
Supplemental Table 1
Supplemental Fig. 1
Supplemental Fig. 2
Supplemental Fig. 3
References
- Adimora NJ, Jones DP, Kemp ML. A model of redox kinetics implicates the thiol proteome in cellular hydrogen peroxide responses. Antioxid Redox Signal. 2010;13:731–743. doi: 10.1089/ars.2009.2968. [DOI] [PMC free article] [PubMed] [Google Scholar]
- Alt N, Carson JA, Alderson NL, Wang Y, Nagai R, Henle T, Thorpe SR, Baynes JW. Chemical modification of muscle protein in diabetes. Arch Biochem Biophys. 2004;425:200–206. doi: 10.1016/j.abb.2004.03.012. [DOI] [PubMed] [Google Scholar]
- Anderson EJ, Kypson AP, Rodriguez E, Anderson CA, Lehr EJ, Neufer PD. Substrate-specific derangements in mitochondrial metabolism and redox balance in the atrium of the type 2 diabetic human heart. J Am Coll Cardiol. 2009a;54:1891–1898. doi: 10.1016/j.jacc.2009.07.031. [DOI] [PMC free article] [PubMed] [Google Scholar]
- Anderson EJ, Lustig ME, Boyle KE, Woodlief TL, Kane DA, Lin CT, Price JW, 3rd, Kang L, Rabinovitch PS, Szeto HH, Houmard JA, Cortright RN, Wasserman DH, Neufer PD. MitochondrialH2O2 emission and cellular redox state link excess fat intake to insulin resistance in both rodents and humans. J Clin Invest. 2009b;119:573–581. doi: 10.1172/JCI37048. [DOI] [PMC free article] [PubMed] [Google Scholar]
- Anderson EJ, Neufer PD. Type II skeletal myofibers possess unique properties that potentiate mitochondrial H2O2 generation. Am J Physiol Cell Physiol. 2006;290:C844–C851. doi: 10.1152/ajpcell.00402.2005. [DOI] [PubMed] [Google Scholar]
- Anderson EJ, Rodriguez E, Anderson CA, Thayne K, Chitwood WR, Kypson AP. Increased propensity for cell death in diabetic human heart is mediated by mitochondrial-dependent pathways. Am J Physiol Heart Circ Physiol. 2011;300:H118–H124. doi: 10.1152/ajpheart.00932.2010. [DOI] [PMC free article] [PubMed] [Google Scholar]
- Anderson EJ, Thayne K, Harris M, Carraway K, Shaikh SR. Aldehyde stress and up-regulation of Nrf2-mediated antioxidant systems accompany functional adaptations in cardiac mitochondria from mice fed n-3 polyunsaturated fatty acids. Biochem J. 2012;441:359–366. doi: 10.1042/BJ20110626. [DOI] [PMC free article] [PubMed] [Google Scholar]
- Anderson EJ, Yamazaki H, Neufer PD. Induction of endogenous uncoupling protein 3 suppresses mitochondrial oxidant emission during fatty acid-supported respiration. J Biol Chem. 2007;282:31257–31266. doi: 10.1074/jbc.M706129200. [DOI] [PubMed] [Google Scholar]
- Aon MA, Stanley BA, Sivakumaran V, Kembro JM, O’Rourke B, Paolocci N, Cortassa S. Glutathione/thioredoxin systems modulate mitochondrial H2O2 emission: an experimental-computational study. J Gen Physiol. 2012;139:479–491. doi: 10.1085/jgp.201210772. [DOI] [PMC free article] [PubMed] [Google Scholar]
- Ascensão A, Ferreira R, Magalhães J. Exercise-induced cardioprotection — biochemical, morphological and functional evidence in whole tissue and isolated mitochondria. Int J Cardiol. 2007;117:16–30. doi: 10.1016/j.ijcard.2006.04.076. [DOI] [PubMed] [Google Scholar]
- Baynes JW. Chemical modification of proteins by lipids in diabetes. Clin Chem Lab Med. 2003;41:1159–1165. doi: 10.1515/CCLM.2003.179. [DOI] [PubMed] [Google Scholar]
- Befroy DE, Petersen KF, Dufour S, Mason GF, de Graaf RA, Rothman DL, Shulman GI. Impaired mitochondrial substrate oxidation in muscle of insulin-resistant offspring of type 2 diabetic patients. Diabetes. 2007;56:1376–1381. doi: 10.2337/db06-0783. [DOI] [PMC free article] [PubMed] [Google Scholar]
- Cao Z, Zhu H, Zhang L, Zhao X, Zweier JL, Li Y. Antioxidants and phase 2 enzymes in cardiomyocytes: chemical inducibility and chemoprotection against oxidant and simulated ischemia-reperfusion injury. Exp Biol Med (Maywood) 2006;231:1353–1364. doi: 10.1177/153537020623100809. [DOI] [PubMed] [Google Scholar]
- Carlberg I, Mannervik B. Glutathione reductase. Methods Enzymol. 1985;113:484–490. doi: 10.1016/s0076-6879(85)13062-4. [DOI] [PubMed] [Google Scholar]
- Conrad M. Transgenic mouse models for the vital selenoenzymes cytosolic thioredoxin reductase, mitochondrial thioredoxin reductase and glutathione peroxidase 4. Biochim Biophys Acta. 2009;1790:1575–1585. doi: 10.1016/j.bbagen.2009.05.001. [DOI] [PubMed] [Google Scholar]
- Conrad M, Jakupoglu C, Moreno SG, Lippl S, Banjac A, Schneider M, Beck H, Hatzopoulos AK, Just U, Sinowatz F, Schmahl W, Chien KR, Wurst W, Bornkamm GW, Brielmeier M. Essential role for mitochondrial thioredoxin reductase in hematopoiesis, heart development, and heart function. Mol Cell Biol. 2004;24:9414–9423. doi: 10.1128/MCB.24.21.9414-9423.2004. [DOI] [PMC free article] [PubMed] [Google Scholar]
- Esterbauer H, Schaur RJ, Zollner H. Chemistry and biochemistry of 4-hydroxynonenal, malonaldehyde and related aldehydes. Free Radic Biol Med. 1991;11:81–128. doi: 10.1016/0891-5849(91)90192-6. [DOI] [PubMed] [Google Scholar]
- Fisher-Wellman KH, Neufer PD. Linking mitochondrial bioenergetics to insulin resistance via redox biology. Trends Endocrinol Metab. 2012;23:142–153. doi: 10.1016/j.tem.2011.12.008. [DOI] [PMC free article] [PubMed] [Google Scholar]
- Frasier CR, Moore RL, Brown DA. Exercise-induced cardiac preconditioning: how exercise protects your achy-breaky heart. J Appl Physiol. 2011;111:905–915. doi: 10.1152/japplphysiol.00004.2011. [DOI] [PubMed] [Google Scholar]
- Go YM, Duong DM, Peng J, Jones DP. Protein cysteines map to functional networks according to steady-state level of oxidation. J Proteomics Bioinform. 2011;4:196–209. doi: 10.4172/jpb.1000190. [DOI] [PMC free article] [PubMed] [Google Scholar]
- Haram PM, Kemi OJ, Lee SJ, Bendheim MØ, Al-Share QY, Waldum HL, Gilligan LJ, Koch LG, Britton SL, Najjar SM, Wisløff U. Aerobic interval training vs. continuous moderate exercise in the metabolic syndrome of rats artificially selected for low aerobic capacity. Cardiovasc Res. 2009;81:723–732. doi: 10.1093/cvr/cvn332. [DOI] [PMC free article] [PubMed] [Google Scholar]
- Hoehn KL, Salmon AB, Hohnen-Behrens C, Turner N, Hoy AJ, Maghzal GJ, Stocker R, Van Remmen H, Kraegen EW, Cooney GJ, Richardson AR, James DE. Insulin resistance is a cellular antioxidant defense mechanism. Proc Natl Acad Sci U S A. 2009;106:17787–17792. doi: 10.1073/pnas.0902380106. [DOI] [PMC free article] [PubMed] [Google Scholar]
- Horstkotte J, Perisic T, Schneider M, Lange P, Schroeder M, Kiermayer C, Hinkel R, Ziegler T, Mandal PK, David R, Schulz S, Schmitt S, Widder J, Sinowatz F, Becker BF, Bauersachs J, Naebauer M, Franz WM, Jeremias I, Brielmeier M, Zischka H, Conrad M, Kupatt C. Mitochondrial thioredoxin reductase is essential for early postischemic myocardial protection. Circulation. 2011;124:2892–2902. doi: 10.1161/CIRCULATIONAHA.111.059253. [DOI] [PubMed] [Google Scholar]
- Houstis N, Rosen ED, Lander ES. Reactive oxygen species have a causal role in multiple forms of insulin resistance. Nature. 2006;440:944–948. doi: 10.1038/nature04634. [DOI] [PubMed] [Google Scholar]
- Humphries KM, Yoo Y, Szweda LI. Inhibition of NADH-linked mitochondrial respiration by 4-hydroxy-2-nonenal. Biochemistry. 1998;37:552–557. doi: 10.1021/bi971958i. [DOI] [PubMed] [Google Scholar]
- Iacobini C, Menini S, Ricci C, Scipioni A, Sansoni V, Mazzitelli G, Cordone S, Pesce C, Pugliese F, Pricci F, Pugliese G. Advanced lipoxidation end-products mediate lipid-induced glomerular injury: role of receptor-mediated mechanisms. J Pathol. 2009;218:360–369. doi: 10.1002/path.2536. [DOI] [PubMed] [Google Scholar]
- Jones DP. Radical-free biology of oxidative stress. Am J Physiol Cell Physiol. 2008;295:C849–C868. doi: 10.1152/ajpcell.00283.2008. [DOI] [PMC free article] [PubMed] [Google Scholar]
- Kemp M, Go YM, Jones DP. Nonequilibrium thermodynamics of thiol/disulfide redox systems: a perspective on redox systems biology. Free Radic Biol Med. 2008;44:921–937. doi: 10.1016/j.freeradbiomed.2007.11.008. [DOI] [PMC free article] [PubMed] [Google Scholar]
- Khanna AK, Xu J, Mehra MR. Antioxidant N-acetyl cysteine reverses cigarette smoke-induced myocardial infarction by inhibiting inflammation and oxidative stress in a rat model. Lab Invest. 2012;92:224–235. doi: 10.1038/labinvest.2011.146. [DOI] [PubMed] [Google Scholar]
- La Favor JD, Anderson EJ, Hickner RC, Wingard CJ. Erectile dysfunction precedes coronary artery endothelial dysfunction in rats fed a high-fat, high-sucrose, Western pattern diet. J Sex Med. 2013;10:694–703. doi: 10.1111/jsm.12001. [DOI] [PMC free article] [PubMed] [Google Scholar]
- McLain AL, Szweda PA, Szweda LI. α-Ketoglutarate dehydrogenase: a mitochondrial redox sensor. Free Radic Res. 2011;45:29–36. doi: 10.3109/10715762.2010.534163. [DOI] [PMC free article] [PubMed] [Google Scholar]
- Morino K, Petersen KF, Dufour S, Befroy D, Frattini J, Shatzkes N, Neschen S, White MF, Bilz S, Sono S, Pypaert M, Shulman GI. Reduced mitochondrial density and increased IRS-1 serine phosphorylation in muscle of insulin-resistant offspring of type 2 diabetic parents. J Clin Invest. 2005;115:3587–3593. doi: 10.1172/JCI25151. [DOI] [PMC free article] [PubMed] [Google Scholar]
- Perry CG, Kane DA, Lin CT, Kozy R, Cathey BL, Lark DS, Kane CL, Brophy PM, Gavin TP, Anderson EJ, Neufer PD. Inhibiting myosin-ATPase reveals a dynamic range of mitochondrial respiratory control in skeletal muscle. Biochem J. 2011;437:215–222. doi: 10.1042/BJ20110366. [DOI] [PMC free article] [PubMed] [Google Scholar]
- Petersen KF, Befroy D, Dufour S, Dziura J, Ariyan C, Rothman DL, DiPietro L, Cline GW, Shulman GI. Mitochondrial dysfunction in the elderly: possible role in insulin resistance. Science. 2003;300:1140–1142. doi: 10.1126/science.1082889. [DOI] [PMC free article] [PubMed] [Google Scholar]
- Powers SK, Ji LL, Leeuwenburgh C. Exercise training-induced alterations in skeletal muscle antioxidant capacity: a brief review. Med Sci Sports Exerc. 1999;31:987–997. doi: 10.1097/00005768-199907000-00011. [DOI] [PubMed] [Google Scholar]
- Powers SK, Lennon SL. Analysis of cellular responses to free radicals: focus on exercise and skeletal muscle. Proc Nutr Soc. 1999;58:1025–1033. doi: 10.1017/s0029665199001342. [DOI] [PubMed] [Google Scholar]
- Rindler PM, Plafker SM, Szweda LI, Kinter M. High dietary fat selectively increases catalase expression within cardiac mitochondria. J Biol Chem. 2012;288:1979–1990. doi: 10.1074/jbc.M112.412890. [DOI] [PMC free article] [PubMed] [Google Scholar]
- Saks VA, Veksler VI, Kuznetsov AV, Kay L, Sikk P, Tiivel T, Tranqui L, Olivares J, Winkler K, Wiedemann F, Kunz WS. Permeabilized cell and skinned fiber techniques in studies of mitochondrial function in vivo. Mol Cell Biochem. 1998;184:81–100. [PubMed] [Google Scholar]
- Schafer FQ, Buettner GR. Redox environment of the cell as viewed through the redox state of the glutathione disulfide/glutathione couple. Free Radic Biol Med. 2001;30:1191–1212. doi: 10.1016/s0891-5849(01)00480-4. [DOI] [PubMed] [Google Scholar]
- Shanmugam N, Figarola JL, Li Y, Swiderski PM, Rahbar S, Natarajan R. Proinflammatory effects of advanced lipoxidation end products in monocytes. Diabetes. 2008;57:879–888. doi: 10.2337/db07-1204. [DOI] [PMC free article] [PubMed] [Google Scholar]
- Sibbing D, Pfeufer A, Perisic T, Mannes AM, Fritz-Wolf K, Unwin S, Sinner MF, Gieger C, Gloeckner CJ, Wichmann HE, Kremmer E, Schäfer Z, Walch A, Hinterseer M, Näbauer M, Kääb S, Kastrati A, Schömig A, Meitinger T, Bornkamm GW, Conrad M, von Beckerath N. Mutations in the mitochondrial thioredoxin reductase gene TXNRD2 cause dilated cardiomyopathy. Eur Heart J. 2011;32:1121–1133. doi: 10.1093/eurheartj/ehq507. [DOI] [PubMed] [Google Scholar]
- Skovbro M, Boushel R, Hansen CN, Helge JW, Dela F. High-fat feeding inhibits exercise-induced increase in mitochondrial respiratory flux in skeletal muscle. J Appl Physiol. 2011;110:1607–1614. doi: 10.1152/japplphysiol.01341.2010. [DOI] [PubMed] [Google Scholar]
- Stanley BA, Sivakumaran V, Shi S, Macdonald I, Lloyd D, Watson WH, Aon MA, Paolocci N. Thioredoxin reductase-2 is essential for keeping low levels of H2O2 emission from isolated heart mitochondria. J Biol Chem. 2011;286:33669–33677. doi: 10.1074/jbc.M111.284612. [DOI] [PMC free article] [PubMed] [Google Scholar]
- Tamion F, Richard V, Lacoume Y, Thuillez C. Intestinal preconditioning prevents systemic inflammatory response in hemorrhagic shock. Role of HO-1. Am J Physiol Gastrointest Liver Physiol. 2002;283:G408–G414. doi: 10.1152/ajpgi.00348.2001. [DOI] [PubMed] [Google Scholar]
- Tietze F. Enzymic method for quantitative determination of nanogram amounts of total and oxidized glutathione: applications to mammalian blood and other tissues. Anal Biochem. 1969;27:502–522. doi: 10.1016/0003-2697(69)90064-5. [DOI] [PubMed] [Google Scholar]
- Toyokuni S, Yamada S, Kashima M, Ihara Y, Yamada Y, Tanaka T, Hiai H, Seino Y, Uchida K. Serum 4-hydroxy- 2-nonenal-modified albumin is elevated in patients with type 2 diabetes mellitus. Antioxid Redox Signal. 2000;2:681–685. doi: 10.1089/ars.2000.2.4-681. [DOI] [PubMed] [Google Scholar]
- Tsien RY. Fluorescent indicators of ion concentrations. Methods Cell Biol. 1989;30:127–156. doi: 10.1016/s0091-679x(08)60978-4. [DOI] [PubMed] [Google Scholar]
-
Wisløff U, Helgerud J, Kemi OJ, Ellingsen Ø. Intensity-controlled treadmill running in rats:
 and cardiac hypertrophy. Am J Physiol Heart Circ Physiol. 2001;280:H1301–H1310. doi: 10.1152/ajpheart.2001.280.3.H1301. [DOI] [PubMed] [Google Scholar]
 - Yeh CT, Yen GC. Induction of hepatic antioxidant enzymes by phenolic acids in rats is accompanied by increased levels of multidrug resistance-associated protein 3 mRNA expression. J Nutr. 2006;136:11–15. doi: 10.1093/jn/136.1.11. [DOI] [PubMed] [Google Scholar]
- Yonehara K, Suzuki M, Yamanouchi K, Nishihara M. Expression analyses of sex steroid-regulated genes in neonatal rat hypothalamus. J Reprod Dev. 2003;49:547–552. doi: 10.1262/jrd.49.547. [DOI] [PubMed] [Google Scholar]
Associated Data
This section collects any data citations, data availability statements, or supplementary materials included in this article.