

Abstract
A long-term sodium nitrite infusion is intended for the treatment of vascular disorders. Phase I data demonstrated a significant nonlinear dose-exposure-toxicity relationship within the therapeutic dosage range. This study aims to develop a quantitative systems pharmacology model characterizing nitric oxide (NO) metabolome  and methemoglobin after sodium nitrite infusion. Nitrite, nitrate, and methemoglobin concentration–time profiles in plasma and RBC were used for model development. Following intravenous sodium nitrite administration, nitrite undergoes conversion in RBC and tissue. Nitrite sequestered by RBC interacts more extensively with deoxyhemoglobin, which contributes greatly to methemoglobin formation. Methemoglobin is formed less-than-proportionally at higher nitrite doses as characterized with facilitated methemoglobin removal. Nitrate-to-nitrite reduction occurs in tissue and via entero-salivary recirculation. The less-than-proportional increase in nitrite and nitrate exposure at higher nitrite doses is modeled with a dose-dependent increase in clearance. The model provides direct insight into NO metabolome disposition and is valuable for nitrite dosing selection in clinical trials.
The effect of nitric oxide (NO) as a vasodilator agent has been studied in vascular homeostasis and pathology. NO is synthesized in the arterial vascular endothelium, undergoes oxidative and reductive reactions, and yields endogenous metabolites: nitrite  and nitrate
  .1 Nitrite and nitrate serve as NO reservoirs in blood and transport it for delivery to various tissues and organs2,3 due to NO's short half-life in blood (< 2 ms) and limited diffusional capability.4 Under normal physiological conditions, NO concentrations range from 0.01 nM to 1 µM.4 In contrast, endogenous nitrite and nitrate are found in the nanomolar and millimolar range,5 which facilitates their role as NO donors. Unlike therapeutic nitrates (e.g., nitroglycerin) that may be associated with tolerance,6 administration of therapeutic nitrite does not show tolerance and has been proposed for the treatment of cardiovascular diseases.7 Preclinical and clinical studies have shown that nitrite administration produces vasodilation, cytoprotection after ischemia reperfusion injury, and blood pressure reduction.1
Two clinical studies have evaluated the safety of nitrite as a NO donor for human administration by short-term infusion.8,9 Nitrite readily diffuses into RBC and interacts with hemoglobin;10 thus, the characterization of nitrite uptake and release by RBC plays an important role not only in describing nitrite disposition, but also in understanding the pharmacodynamics of RBC as a vehicle to transport nitrite. Hemoglobin-nitrite interactions form NO, nitrate, and methemoglobin11 (Figure 1). Methemoglobin, formed by hemoglobin oxidation, does not bind oxygen due to the ferric state of iron in the heme molecule. Under normal physiological conditions, methemoglobin is present in trace amounts (≤ 1%); however, injury or oxidizing agents including nitrite may convert hemoglobin into methemoglobin, which increases methemoglobin concentrations. Therefore, a methemoglobin level above 5% is used as a marker for nitrite-related toxicity9,12.
Figure 1.

Nitrite–hemoglobin interactions in RBC.
Hon et al.9 characterized the kinetics of nitrite, nitrate, methemoglobin, and iron-nitrosyl hemoglobin (HbNO) in plasma and RBC in normal volunteers following intra-arterial short-term infusion of sodium nitrite incrementing from 42 to 6,600 μg/kg/h at 5 min intervals, and provided valuable insights into nitrite–hemoglobin interactions. Nitrite in plasma declined biexponentially, and returned back to baseline concentrations 3 h after infusion cessation.8,9 Concentrations of nitrate declined slower than those of nitrite. The methemoglobin rise was lower than expected at higher nitrite doses, which suggested nonlinearity in methemoglobin dynamics, and was described using two rate constants,9 limiting the model application to studies with alternative dosing regimens.
Because therapeutic application of sodium nitrite will require prolonged infusions, a Phase I trial was performed to assess the safety and PK of increasing doses of sodium nitrite in normal volunteers during a 48-h intravenous infusion.12 This study revealed that nitrite PK after short-term and long-term infusion was different. Nitrite systemic exposure in plasma increased less-than-proportionally at higher doses, which indicated a nonlinear PK. Methemoglobin concentrations also increased less-than-proportionally with increasing sodium nitrite doses, which suggested a nonlinear nitrite-exposure-toxicity relationship. The observed nonlinearity has not been well characterized and along with high variability observed in nitrite exposure and toxicity between subjects, it poses a great challenge to appropriately select therapeutic doses for the patient population.
To this end, we developed a multiscale systems pharmacology model to broaden the understanding of such complexity and provide a quantitative pharmacological guide to determine optimal dosing regimens. Our model adequately characterizes NO metabolome and methemoglobin concentrations at eight different sodium nitrite doses while considering the contributions of major components in the nitrite–hemoglobin system. The application of the developed model in sodium nitrite dosage selection may prove valuable in the clinical setting.
Results
Normal volunteer data
Concentrations of nitrite and nitrate in plasma and RBC, and methemoglobin were obtained from normal volunteers during and after a 48-h sodium nitrite infusion at escalating doses that ranged from 4.2 to 533.8 μg/kg/h (n = 12).12 Data from one subject who received 533.8 μg/kg/h were excluded because of observed asymptomatic toxicity. Similarly, in another subject who received 445.7 μg/kg/h administration was stopped 3.2 h after infusion started because of toxicity and only available data were included. Nitrite and nitrate RBC concentrations of subjects who received doses from 4.2 to 133.4 9 μg/kg/h (n = 6) were not available for analysis. A total of 333 plasma concentrations and 147 RBC concentrations of nitrite and nitrate, and 333 methemoglobin concentrations were used for model development.
Structure model selection
Typical representative individual concentration–time profiles of nitrite and nitrate in plasma and RBC as well as methemoglobin at maximal-tolerated dose (266.9 μg/h/kg) are shown in Figure 2. During the 48-h infusion, nitrite concentrations in plasma and RBC quickly reached a plateau within 6 h, while nitrate slowly reached plateau by 12 h. Methemoglobin rose slowly, reaching a maximum level within 12 h. Only one subject who received 445.7 μg/kg/h showed asymptomatic methemoglobin concentrations above 5% immediately after the infusion ended. Plasma nitrite, plasma nitrate, and methemoglobin concentrations did not increase proportionally with increasing nitrite doses, which indicate dose-exposure-toxicity nonlinearity. Plasma and RBC nitrite concentrations rapidly returned to preinfusion concentrations. Plasma and RBC nitrate and methemoglobin concentrations remained elevated and increased immediately after the infusion ended before slowly returning to preinfusion concentrations.
Figure 2.

Observed and model-predicted concentration–time profiles for nitrite and nitrate in plasma and RBC and methemoglobin after administration of maximal-tolerated dose (266.9 μg/h/kg) for 48 h.
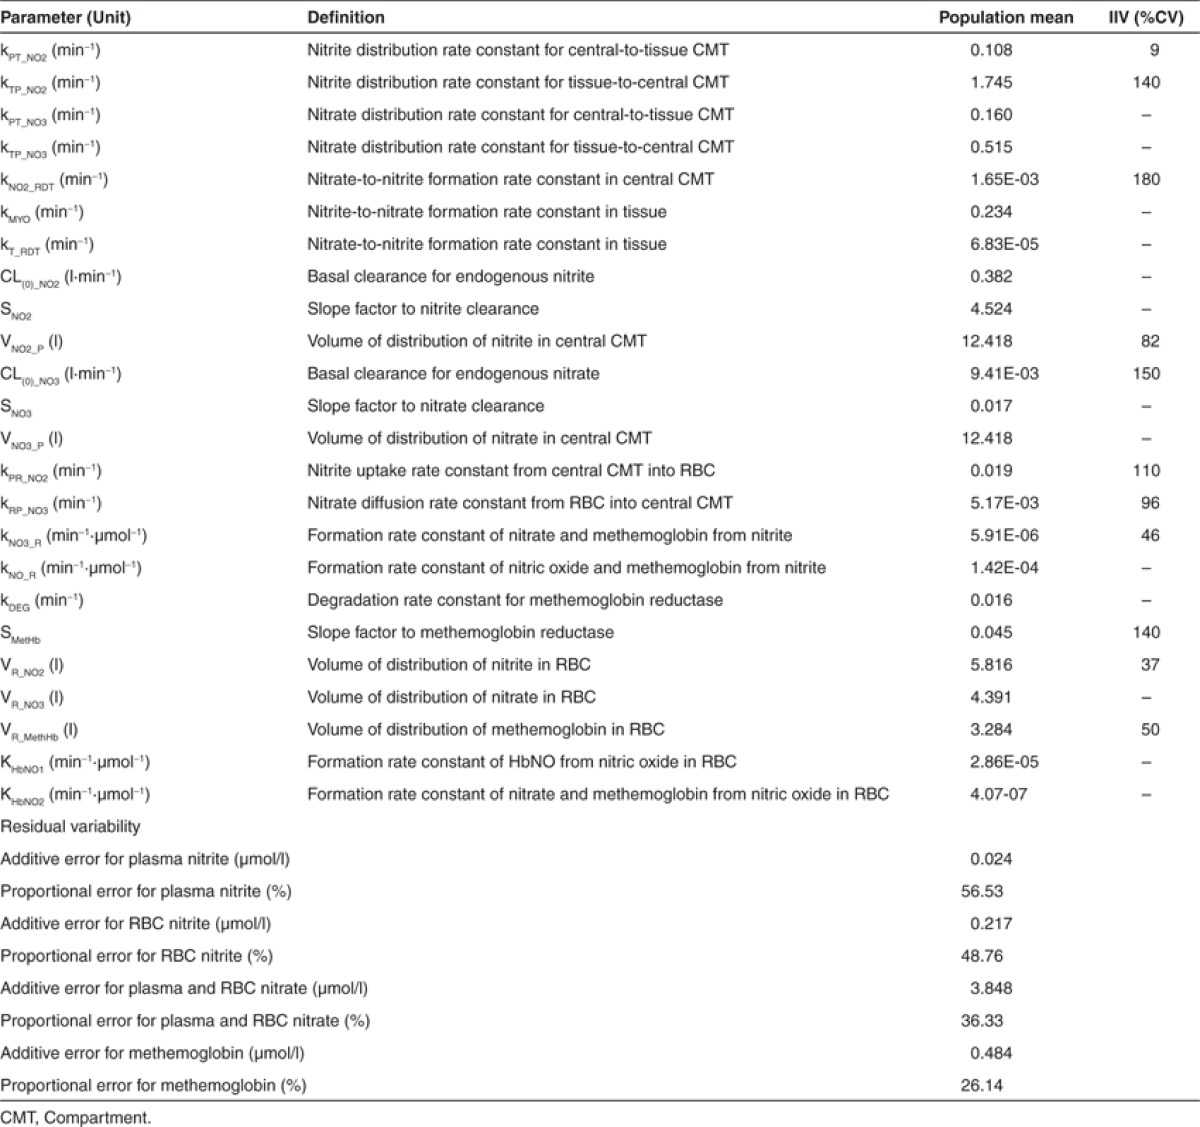
Individual time profiles of nitrite and nitrate in plasma and RBC and methemoglobin were fitted simultaneously to the proposed model (Figure 3). The developed model adequately described NO metabolome and methemoglobin disposition after a 48-h infusion of increasing nitrite doses. The final model parameters are summarized in Table 1. Key features of our final model include concentration-dependent increase in nitrite and nitrate clearance, nitrate entero-salivary recycling, and facilitated methemoglobin removal as described in detail below.
Figure 3.

The quantitative systems pharmacology model of nitric oxide metabolome and methemoglobin. Dotted arrows and open boxes indicate stimulation process. Shaded compartments represent variables that were experimentally measured and open compartments represent variables with no measurements.
Table 1. Summary of model parameter estimates.
Nitrite and nitrate disposition in plasma and tissue
The less-than-proportional increase in nitrite and nitrate systemic exposure was explained by a concentration-dependent increase in clearance using a linear model. Increase in clearance was presumably due to saturable renal reabsorption at higher nitrite doses.13 At maximal-tolerated dose, renal clearance was 1.159 l/min for nitrite and 0.014 l/min for nitrate, which was twofold and 1.5-fold higher than renal clearances at baseline. Overall, the contribution of the renal excretion pathway of nitrite is small at endogenous levels as most of the excreted nitrite is reabsorbed (> 96%).13 However, as renal reabsorption of nitrite is saturated at higher concentrations, nitrite renal elimination becomes important and is needed in the final model to avoid nitrite systemic overestimation. Nitrite metabolism by heme carriers, for example, myoglobin, CYP450, occurs in tissue under physiological conditions14 and it was estimated to be 0.234 min-1(kMYO).
Although nitrate is a nitrite metabolite subject to renal excretion, nitrate can be reduced back into nitrite via entero-salivary recirculation or reductase endogenously present in tissue. After dietary consumption (approximately 1–2 mmols per day),15 nitrate is rapidly absorbed in the upper gastrointestinal tract, accumulated in saliva, and reduced into nitrite by nitrate reductases in commensal microflora (e.g., Vionella spp). Some of the newly formed nitrite in saliva reaches the stomach and is reduced into NO or absorbed into the blood to interact with hemoglobin.1,15 In our study, three subjects had high nitrate concentrations at predose (30.33 ± 10.20 μmol/l) and high plasma nitrite concentrations early after the initiation of infusion (Figure 4). Those subjects had higher nitrate value compared with the normal baseline (10.78 ± 1.33 μmol/l) to accommodate the dietary effect. We attempted to incorporate entero-salivary compartments that connected from plasma nitrate to plasma nitrite via additional transit compartments to represent physiological pathways in the gut and saliva. However, a simpler approach representing direct conversion of nitrate via a first-order process (kNO2_RDT) provided similar improvement. Our model suggests that nitrate is reduced back into nitrite more readily via entero-salivary recirculation (1.65 × 10⁻³ min-1) than in tissue by means of xanthine oxidoreductase (6.83 × 10⁻⁵ min-1).16
Figure 4.

Observed and model predicted concentration–time profiles for plasma nitrate (a) and nitrite (b) in a subject with evidence of the entero-salivary circulation.
Nitrite RBC uptake and nitrite–hemoglobin interaction
Nitrite is rapidly sequestered by RBC and interacts to a greater extent with deoxyhemoglobin than oxyhemoglobin (1.42 × 10⁻⁴ vs. 5.91 × 10⁻⁶ min-1·µmol-1), which contributes more extensively to methemoglobin formation, similar to deoxyhemoglobin/oxyhemoglobin-nitrite interactions in vitro.17 In addition, a small fraction (4.61%) of hemoglobin-nitrite-derived NO contributes to methemoglobin formation via oxyhemoglobin, similar to observations in vitro that characterized NO consumption in RBC.18 Our results suggest these interactions occur in vivo, which may contribute to greater NO production and NO-dependent vasodilation.19 While nitrite–hemoglobin interactions are described with a second-order rate constant given hemoglobin abundance compared to nitrite, nitrite-deoxyhemoglobin (kNO_R·[deoxyHb] = 1.65 min-1), and nitrite-oxyhemoglobin interactions (kNO3_R·[oxyHb] = 0.234 min-1) may behave as a pseudo-first-order process depending on nitrite's availability. However, a second-order rate constant can account for interindividual variability (IIV) in hemoglobin concentrations and allow characterizing ischemia in the patient population.
Methemoglobin was formed less-than-proportionally at higher nitrite doses, which suggests either less formation or facilitated removal.9 In our model, methemoglobin reductase activity (kMR(t)) was induced to prevent methemoglobin accumulation.20 The turnover of methemoglobin reductase activity was described by the indirect response model (IDR),21,22 and the enzyme activity was stimulated by methemoglobin in a linear fashion. The sensitivity term of methemoglobin reductase activity (SMetHb) may explain the unexpected increase in methemoglobin concentrations in one subject during infusion of a low dose (4.2 μg/kg/h).12 The estimated SMetHb value for this subject was 73% lower than the population mean (0.045) resulting in less active methemoglobin reductase and consequently, higher methemoglobin concentrations. Similarly, one subject receiving 445.7 μg/kg/h showed higher-than-expected methemoglobin concentrations and a SMetHb term 88% lower than the population mean. Alternatively, subjects with high SMetHb values have higher sensitivity to activate methemoglobin reductase and are likely to produce less methemoglobin as seen in subjects who received doses from 8.3 to 66.8 μg/kg/h and whose SMetHb was twice to four times higher than the population mean. Overall, SMetHb values ranged from 0.0054 to 0.171, which were reflected in the high IIV for SMetHb (> 100%). We also tested limiting methemoglobin formation with an upper tolerable-bound serving as a physiological limit.23 However, facilitating the removal of methemoglobin improved the overall fitting and was therefore incorporated into the final model.
Covariate analysis
Potential relationships between model parameters (i.e., nitrite distribution to tissue compartment, nitrate formation in plasma, clearance of nitrate and methemoglobin) and relevant covariates (body weight, gender, and age) on NO metabolome disposition were tested; however, no statistically significant covariate was identified. We observed relationships among covariates (a negative correlation between age and nitrite infusion rate, and higher infusion rate for females than for males) which appeared to be an unintended result of the study design and were carefully considered during covariate analysis.
Model evaluation
Goodness-of-fit plots (Figure 5) show that model predictions were in close agreement with the observed NO metabolome and methemoglobin concentrations. Population and individual predicted concentrations showed adequate distribution around the unity line (Figure 5a,b). However, model-predicted population data were slightly overestimated for plasma nitrite and high RBC nitrate and methemoglobin concentrations observed immediately after infusion termination were underestimated. The individual weighted residuals did not reflect systemic deviations (Figure 5c,d). The prediction-corrected visual predictive checks revealed that the final model predictions were in a reasonable agreement with the observed values (Supplementary Figure S1 online). As the covariance step did not converge successfully, no standard errors and correlation matrix could be obtained, which underscores the degree of remaining uncertainty regarding the parameter estimates. The bootstrapping was not practically feasible due to computational limitations. We used the REPEAT option in NONMEM to assess the reliability of the final estimates and identified kPT_NO3 (79%), kTP_NO3 (80%), and kNO2_RDT (72%) to be the most variable parameters. Future studies with more data may be necessary to corroborate our findings.
Figure 5.

Goodness of fit plots for population and individual predictions including observed vs. population-predicted (a) and individual-predicted concentrations (b); and individual weighted residuals vs. individual predicted concentrations (c), or time (d). Solid lines represent the line of unity.
Discussion
We developed a physiological, systems pharmacology-based model to describe the disposition of nitrite, nitrate, and methemoglobin in plasma and RBC. The model explains nitrite–hemoglobin interactions and nonlinearity in dose-exposure-toxicity relationships after a long-term sodium nitrite infusion to healthy volunteers.
Previous studies have reported renal excretion as the main elimination pathway for NO metabolic species.5,13,24 Renal clearance of nitrate/nitrite in dogs was dose dependent after sodium nitrate administration due to increases in nitrate/nitrite urinary excretion as nitrate doses increased from 0 to 40 μg·min-1·kg-1 while the amount reabsorbed back into circulation progressively decreased from 97 to 84.6%.13 In previous studies that assessed nitrite PK in normal volunteers, dose dependency was not observed since high doses were administered and different dosages were not evaluated separately.8,9 We observed lower systemic exposure of nitrite than expected, which suggested accelerated elimination, similar to previous findings in normal volunteers with higher than expected nitrate urinary excretion after nitrate ingestion.5,24 The CLR_NO3 (0.010 l·min-1)5 was in close agreement with the CLR_NO3 we estimated at similar doses (0.013 l·min−1). We attempted to use a physiologically-based model to describe nitrite and nitrate clearances and define renal clearance as  , where
  represents nitrite/nitrate filtration and tubular secretion before reabsorption. Then, fractional reabsorption
  would decrease from its basal tubular reabsorption (97%),13 and clearance would increase with higher nitrite doses. Although our study has a wide range of doses, we were unable to use this approach or the Michaelis-Menten equation due to the limited number of subjects, and instead used a simpler model.
Hon et al. reported that incorporating nitrate-to-nitrite conversion pathway did not show overall improvement, suggesting this is a relatively insignificant metabolic pathway during short-term nitrite infusion.9 However, a significant improvement in overall fitting and reduction in objective function value (OFV) (dOFV = -125.81) was observed by including this pathway after long-term infusion. The necessity of nitrate-to-nitrite conversion was also evident from three subjects whose initial plasma nitrite and nitrate concentrations were higher than expected and from experiments using antiseptic mouthwash in rats25 and humans.26 In humans, rinsing the mouth with antibacterial mouthwash prior to nitrate load abolished plasma nitrite rise up to 80% without changing nitrate accumulation in saliva, which suggests that nitrate-to-nitrite recycling pathways play an important role as recurring plasma nitrite sources27,28,29 during prolonged nitrite administration. This observation suggests that nitrate-rich food consumption during treatment with nitrite should be controlled.
The previous study with two short-term nitrite infusions showed that methemoglobin was lower during the second infusion than during the first infusion, which was modeled by two methemoglobin formation rates (0.155 vs. 0.090 min-1).9 Methemoglobin formation is tightly regulated to maintain homeostasis,23 and its excessive accumulation is prevented by increased methemoglobin reductase activity,20 which our model incorporated to describe the less-than-proportional increase in methemoglobin with increasing nitrite doses. kMR(t) and SMetHb explained the higher than expected increases in methemoglobin in two subjects. Individuals with lower enzyme activity (kMR(t)) or with less enzyme induction capability (SMetHb) may experience higher methemoglobin increase than expected. Concentrations of methemoglobin reductase may be measured in future studies to corroborate these results.
Nitrite–hemoglobin interaction mechanisms are rather complex and have not been well established in vivo. Various hypotheses have tried to describe nitrite uptake into RBC. For instance, nitrite uptake into RBC may be the result of carrier-mediated nitrite anion  uptake11 or nitrous acid diffusion.10,30 These hypotheses were tested in our model but no improvements were observed in the accuracy of model predictability. Similarly, nitrite–hemoglobin and NO-hemoglobin interactions result in a number of intermediate reactions that have been widely studied in vitro,17,18,31,32 but addition of intermediate steps did not show improvements in the model, similar to previous findings in rats that represented full cycles as a single step.33 Additionally, nitrite-myoglobin interactions need to be further investigated in vivo.34
Several RBC NO release mechanisms have been proposed. Nitrite compartmentalization near the RBC membrane may facilitate a localized reaction between deoxyhemoglobin and nitrite for NO release2 with a diffusional barrier formed by methemoglobin.11 A second model suggests the formation and diffusion of a less-reactive intermediate nitrosating agent such as dinitrogen trioxide.35,36 Other mechanisms involve S-nitrosothiol or HbNO formation which preserve and transport NO18,37,38,39 and escape RBC easily.40 It is possible that NO uses various mechanisms to escape RBC, reach vascular endothelium, and exert its vasodilatory effect.41 The next important step would be to identify which NO species would correlate with the observed vasodilatory effect and to incorporate such mechanism to build a comprehensive PK/PD model that could be used in optimal therapeutic dosing selection.
A limitation of our study was the small number of subjects overall and per-dose, which prevented us from exploring potential models that might better explain the observed data. We were unable to incorporate intermediate reactions steps, which might be responsible for the abrupt peaks in some nitrite and nitrate concentration–time profiles. The selection of the final model was on the basis of finding a balance between mechanistic detail and the parsimonious nature of modeling, given the data.42 This could partially explain the degree of remaining residual error and uncertainty of some parameter estimates, which underlines the shortcomings of the present analysis and the need for more work to be done in the future.
In summary, this study represents a quantitative systems pharmacology model for NO metabolome characterizing the time profiles of nitrite, nitrate and methemoglobin following a long-term intravenous infusion of sodium nitrite in healthy volunteers. Our study suggests that nitrate-nitrite recirculation via the entero-salivary pathway may influence nitrite concentrations and needs to be controlled. As methemoglobin serves as a toxicity measure, pre-evaluation of methemoglobin reductase activity may be useful to assess tolerability to methemoglobin rise upon nitrite administration. Inclusion of major nitrite-related hemoglobin species could be important to account for varying concentrations of hemoglobin oxygenation status, especially when implementing to patients with low oxygenation conditions (e.g., ischemia). The present model provides important insights into the nitrite–hemoglobin interactions and the nonlinear disposition of nitrite, nitrate and methemoglobin in humans. The application of our model in sodium nitrite dosage selection for patient population will be valuable in clinical development.
Methods
Study design. The data were obtained from a Phase I dose escalation study.12 The study design, informed consent and ethics procedures, and clinical results have been reported elsewhere.12 Twelve healthy individuals aged 21–56 years old (39 ± 9), weighing 49–115 kg (77.8 ± 19) were intravenously infused with escalating sodium nitrite doses at 4.2 (n = 1), 8.3 (n = 1), 16.7 (n = 1), 33.4 (n = 1), 66.8 (n = 1), 133.4 (n = 1), 266.9 (n = 3, maximal-tolerated dose), 445.7 (n = 2), and 533.8 (n = 1) μg/h/kg for 48 h (Supplementary Figure S2 online). Concentrations of nitrite, nitrate and methemoglobin in plasma and RBC were measured using chemiluminescence and gas chromatography-mass spectrometry methods previously described.12
Pharmacokinetic analysis. Population PK model development and simulations were performed using NONMEM ver. 7.2. (ICON Development Solutions, Ellicott City, MD). NONMEM was compiled by Intel Visual Fortram Compiler 11.0 compiler (Intel Corporation, Santa Clara, CA) on a Window Server 2008 R2 operating system. NONMEM PREDPP library subroutines ADVAN8 with TOL 4 were used. Nitrite, nitrate, and methemoglobin in plasma and RBC were fitted simultaneously to the proposed model shown in Figure 3. The model included distribution and interconversion in tissue, uptake into RBC, and nitrite–hemoglobin interactions for methemoglobin and RBC nitrate formation. The model development process is presented in Supplementary Table S1 online.
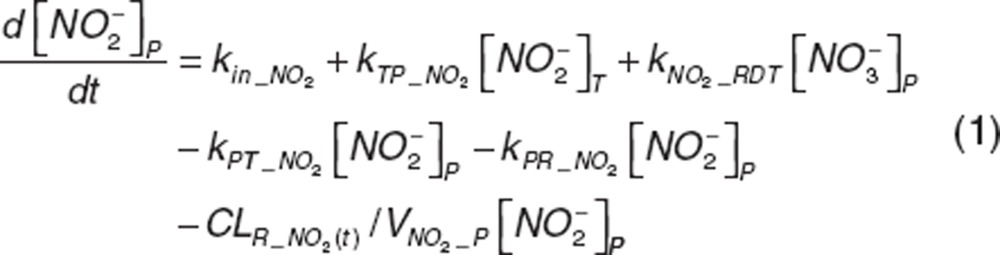
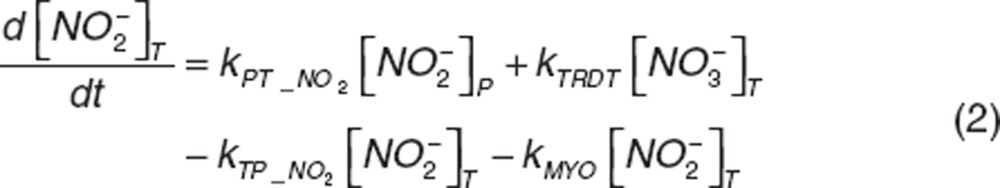
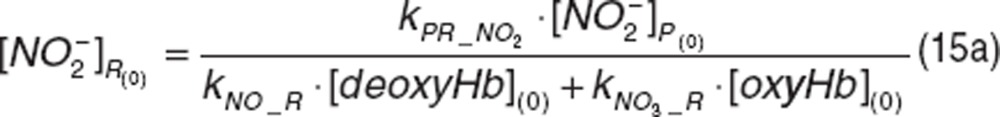
Nitrite and nitrate disposition in plasma and tissue. Upon nitrite administration, nitrite in plasma diffuses into RBC (kPR_NO2), distributes into tissue (kPT_NO2 and kTP_NO2), or is directly eliminated (CLR_NO2). Nitrate in plasma distributes into tissue (kPT_NO3 and kTP_NO3) or is directly eliminated (CLR_NO3). Nitrite in tissue may undergo oxidation (kMYO) by heme-carriers such as myoglobin. The differential equations for plasma and tissue nitrite and nitrate are:
 |
 |
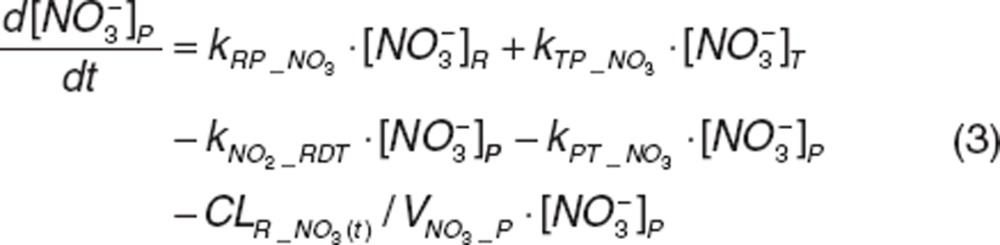 |
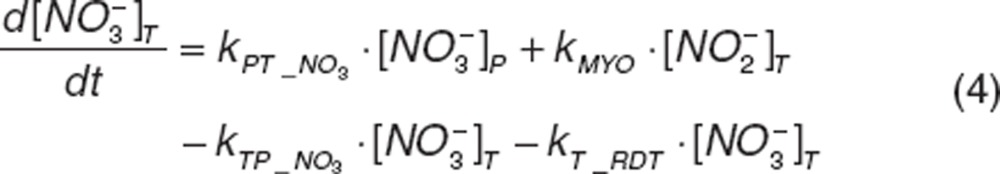 |
where  and
and  represent nitrite and nitrate amount in central compartment, and
  and
and  represent nitrite and nitrate amount in tissue. VNO2_P and VNO3_P represent the volumes of distribution for nitrite and nitrate in the central compartment.
The increase in nitrite and nitrate clearances with increasing concentrations12 was described with a linear slope factor, SNO2 or SNO3, in which renal clearance (CLR_NO2(t) and CLR_NO3(t)) increased from their basal clearance (CL(0)_NO2 and CL(0)_NO3) at endogenous concentrations, depending on the change in nitrite  or nitrate
  concentrations:
 |
 |
As nitrite is endogenously present,43 kin_NO2 represents a zero-order production rate of endogenous nitrite, defined as a secondary parameter:
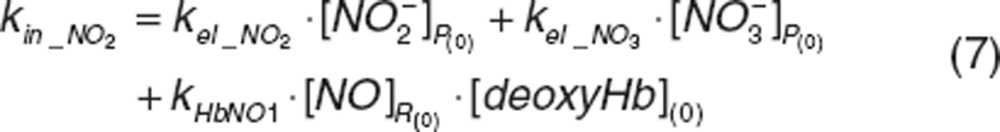 |
where kel_NO2 and kel_NO3 correspond to first-order elimination rate constant of nitrite and nitrate at baseline and are defined as CL(0)_NO2/VNO2_P and CL(0)_NO3/VNO3_P.
In our data, three out of 12 subjects started with higher predose nitrate concentrations compared with baseline and higher plasma nitrite concentrations at the early phase of the infusion. As nitrate converts back to nitrite via entero-salivary recycling by means of nitrate reductase,1,24 we incorporated a first-order rate constant (kNO2_RDT). Similarly, tissue nitrate can also be converted back into nitrite (kT_RDT).43
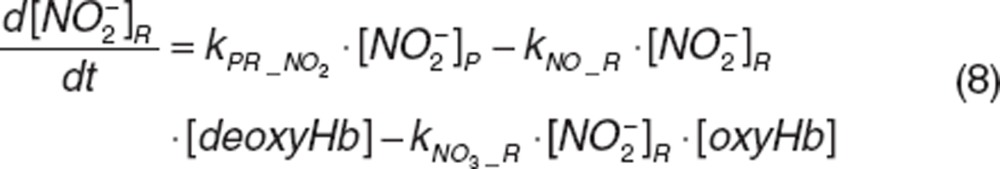
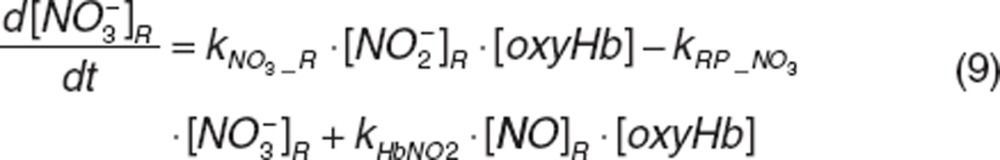
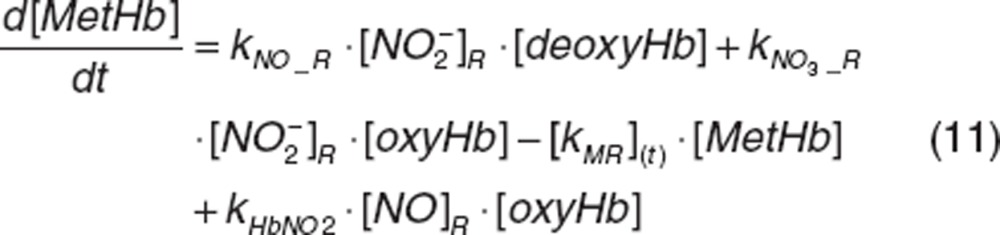
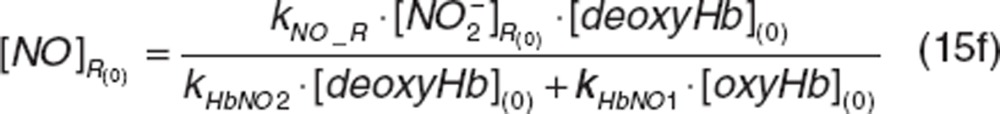
Nitrite and nitrate in RBC. Once nitrite in plasma diffuses into RBC (kPR_NO2), it interacts with deoxyhemoglobin (deoxyHb) to form NO and methemoglobin (MetHb), and with oxyhemoglobin (oxyHb) to form nitrate and methemoglobin, which was depicted by the second-order rate constants kNO_R and kNO3_R. Nitrite-derived NO interacts with deoxyhemoglobin and oxyhemoglobin to form HbNO (kHbNO1) or methemoglobin and nitrate (kHbNO2). The nitrate formed in RBC diffuses back into plasma (kRP_NO3). The differential equations for RBC nitrite and nitrate are:
 |
 |
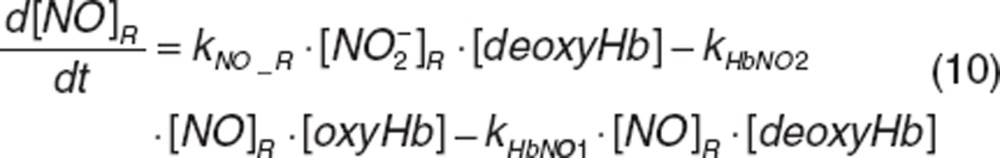 |
where  ,
,  , and
, and  represent nitrite, nitrate, and NO amount in RBC.
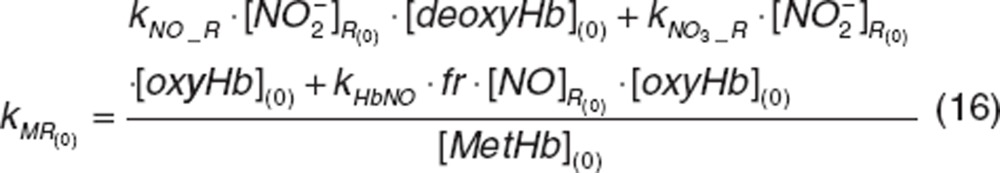
Methemoglobin formation and loss. Methemoglobin results from interactions between nitrite and oxyhemoglobin (kNO3_R) or deoxyhemoglobin (kNO_R) and between NO and oxyhemoglobin (kHbNO2) and is converted back to oxygen-binding hemoglobin forms by means of methemoglobin reductase (kMR(t)).44 We assumed that methemoglobin reductase activity (kMR (t)) is induced by methemoglobin rise20 to characterize the less-than-proportional increase in methemoglobin at higher nitrite doses, since lack of enzyme activity is known to result in disproportionate methemoglobin accumulation.44 The enzyme activity turnover was described with its production (kSYN) and loss (kDEG),21,22 and the enzyme production was assumed to be stimulated by the change in methemoglobin amount with the slope factor SMetHb.
 |
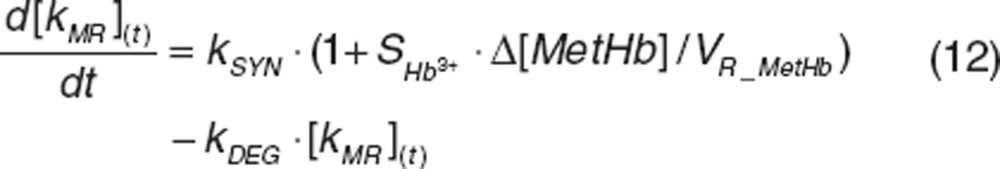 |
where VR_MetHb is methemoglobin volume of distribution in RBC. kSYN was a secondary parameter defined as .
.
Oxyhemoglobin and deoxyhemoglobin concentrations were defined as a fraction of the total known hemoglobin at predose from which methemoglobin concentrations has been subtracted. In normoxic conditions, hemoglobin is found prevalently in the oxygenated form (77%) and deoxygenated hemoglobin corresponds to 23%.45 It was assumed that total hemoglobin remains constant given the long RBC lifespan. Therefore, the changes of oxyhemoglobin and deoxyhemoglobin were defined as:
 |
The initial conditions are defined by the steady-state values:
 |
 |
 |
 |
 |
 |
The rate of methemoglobin reductase activity at baseline was a secondary parameter defined as:
 |
Methemoglobin  and
and  baselines were obtained from the individual average of known predose measurements and were read directly from the data file which is available in Supplementary Data online.
The final model included 24 primary parameters (Table 1) and three secondary parameters (kSYN, kMR(0), and kin_NO2) for five dependent variables (plasma nitrite and nitrate, RBC nitrite and nitrate, and methemoglobin) fitted simultaneously. Five parameters (kNO2_RDT, kT_RDT, kNO3_R, kHbNO1, and kNO_R) were redefined using a dummy variable to bring parameter estimation value close to 1. No covariance step was performed in the model.
Random variability models. The exponential model was used for interindividual (IIV) variability. Initially, IIV terms were estimated for all model parameters and then removed from parameters with high η-shrinkage (> 60%). The residual error for plasma nitrite and nitrate, RBC nitrite and nitrate, and methemoglobin was evaluated using a combination of the proportional and additive models. The model parameter estimation used first-order conditional estimation method with INTERACTION.
Covariate analysis. Relevant covariates (body weight, gender, and age) were screened via forward selection and backward elimination steps. Covariate significance was evaluated based on changes in OFV, reduction in IIV, and overall model performance. A difference between the OFV greater than 3.84 (P < 0.05) was considered significant and covariates included in the corresponding parameter. The goodness-of-fit for models were assessed numerically (OFV, AIC, ETA shrinkage and so on) and graphically. Graphical diagnostics using Xpose 4.0 (Uppsala University, Uppsala, Sweden) included scatter plots of observed, population, and individual predicted (PRED and IPRED) concentrations vs. time; observed vs. PRED; weighted residuals vs. time or IPRED; and ETA matrix correlation.
The stability of the model was evaluated by prediction corrected visual predictive checks46 in which parameter estimates were used to simulate the data for 1,000 virtual patients. The 5th, 25th, 50th (median), 75th, and 95th percentiles were calculated and the distribution of simulated concentrations was visually compared with the measured concentrations at each sampling time point.
Author contributions
R.P., R.L., and S.W. designed the research. R.P., R.L., and S.W. performed the research. and S.W. analyzed the data. K.R.V.V., R.P., R.L., and S.W. wrote the manuscript.
Conflict of Interest
R.P. is named as coinventor on an NIH government provisional patent application for the use of nitrite salts in the treatment of cardiovascular diseases. Other authors declare no conflict of interest.

Acknowledgments
The study was supported by a start-up fund to S.W. from the College of Pharmacy at the University of Oklahoma Health Sciences Center and the intramural program of the National Institute of Neurological Disorders and Stroke at the National Institutes of Health.
Supplementary Material
References
- Gilchrist M., Shore A.C., Benjamin N. Inorganic nitrate and nitrite and control of blood pressure. Cardiovascular Research. 2010;89:492–498. doi: 10.1093/cvr/cvq309. [DOI] [PubMed] [Google Scholar]
- Dejam A., et al. Erythrocytes are the major intravascular storage sites of nitrite in human blood. Blood. 2005;106:734–739. doi: 10.1182/blood-2005-02-0567. [DOI] [PMC free article] [PubMed] [Google Scholar]
- Gladwin M.T., et al. Nitrite as a vascular endocrine nitric oxide reservoir that contributes to hypoxic signaling, cytoprotection, and vasodilation. Am. J. Physiol. Heart Circ. Physiol. 2006;291:H2026–H2035. doi: 10.1152/ajpheart.00407.2006. [DOI] [PubMed] [Google Scholar]
- Rayner B.S., Hua S., Sabaretnam T., Witting P.K. Nitric oxide stimulates myoglobin gene and protein expression in vascular smooth muscle. Biochem. J. 2009;423:169–177. doi: 10.1042/BJ20090716. [DOI] [PubMed] [Google Scholar]
- Wagner D.A., Schultz D.S., Deen W.M., Young V.R., Tannenbaum S.R. Metabolic fate of an oral dose of 15N-labeled nitrate in humans: effect of diet supplementation with ascorbic acid. Cancer Res. 1983;43:1921–1925. [PubMed] [Google Scholar]
- Kosmicki M.A. Long-term use of short- and long-acting nitrates in stable angina pectoris. Curr. Clin. Pharmacol. 2009;4:132–141. doi: 10.2174/157488409788185016. [DOI] [PubMed] [Google Scholar]
- Omar S.A., Artime E., Webb A.J. A comparison of organic and inorganic nitrates/nitrites. Nitric Oxide. 2012;26:229–240. doi: 10.1016/j.niox.2012.03.008. [DOI] [PubMed] [Google Scholar]
- Dejam A., et al. Nitrite infusion in humans and nonhuman primates: endocrine effects, pharmacokinetics, and tolerance formation. Circulation. 2007;116:1821–1831. doi: 10.1161/CIRCULATIONAHA.107.712133. [DOI] [PubMed] [Google Scholar]
- Hon Y.Y., Sun H., Dejam A., Gladwin M.T. Characterization of erythrocytic uptake and release and disposition pathways of nitrite, nitrate, methemoglobin, and iron-nitrosyl hemoglobin in the human circulation. Drug Metab. Dispos. 2010;38:1707–1713. doi: 10.1124/dmd.110.034355. [DOI] [PMC free article] [PubMed] [Google Scholar]
- Vitturi D.A., Teng X., Toledo J.C., Matalon S., Lancaster J.R., Jr, Patel R.P. Regulation of nitrite transport in red blood cells by hemoglobin oxygen fractional saturation. Am. J. Physiol. Heart Circ. Physiol. 2009;296:H1398–H1407. doi: 10.1152/ajpheart.01303.2008. [DOI] [PMC free article] [PubMed] [Google Scholar]
- Vitturi D.A., Patel R.P. Current perspectives and challenges in understanding the role of nitrite as an integral player in nitric oxide biology and therapy. Free Radic. Biol. Med. 2011;51:805–812. doi: 10.1016/j.freeradbiomed.2011.05.037. [DOI] [PMC free article] [PubMed] [Google Scholar]
- Pluta R.M., et al. Safety and feasibility of long-term intravenous sodium nitrite infusion in healthy volunteers. PLoS ONE. 2011;6:e14504. doi: 10.1371/journal.pone.0014504. [DOI] [PMC free article] [PubMed] [Google Scholar]
- Godfrey M., Majid D.S. Renal handling of circulating nitrates in anesthetized dogs. Am. J. Physiol. 1998;275:F68–F73. doi: 10.1152/ajprenal.1998.275.1.F68. [DOI] [PubMed] [Google Scholar]
- Gardner P.R. Nitric oxide dioxygenase function and mechanism of flavohemoglobin, hemoglobin, myoglobin and their associated reductases. J. Inorg. Biochem. 2005;99:247–266. doi: 10.1016/j.jinorgbio.2004.10.003. [DOI] [PubMed] [Google Scholar]
- Lundberg J.O., Weitzberg E., Gladwin M.T. The nitrate–nitrite–nitric oxide pathway in physiology and therapeutics. Nature Reviews Drug Discovery. 2008;7:156–167. doi: 10.1038/nrd2466. [DOI] [PubMed] [Google Scholar]
- Jansson E.Å., et al. A mammalian functional nitrate reductase that regulates nitrite and nitric oxide homeostasis. Nature Chemical Biology. 2008;4:411–417. doi: 10.1038/nchembio.92. [DOI] [PubMed] [Google Scholar]
- Grubina R., et al. Concerted nitric oxide formation and release from the simultaneous reactions of nitrite with deoxy- and oxyhemoglobin. J. Biol. Chem. 2007;282:12916–12927. doi: 10.1074/jbc.M700546200. [DOI] [PubMed] [Google Scholar]
- Azarov I., Huang K.T., Basu S., Gladwin M.T., Hogg N., Kim-Shapiro D.B. Nitric oxide scavenging by red blood cells as a function of hematocrit and oxygenation. J. Biol. Chem. 2005;280:39024–39032. doi: 10.1074/jbc.M509045200. [DOI] [PubMed] [Google Scholar]
- Gladwin M.T., Grubina R., Doyle M.P. The new chemical biology of nitrite reactions with hemoglobin: R-state catalysis, oxidative denitrosylation, and nitrite reductase/anhydrase. Acc. Chem. Res. 2009;42:157–167. doi: 10.1021/ar800089j. [DOI] [PubMed] [Google Scholar]
- Percy M.J., McFerran N.V., Lappin T.R. Disorders of oxidised haemoglobin. Blood Rev. 2005;19:61–68. doi: 10.1016/j.blre.2004.02.001. [DOI] [PubMed] [Google Scholar]
- Dayneka N.L., Garg V., Jusko W.J. Comparison of four basic models of indirect pharmacodynamic responses. J. Pharmacokinet. Biopharm. 1993;21:457–478. doi: 10.1007/BF01061691. [DOI] [PMC free article] [PubMed] [Google Scholar]
- Sharma A., Jusko W.J. Characterization of four basic models of indirect pharmacodynamic responses. J. Pharmacokinet. Biopharm. 1996;24:611–635. doi: 10.1007/BF02353483. [DOI] [PubMed] [Google Scholar]
- Yao Z., Krzyzanski W., Jusko W.J. Assessment of basic indirect pharmacodynamic response models with physiological limits. J. Pharmacokinet. Pharmacodyn. 2006;33:167–193. doi: 10.1007/s10928-006-9003-7. [DOI] [PubMed] [Google Scholar]
- Green L.C., et al. Nitrate biosynthesis in man. Proc. Natl. Acad. Sci. U.S.A. 1981;78:7764–7768. doi: 10.1073/pnas.78.12.7764. [DOI] [PMC free article] [PubMed] [Google Scholar]
- Petersson J., et al. Gastroprotective and blood pressure lowering effects of dietary nitrate are abolished by an antiseptic mouthwash. Free Radic. Biol. Med. 2009;46:1068–1075. doi: 10.1016/j.freeradbiomed.2009.01.011. [DOI] [PubMed] [Google Scholar]
- Govoni M., Jansson E.A., Weitzberg E., Lundberg J.O. The increase in plasma nitrite after a dietary nitrate load is markedly attenuated by an antibacterial mouthwash. Nitric Oxide. 2008;19:333–337. doi: 10.1016/j.niox.2008.08.003. [DOI] [PubMed] [Google Scholar]
- Björne H H., Petersson J., Phillipson M., Weitzberg E., Holm L., Lundberg J.O. Nitrite in saliva increases gastric mucosal blood flow and mucus thickness. J. Clin. Invest. 2004;113:106–114. doi: 10.1172/JCI200419019. [DOI] [PMC free article] [PubMed] [Google Scholar]
- Larsen F.J., Ekblom B., Sahlin K., Lundberg J.O., Weitzberg E. Effects of dietary nitrate on blood pressure in healthy volunteers. N. Engl. J. Med. 2006;355:2792–2793. doi: 10.1056/NEJMc062800. [DOI] [PubMed] [Google Scholar]
- Lundberg J.O., Govoni M. Inorganic nitrate is a possible source for systemic generation of nitric oxide. Free Radic. Biol. Med. 2004;37:395–400. doi: 10.1016/j.freeradbiomed.2004.04.027. [DOI] [PubMed] [Google Scholar]
- Jensen F.B., Rohde S. Comparative analysis of nitrite uptake and hemoglobin-nitrite reactions in erythrocytes: sorting out uptake mechanisms and oxygenation dependencies. Am. J. Physiol. Regul. Integr. Comp. Physiol. 2010;298:R972–R982. doi: 10.1152/ajpregu.00813.2009. [DOI] [PubMed] [Google Scholar]
- Isbell T.S., Gladwin M.T., Patel R.P. Hemoglobin oxygen fractional saturation regulates nitrite-dependent vasodilation of aortic ring bioassays. Am. J. Physiol. Heart Circ. Physiol. 2007;293:H2565–H2572. doi: 10.1152/ajpheart.00759.2007. [DOI] [PubMed] [Google Scholar]
- Gladwin M.T., Lancaster J.R., Jr, Freeman B.A., Schechter A.N. Nitric oxide's reactions with hemoglobin: a view through the SNO-storm. Nat. Med. 2003;9:496–500. doi: 10.1038/nm0503-496. [DOI] [PubMed] [Google Scholar]
- Kohn M.C., Melnick R.L., Ye F., Portier C.J. Pharmacokinetics of sodium nitrite-induced methemoglobinemia in the rat. Drug Metab. Dispos. 2002;30:676–683. doi: 10.1124/dmd.30.6.676. [DOI] [PubMed] [Google Scholar]
- Shiva S., et al. Deoxymyoglobin is a nitrite reductase that generates nitric oxide and regulates mitochondrial respiration. Circ. Res. 2007;100:654–661. doi: 10.1161/01.RES.0000260171.52224.6b. [DOI] [PubMed] [Google Scholar]
- Basu S., et al. Catalytic generation of N2O3 by the concerted nitrite reductase and anhydrase activity of hemoglobin. Nat. Chem. Biol. 2007;3:785–794. doi: 10.1038/nchembio.2007.46. [DOI] [PubMed] [Google Scholar]
- Gladwin M.T., Kim-Shapiro D.B. The functional nitrite reductase activity of the heme-globins. Blood. 2008;112:2636–2647. doi: 10.1182/blood-2008-01-115261. [DOI] [PMC free article] [PubMed] [Google Scholar]
- Al-Sa'doni H., Ferro A. S-Nitrosothiols: a class of nitric oxide-donor drugs. Clin. Sci. 2000;98:507–520. [PubMed] [Google Scholar]
- Giustarini D., Milzani A., Colombo R., Dalle-Donne I., Rossi R. Nitric oxide and S-nitrosothiols in human blood. Clin. Chim. Acta. 2003;330:85–98. doi: 10.1016/s0009-8981(03)00046-9. [DOI] [PubMed] [Google Scholar]
- Stamler J.S., et al. Nitric oxide circulates in mammalian plasma primarily as an S-nitroso adduct of serum albumin. Proc. Natl. Acad. Sci. U.S.A. 1992;89:7674–7677. doi: 10.1073/pnas.89.16.7674. [DOI] [PMC free article] [PubMed] [Google Scholar]
- Al-Sa'doni H.H., Ferro A. Current status and future possibilities of nitric oxide-donor drugs: focus on S-nitrosothiols. Mini Rev. Med. Chem. 2005;5:247–254. doi: 10.2174/1389557053175399. [DOI] [PubMed] [Google Scholar]
- Alzawahra W.F., Talukder M.A., Liu X., Samouilov A., Zweier J.L. Heme proteins mediate the conversion of nitrite to nitric oxide in the vascular wall. Am. J. Physiol. Heart Circ. Physiol. 2008;295:H499–H508. doi: 10.1152/ajpheart.00374.2008. [DOI] [PMC free article] [PubMed] [Google Scholar]
- Vicini P., van der Graaf P.H. Systems pharmacology for drug discovery and development: paradigm shift or flash in the pan. Clin. Pharmacol. Ther. 2013;93:379–381. doi: 10.1038/clpt.2013.40. [DOI] [PubMed] [Google Scholar]
- Shiva S., et al. Ceruloplasmin is a NO oxidase and nitrite synthase that determines endocrine NO homeostasis. Nat. Chem. Biol. 2006;2:486–493. doi: 10.1038/nchembio813. [DOI] [PubMed] [Google Scholar]
- Ewenczyk C., et al. Recessive hereditary methaemoglobinaemia, type II: delineation of the clinical spectrum. Brain. 2008;131:760–761. doi: 10.1093/brain/awm337. [DOI] [PubMed] [Google Scholar]
- Roberson R.S., Bennett-Guerrero E. Impact of red blood cell transfusion on global and regional measures of oxygenation. Mt. Sinai J. Med. 2012;79:66–74. doi: 10.1002/msj.21284. [DOI] [PMC free article] [PubMed] [Google Scholar]
- Bergstrand M., Hooker A.C., Wallin J.E., Karlsson M.O. Prediction-corrected visual predictive checks for diagnosing nonlinear mixed-effects models. AAPS J. 2011;13:143–151. doi: 10.1208/s12248-011-9255-z. [DOI] [PMC free article] [PubMed] [Google Scholar]
Associated Data
This section collects any data citations, data availability statements, or supplementary materials included in this article.