

Abstract
Sirolimus is an inhibitor of mammalian target of rapamycin (mTOR) and is increasingly being used in transplantation and cancer therapies. Sirolimus has low oral bioavailability and exhibits large pharmacokinetic variability. The underlying mechanisms for this variability have not been explored to a large extent. Sirolimus metabolism was characterized by in vitro intrinsic clearance estimation. Pathway contribution ranked from CYP3A4 > CYP3A5 > CYP2C8. With the well stirred and Qgut models sirolimus bioavailability was predicted at 15%. Interindividual differences in bioavailability could be attributed to variable intestinal CYP3A expression. The physiologically-based pharmacokinetics (PBPK) model developed in Simcyp predicted a high distribution of sirolimus into adipose tissue and another elimination pathway in addition to CYP-mediated metabolism. PBPK model predictive performance was acceptable with Cmax and area under the curve (AUC) estimates within 20% of observed data in a dose escalation study. The model also showed potential to assess the impact of hepatic impairment and drug–drug interaction (DDI) on sirolimus pharmacokinetics.
Sirolimus (Rapamune®) was approved in 1999 in the USA and in 2001 in Europe as an immunosuppressive drug intended to prevent organ rejection in renal transplantation. Sirolimus is an inhibitor of mammalian target of rapamycin (mTOR), a kinase enzyme which is an essential controller of cellular and organism growth that integrates nutrient and hormonal signals, and regulates multiple cellular processes. Recent studies have indicated that mTOR signaling is an important pathway in human diseases including cancer, diabetes, obesity, and neurological disorders.1 Despite the increasing use of mTOR inhibitors in transplantation2 and as a promising agent in cancer therapies,3 there is an unmet clinical need to better understand the dose-concentration-response and adverse events relationships. Sirolimus exhibits low and variable oral bioavailability with large interindividual pharmacokinetic variability.4 To control some of the variability, therapeutic monitoring of sirolimus concentrations is recommended. CYP3A4, CYP3A5, and CYP2C8 have been suggested as the major enzymes involved in sirolimus hepatic metabolism.5 However, the quantitative contribution of each pathway has not been characterized. CYP3A also represents the predominant drug-metabolizing system in the small intestine6 and plays an important role in the intestinal first-pass metabolism. In addition, flavin-containing monooxygenase (FMO) contribution was explored as it may contribute to N-oxidation of the sirolimus piperidine ring in a similar fashion as the FMO-mediated piperidine N-oxidation described for phencyclidine.7 After a single oral dose of 14C-labeled sirolimus in healthy volunteers, 90% of the radioactivity was recovered from feces with little radioactivity recovered in urine (2.2%).4 Sirolimus is reported to be a substrate of P-glycoprotein (P-gp), but the contribution of P-gp to the binary excretion in humans is still unknown.8 P-gp is localized in the canalicular domain of the hepatocyte and facilitates excretion of exogenous organic cations and xenobiotics into bile.9 Several metabolites were also detectable in feces and urine (Rapamune product information; Pfizer/Wyeth-Ayerst). Blood samples drawn as trough concentration from kidney transplant patients during maintenance dosing contained 56% of sirolimus-derived metabolites.10
After a single oral dose in healthy adults, a sirolimus concentration decreases slowly with a half-life of 81.5 h.11 Sirolimus total body clearance is 278 ml/h/kg with an apparent volume of distribution of 22.8 l/kg.11 This large distribution volume implies extensive distribution to organs and tissues, and contributes to the long half-life. Sirolimus is partitioned extensively into blood cells with a blood to plasma ratio of 35.6.12 This ratio is independent of sirolimus concentration in kidney transplant patients and exhibits a large variability.13 Sirolimus is also highly lipophilic with a log P of 4.3 (http://www.drugbank.ca/drugs/DB00877) and the free fraction in plasma is 8%.4
Physiologically-based pharmacokinetics (PBPK) is a modeling technique that provides insight into the underlying mechanisms related to drug absorption, distribution, metabolism and excretion. Fundamental to PBPK is the separation of information on the system (i.e., human body physiology) from that of the drug (e.g., physicochemical characteristics determining permeability through membranes, partitioning to tissues, binding to plasma proteins or affinities toward certain metabolizing enzymes and transporter proteins) and the study design (e.g. dose, route and frequency of administration, concomitant drugs, and food intake). PBPK modeling is increasingly used in pharmaceutical research and drug development. In a recent report, it was noted that the office of clinical pharmacology at the US Food and Drug Administration received 25 submissions containing PBPK analysis between June 2008 and December 2011.14 In addition, several software packages have become commercially available for human PBPK modeling. The aim of the study was to first identify responsible CYP and FMO isoforms and quantify their contributions to overall sirolimus in vitro intrinsic clearance. Based on these data, we developed a sirolimus PBPK model to simulate the effects of tissue partitioning, CYP3A activity in the gut and liver, hepatic impairment, and drug–drug interactions (DDI) on sirolimus bioavailability and pharmacokinetics.
Results
Characterization of drug-metabolizing enzyme contribution to the overall sirolimus metabolism and bioavailability
The sirolimus metabolic stability assay with recombinant drug-metabolizing enzymes, CYPs and FMOs, showed metabolic contribution of CYP3A4, CYP3A5, and CYP2C8 (Figure 1). The decline in sirolimus concentration as compared to controls was the largest when incubated with CYP3A4 microsomes, followed by CYP3A5 and CYP2C8. The other CYP enzymes did not show any decline. FMOs did not show any catalytic activity under basic condition (pH = 9.5) and neutral condition (pH = 7.4). The estimated in vitro intrinsic clearance (CLint) values of CYP3A4, CYP3A5, and CYP2C8 were 9.33, 3.96, and 0.25 µl/min/pmol CYP at 0.3 µmol/l sirolimus, respectively. The CLint of CYP3A4 was 2.4-fold higher than that of CYP3A5.
Figure 1.

Metabolic lability of sirolimus in recombinant P450 and FMO enzymes. Sirolimus (3 µmol/l) was incubated with recombinant drug-metabolizing enzymes. P450 concentration was set at 50 pmol/ml. Protein concentration of recombinant FMO enzyme was set at 0.5 and 1.0 mg/ml in pH = 9.5 glycine buffer (a) and pH = 7.4 potassium phosphate buffer (b), respectively. Data represent the mean of duplicate determinations.
Fractions of dose that escape hepatic (Fh) and intestinal (Fg) first-pass metabolism were estimated based on the well-stirred model15 and the Qgut model,16 respectively, using CLint obtained as described and CYP3A content values reported by von Richter.17 Hepatic and intestinal CYP3A content was responsible for the magnitude of Fh and Fg, respectively (Figure 2). Fh and Fg were calculated as 0.96 ± 0.03 and 0.16 ± 0.10, respectively (mean ± SD from 15 subjects). Accordingly, the bioavailability was predicted to be 15 ± 9% (mean ± SD from 15 subjects).
Figure 2.

Sirolimus predicted hepatic and intestinal bioavailabilities. Hepatic (Fh, a) and intestinal (Fg, b) availabilities of sirolimus were predicted based on the well-stirred model and the Qgut model, respectively, using total CYP3A content data of von Richter et al. (2004), in which genotypes of CYP3A5*1/*3 (open circle) and *3/*3 (closed circle) were investigated.17
Development of a PBPK model to predict sirolimus pharmacokinetics
An initial PBPK model was developed using free intrinsic clearance values of each CYP isoform, free fraction in plasma, blood to plasma ratio, permeability in Caco-2 cells, physicochemical parameters (such as molecular weight, pKa, and log P), and default values of tissue-plasma partition coefficients (Kp) implemented in Simcyp based on population data for a healthy subject. This initial model was uninformative and showed large differences in predicted vs. observed concentration-time profiles.
As part of the model optimization, the Kp value for each tissue was subsequently tested at 10, 100, and a maximum value of 1,000 as an initial setting for screening purposes to identify the tissue most contributing to sirolimus volume of distribution. Model performance, as assessed by comparing observed vs. predicted pharmacokinetic profiles, improved when Kp was set at the maximum value for adipose tissue. The Kp setting did not have a noticeable effect for any of the other tissues such as brain, gut, kidney, liver, heart, and lung. Subsequent sensitivity analyses exploring Kp values of adipose tissue over a range from 250 to 1,000 indicated the best fit with a value of 1,000 especially to reflect the distribution phase (Figure 3a). As sirolimus shows a high blood to plasma ratio of 35.612, the Kp value of 1,000 for the adipose tissue is converted into tissue-blood partition coefficient of 28, which was calculated as the Kp value of 1,000 divided by blood to plasma ratio of 35.6.
Figure 3.

Sensitivity analysis of adipose distribution and intrinsic clearance from another elimination route on sirolimus pharmacokinetics. Systemic blood concentration of sirolimus following an oral administration of a single 15 mg dose of sirolimus was simulated (solid line) by the initial model. The adipose/plasma partition coefficient (Kp) was changed from 250 to 1,000 by 250 (a). The intrinsic clearance of another elimination route (CLint, other) was applied to introduce with a value of from 0 to 300 by 100 µl/min/106 cells. Dots represent observed mean concentrations from 22 healthy subjects after an oral administration of sirolimus at fasting.39
From this analysis, it also became clear that another elimination route such as biliary excretion and/or non-CYP/FMO metabolism as an additional intrinsic clearance pathway (CLint, other) in the PBPK model has to be assumed to adequately predict the sirolimus pharmacokinetic elimination phase profile. Incorporation of CLint, other values of 100–200 µl/min/106 cells improved the model fit, as assessed by minimization of the sum of weighted residual squares (Table 1 and Figure 3b). The predictive performance of the model with CLint, other values of 100 (Model 1) and 200 µl/min/106 cells (Model 2) were tested using observed clinical data in a dose escalation scenario of another cohort.11 As judging by the sum of weighted residual squares value, Model 1 had better predictive performance than Model 2 and provided estimates closer to observed Cmax and AUC values at doses ranging from 0.3 to 8.0 mg/m2 (comparable with 0.6–16 mg, Figure 4).
Table 1. Effect of varying model parameters on Cmax and AUCt.
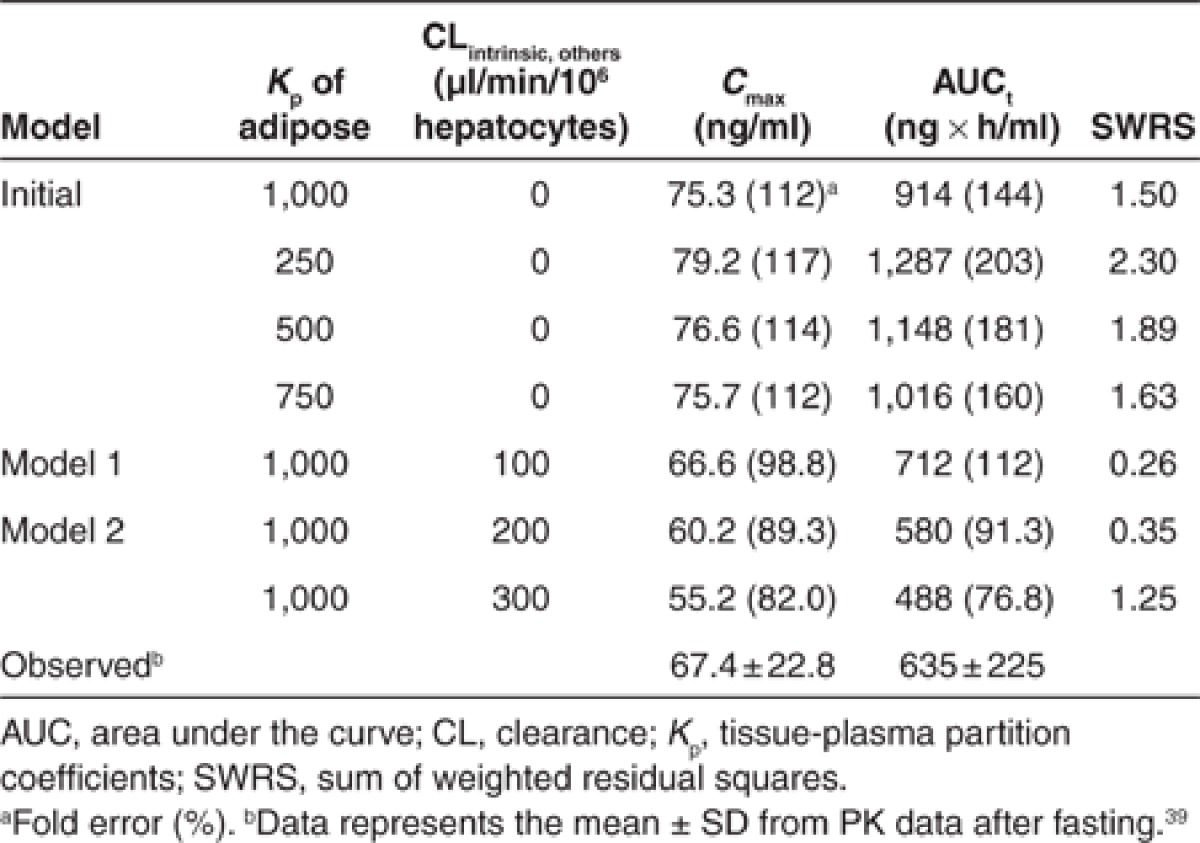
Figure 4.

Comparison of Cmax (a) and AUCt (b) of sirolimus in healthy adults between predicted and observed values. A virtual dose escalation study was carried out at various doses of 0.3, 1, 3, 5, and 8 mg/m2 (comparable with 0.6, 2, 6, 10, and 16 mg, respectively) for a representative healthy adult with Simcyp version 11. In the study, the pharmacokinetics of sirolimus was simulated by the PBPK models (Model 1 and Model 2, see Table 1). Model 1 (closed circle) and Model 2 (open circle) included CLint, other of 100 and 200 µl/min/106 cells, respectively. The predicted PK parameters as Cmax (a) and AUCt (b) were compared with observed data (mean ± SD) from a dose escalation study with the same dosing regimen in adult healthy volunteers.11 The solid line represents the line of unity and the dashed lines represent 80 or 120% of the unity (an area within 20% error).
On the basis of the results of the sensitively analysis and iterative model fitting, Model 1 was defined as the base sirolimus model for healthy adults and was used in further DDI and effects of hepatic impairment evaluations. In the evaluation of the pharmacokinetic interaction between sirolimus and diltiazem in healthy adults, median (25–75 percentiles) of AUC values for 180 healthy adult subjects after a single oral dose of sirolimus alone and in combination with diltiazem were predicted to be 550 (357–778) and 771 (558–1135), respectively, while observed AUCs were 701 (561–893) and 1030 (827–1610), respectively. Observed results were based on recalculation with numbers obtained by reading out the reported points in Figure 2 described by Bottiger et al.18 As for the AUC ratios, the median, 25–75 percentiles, and the geometric mean were 1.47, 1.35–1.58, and 1.48, respectively, while observed AUC ratios were 1.44, 1.19–2.46, and 1.58. Using the cirrhosis module (Child-Pugh grade A, B, and C) implemented in Simcyp, Model 1 also allowed exploration of the AUC change due to hepatic impairment and comparison with reported sirolimus AUCs in patients with cirrhosis (Figure 5b).
Figure 5.

Prediction of pharmacokinetic parameters in case studies, for a drug–drug interaction (a) and in patients with hepatic impairment (b) by the developed base model. (a) Sirolimus blood concentrations in a healthy adult after an oral administration of 10 mg of sirolimus alone (solid line) or with coadministration of 120 mg of diltiazem (dashed line). A virtual drug–drug interaction study was carried out with the model for 180 virtual healthy adults as identical as possible to those in the clinical study in terms of age and male–female ratio of subjects using Simcyp version 11 and each line shows the mean of individual data. In the study, the concentration-time profiles of sirolimus were simulated by the PBPK models (Model 1, see Table 1 and Figure 4). (b) Effect of hepatic impairment on AUC of sirolimus after a single oral administration of a 15 mg dose of sirolimus. This pharmacokinetic study was carried out for individual virtual healthy adults, and virtual patients with cirrhosis Child-Pugh grade A, B, and C (CP-A, CP-B, and CP-C, respectively) implemented in Simcyp version 11 (100 subjects for each population). Obtained AUC values from the virtual study with the PBPK model (Model 1) were compared with observed AUC values (mean ± SD) in a published study.30,40
Discussion
This is the first comprehensive study on the metabolism of the mTOR inhibitor, sirolimus using 20 recombinant drug-metabolizing enzymes, and also the first PBPK modeling study of sirolimus. The present study indicates that the CYP3A subfamily plays an important role in the metabolism of sirolimus in terms of metabolic capacity and abundance. Sirolimus is predominately metabolized by CYP3As with CLint of CYP3A4 > CYP3A5. This result is consistent in part with a previous report that CYP3A5 exhibited a lower intrinsic clearance than CYP3A4 on in vitro hydroxyl metabolite formation of sirolimus.19 CYP2C8 also showed metabolic activity to sirolimus, although the contribution was considered to be small based on the CLint value and the relative abundance of CYP2C8 in the liver and the intestine. In an in vitro/in vivo extrapolation, the CYP abundance plays a critical role when the magnitude of overall metabolic clearance is considered. It is well-accepted that CYP3As are predominantly expressed in the liver and the small intestine.6,20 The abundance of CYP3A4 is 4.6-fold higher than that of CYP2C8 in human liver microsomes according to meta-analysis data in Caucasians.20 In addition, protein expression of CYP2C8 in the small intestine was less than the detection level while the average abundance of CYP3A4 and CYP3A5 was estimated to 62 and 23 nmol/gut in 31 intestines in Caucasians, respectively.16,21
The analysis of Fh and Fg indicates that the large variability in bioavailability of sirolimus could be explained in large part by variable expression of intestinal CYP3A due to the relatively high contribution of intestinal metabolisms reflected by Fg value of 0.16. With respect to CYP3A content, von Richter et al. reported no correlation between hepatic and intestinal expression within subjects.17 Using their CYP3A content data from the same patients, bioavailability of sirolimus was predicted to be 15% which well corresponds with the reported clinical value of 14%.4 In general, CYP3A4 substrates with a hepatic intrinsic clearance of over 100 ml/min/kg tend to exhibit a low bioavailability due to substantial intestinal metabolism.22 As the predicted hepatic intrinsic clearance of sirolimus was 800 ml/min/kg, sirolimus clearly meets this characteristic. In addition, Lampen et al. reported an eightfold interindividual variability of the intestinal metabolite formation rate of sirolimus.23 Further investigations into the relationship between hepatic and intestinal CYP3A in the same patient would facilitate more accurate prediction.
Sirolimus is a highly lipophilic compound with a high blood to plasma ratio and small free fraction in plasma.4 Sensitivity analysis in this study suggested that the distribution of sirolimus to adipose tissue could be the most critical parameter to predict the pharmacokinetics profile of sirolimus in humans. A large volume of distribution of sirolimus might be caused by the distribution into blood cell and adipose tissue. Sirolimus has a long half-life of 81.5 h after a single oral dose in healthy volunteers.11 In general, the adipose tissue is a storage compartment for lipophilic compounds with slow release from this storage site resulting in long elimination half-lives. Poulin et al. reported that lipophilicity and unbound fraction in plasma are mechanistic determinants of in vivo adipose tissue-plasma partition.24 In kidney transplant patients, the distribution volume of sirolimus correlated with body weight and body surface area, and it is possible that this correlation may relate to the lipophilicity leading to the distribution into fat tissue.13
The established PBPK model in this study shows the possibility of another elimination route. The contribution of this alternate route to the overall sirolimus oral clearance was calculated to be 16% and needs to be addressed in a future study. There are several possible explanations such as biliary excretion and/or non-P450/FMO metabolism. Since the majority of radioactivity, which contains not only sirolimus metabolites but also sirolimus itself, was found in feces after a single oral dose of 14C-labeled sirolimus in healthy adults (Rapamune product information; Pfizer/Wyeth-Ayerst), it would be reasonable to assume direct biliary excretion in the PBPK model. Sirolimus is reported to be a substrate of P-gp which is one of efflux transporters expressed in the hepatocyte canalicular domain and facilitates excretion of xenobiotics into bile.8,9,25 Thus, the binary excretion of sirolimus would be a possible factor to explain its low bioavilability. There are several efflux transporters expressed in the canalicular domain of hepatocytes such as multidrug resistance associated proteins, bile salt export pump, and breast cancer resistance protein.9 Except for breast cancer resistance protein, the transport capacities of these transporters for sirolimus and its metabolites have not been fully characterized.25 Another possible explanation would be degradation of sirolimus through hydrolysis or formation of its ring opened isomer.8,26
A DDI study plays an important role in the risk assessment for drug safety and effectiveness. Bottiger et al. has investigated the DDI between diltiazem and sirolimus in healthy adults since diltiazem, a calcium channel antagonist, is used to control hypertension in renal transplant recipients.18 CYP3As contribute to the metabolism of both sirolimus and diltiazem.5,27 In their study, median of increased AUC ratio (25–75 percentiles) by combined administration with sirolimus was 1.44 (1.19–2.46).18 The median of predicted AUC ratio by the PBPK model was 1.48 and close to the observed value. This illustrates the potential of the PBPK model to predict likelihood and magnitude of changes in sirolimus exposure when combined with a CYP3A4 inhibitor.
It has been well established that environmental and disease factors can have an important impact on the expression and/or activity of human P450 enzymes.28 CYP3A content in the liver was decreased by 75% in patients with severe chronic liver disease.29 In a sirolimus pharmacokinetics study, patients with Child-Pugh grade A, B, and C hepatic impairment showed −40, −48, and −60% oral clearances compared with healthy adults.30 The PBPK model as described in this study also allowed exploration of the influence of liver disease severity on changes in sirolimus exposure, although AUC values were slightly overestimated (Figure 5b). In addition to P450 expression levels, overall drug exposure can be affected by several other factors. Zimmerman et al. (2008) reported that albumin, triglycerides, and hematocrit are decreased in patients with severe hepatic impairment compared with healthy subjects.30 These factors may explain the slightly overestimated AUC in patients. Further studies would need to consider these physiological changes due to hepatic impairment. Thus, the model would provide new insights into interpretation of different pharmacokinetic phenomena which lead to further investigations about the physiological difference between healthy and disease populations.
In summary, a mechanism-based PBPK model of sirolimus for healthy volunteers was developed in this study. The predictive performance of the model was good as evaluated by predicted AUC values being within ±20% of the observed clinical data in dose escalation scenarios. The model also allowed exploration of the influences of DDI with diltiazem and hepatic impairment on changes in sirolimus exposure. The model required some assumptions such as distribution to adipose tissue and an additional route of elimination and warrants a further study. In addition, an oral solution was used as the sirolimus formulation in the simulations. With the commercially available tablet, differences in solubility and dissolution rate may be additional factors in the absorption process. Nevertheless, the current PBPK modeling study provides us with mechanism-based insights into important contributing factors of observed interindividual differences in sirolimus pharmacokinetics. This prototype PBPK model will also be helpful to guide the need for conducting in vivo DDI studies and population specific studies such as pediatric and disease patients.
Methods
Materials. Sirolimus was purchased from LC Laboratories (Woburn, MA). Zotarolimus was purchased from Molcan Corporation (Toronto, Canada). Potassium phosphate buffer (500 mmol/l, pH 7.4) and Tris buffer (500 mmol/l, pH 7.5), NADPH regenerating system were obtained from BD Bioscience (Woburn, MA). Glycine buffer (1 mol/l, pH 9.5) was purchased from TOCRIS bioscience (Bristol, UK). Other reagents used in this study were commercially available and of analytical grade.
Recombinant enzymes (insect cell, oxidoreductase + b5 insect control, CYP1A2, CYP2A6, CYP2B6, CYP2C8, CYP2C9*1 (Arg144), CYP2C18, CYP2C19, CYP2D6*1 (Val374), CYP2E1, CYP2J2, CYP3A4, CYP3A5, CYP4A11, CYP4F12, CYP4F2, CYP4F3A, CYP4F3B, FMO1, FMO3, and FMO5) were purchased from BD Bioscience (San Jose, CA, USA). CYP1A2, CYP2C18, CYP2D6, and CYP4A11 were expressed with oxidoreductase, but others were expressed with both reductase and cytochrome b5.
Enzyme assay. A substrate depletion assay was performed according to the method of Obach (1999) with slight modifications.15 Sirolimus was incubated with recombinant CYP microsomes in an appropriate buffer in a shaking water bath at 37 °C. The protein concentration was adjusted at 0.4 mg/ml by adding the control microsomes on the assay for determination of CLint. Regarding FMOs, incubations were conducted under two different pH conditions, basic condition (pH = 9.5) and neutral condition (pH = 7.4). Basic condition (pH = 9.5) is optimum for the FMO metabolic activity, but the degree of sirolimus degradation at this pH is higher than that in neutral condition (pH = 7.4).31 Protein concentration at pH = 7.4 was set at twice the concentration of that at pH = 9.5 to enhance the FMO activity. Sample collection was at serial time points, where the 0 min time point indicated the time when the NADPH regenerating system and substrate was added into the reaction mixture for the P450 and FMO assay, respectively. Samples were extracted with methanol/0.2 mol/l ZnSO4 (80/20, v/v) including zotarolimus as an internal standard.32 After the removal of protein by centrifugation at 21,200g for 10 min at 4 °C, the supernatant was subjected to high-performance liquid chromatographic separation with tandem mass spectrometric detection (LC-MS/MS). Data of CLint represent the average of triplicate determinations Supplementary Data S2 online.
LC–MS/MS analysis. Sirolimus was quantified by an integrated on-line solid phase extraction (SPE)–high performance liquid chromatography–tandem mass spectrometry (API-3000, AB SCIEX, Foster City, CA) system according to the method by Koal et al. with slight modifications.32 On-line enrichment was performed by the POROS R1/20 column (2.1 mm × 30 mm, 20 µm particle size, Life Technologies) as a SPE column. As an enrichment eluent, 50% (v/v) methanol was used and its flow rate was 200 µl/min at a rinsing step. At zero time, an aliquot of 5 µl supernatant of each sample was injected to the LC-MS/MS system. The SPE elution and analyte transfer to the HPLC column (Luna 5 µm Phenyl Hexyl, 2 mm × 50 mm, Phenomenex) were performed by switching the six-port valve at 2.0 min. Column temperature was set at 35 °C. The configuration offers a fast SPE elution in a back-flush mode and an analyte transfer to the HPLC column by high organic content of the eluent (MeOH/H2O, 97/3, 10 mmol/l ammonium acetate, 0.1% acetic acid) at the flow rate of 200 µl/min. During this analysis step, the flow rate of SPE eluent was increased to 1000 µl/min at 2.3 min, and back to 200 µl/min at 4.4 min. The valve was switched back to the start position at 4.8 min.
The MS detection was performed in the multiple reaction monitoring mode with the positive ion mode of electrospray ionization. The transitions of m/z, namely m/z of the protonated/deprotonated molecular ion and predominant product ion, are as follows: sirolimus, 931.6–864.3; zotarolimus, 983.6–934.4 (as an ammonium adduct ion for both).
The analytical method is linear over a concentration range of 10 nmol/l to 3 µmol/l. The intra- and inter-day coefficients of validation were 0.30–11% and 1.6–7.5%, respectively. The lower limit of quantification was 10 nmol/l.
Calculation. The peak area ratios of sirolimus to an internal standard, zotarolimus, were used for quantification. The area ratios were converted to percentage sirolimus remaining, using the t = 0 min peak area ratio value as 100%. The slope of the linear regression from log percentage remaining vs. incubation time relationships (−kel) was used in the conversion to in vitro T1/2, values by in vitro T1/2 = 0.693/kel. Conversion to in vitro CLint (in units of ml/min/pmol CYP) was done using the following:
 |
Oral bioavailability (Foral) is defined as Foral = Fa × Fg × Fh, where Fa is the net fraction of dose absorbed from the intestinal tract, Fg and Fh are fractions of dose that escape intestinal and hepatic first-pass metabolism, respectively. In this study, Fa was assumed to be 1, Fh and Fg of sirolimus were predicted based on the well-stirred model and the Qgut model, respectively, using the in vitro data generated in this study and individual hepatic and intestinal CYP3A contents data as reported by von Richter et al.15,16,17
Fh was estimated by the following equation:
 |
where Qh, fuB and CLuH,int are hepatic blood flow (20.7 ml/min/kg), free fraction of sirolimus in blood, and unbound intrinsic clearance in the liver, respectively.33 In order to calculate free fraction of sirolimus in blood, free fraction of sirolimus in plasma (fu,p = 0.08) and blood to plasma ratio (35.6) were used.4,12
The unbound intrinsic clearance of sirolimus in the liver (CLuH,int) was calculated based on the recombinant CYP data. The nonspecific binding value of sirolimus to microsomal protein was predicted to be 0.45 using log P (4.3, http://www.drugbank.ca/drugs/DB00877) and the microsomal concentration (0.4 mg/ml) according to the in silico method by Hallifax and Houston.34 This value was used to convert the apparent sirolimus clearance into the unbound clearance.
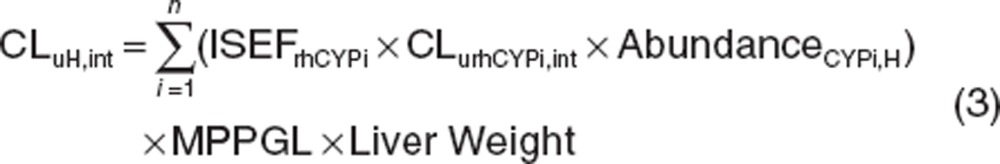 |
where ISEFrhCYPi, CLurhCYPi,int, AbundanceCYPi,H and MPPGL are the inter system extrapolation factor in order to correct for differences in activity per unit enzyme between recombinant human CYP (rhCYP) and human microsomes, unbound intrinsic clearance in rhCYP, abundance of each CYP in human liver microsomes, and milligram protein per gram of liver, respectively. ISEF values of CYP3A4/5 and CYP2C8 were set at 0.2435 and 1.0 (a default value in Simcyp version 11, CERTARA, USA), respectively. MPPGL and liver weight were 40 mg/g of liver and 21.4 g of liver/kg body weight, respectively.36,37
Fg was estimated by the following equation:
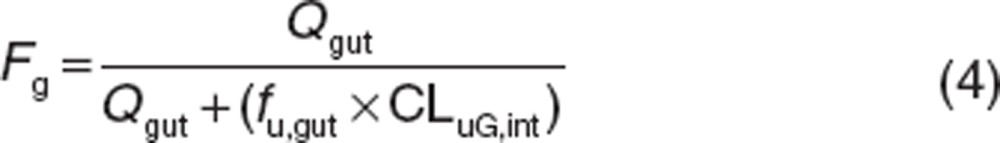 |
where Qgut and CLuG,int are the gut blood flow and unbound intrinsic clearance in the gut, respectively. The fraction unbound in the enterocytes (fu,gut) was assumed to be 1 according to the method of Yang et al.16 Qgut is described as a hybrid of both permeability through the enterocyte membrane and villous blood flow as follows.
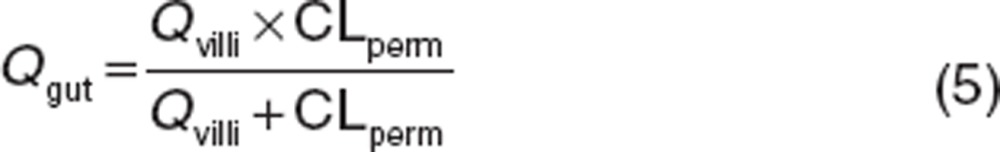 |
Qvilli and CLperm are an actual villous blood flow (18 l/h) and permeability clearance of sirolimus through the enterocyte, respectively. The CLperm is defined as a product of effective intestinal permeability (Peff) and a surface area of the small intestine. Peff and CLperm were calculated by the following equations:
 |
 |
where Peff and Papp,Caco-2 have units of 10−4 and 10−6 cm/s, respectively. Papp,Caco-2 of sirolimus has been reported to be 3.1 × 10⁻⁶ cm/s.37 Intestinal radius of 1.75 cm and the length of 6 m were used in this study according to Yang et al.16
In addition, the unbound intrinsic clearance of sirolimus in gut (CLuG,int) is calculated based on the recombinant CYP data:
 |
where AbundanceCYPi,G is abundance of each CYP in human gut.
For the calculation of intrinsic clearance, CYP3A4 and CYP3A5 expression data by von Richter et al. were used as the abundance data.17,38 Hepatic and intestinal CYP concentration was scaled to the microsomal protein level and the organ level, where the following factors were used: liver, 157 mg homogenate protein/g of wet tissue and MPPGL as mentioned above; intestine, protein content of enterocyte homogenate (1.2 mg/g homogenate) and weight of enterocytes (720 g when a total volume of enterocytes of 720 ml and a density of 1 g/ml are assumed).17,38
PBPK model simulations. A PBPK model was developed using Simcyp software version (Supplementary Data S1 and S3 online) 11. The healthy volunteer database was selected and the representative and individual value of virtual healthy adults were used for the simulation. Especially, the simulations in the DDI study were conducted in virtual subjects with demographics as close as possible to those reported in the original clinical study in terms of age and male–female ratio of subjects.18 The well-stirred model was selected to derive the whole blood hepatic clearance. The advanced dissolution, absorption and metabolism model was used for the absorption process, where oral solution was selected as a formulation of sirolimus. The following assumptions were made: there was no active drug transporter into or out of the hepatocytes and enterocytes involved, therefore any kinetic parameters related to a transporter were not used in the model. The sensitivity analysis was performed in one parameter basis to assess the influence on a sirolimus blood concentration profile at a time. Using in vitro data of sirolimus available, the PK simulation was performed based on the full PBPK model and then the predicted concentrations-time curve was compared with observed data. Sirolimus concentration-time profiles observed in a clinical trial was obtained from graphs in the previous publication by scanning with GetData Graph Digitizer ver. 2.25. Model fitting was evaluated by visual inspection and the minimum value of sum of weighted residual squares. Inhibitor profile of diltiazem and cirrhosis population profiles (Child-Pugh score of A, B and C) embedded in Simcyp version 11 were used for the prediction of DDI and the effect of hepatic impairments on sirolimus PK.
Author contributions
C.E., T.F., U.C., and A.A.V. wrote the manuscript; C.E., T.F., and A.A.V. designed the research; C.E. and S.C. performed the research; C.E. and T.F. analyzed the data.
Conflict of interest
C.E. is supported by an internship program at Otsuka Pharmaceutical Co., Ltd, Tokushima, Japan. Other authors declare no conflict of interest.
Study Highlights
Acknowledgments
This work is supported by Cincinnati Children's Hospital Medical Center.
Supplementary Material
References
- Laplante M., Sabatini D.M. mTOR signaling in growth control and disease. Cell. 2012;149:274–293. doi: 10.1016/j.cell.2012.03.017. [DOI] [PMC free article] [PubMed] [Google Scholar]
- Yost S.E., Byrne R., Kaplan B. Transplantation: mTOR inhibition in kidney transplant recipients. Nat. Rev. Nephrol. 2011;7:553–555. doi: 10.1038/nrneph.2011.125. [DOI] [PubMed] [Google Scholar]
- Pavel M.E., RADIANT-2 Study Group et al. Everolimus plus octreotide long-acting repeatable for the treatment of advanced neuroendocrine tumours associated with carcinoid syndrome (RADIANT-2): a randomised, placebo-controlled, phase 3 study. Lancet. 2011;378:2005–2012. doi: 10.1016/S0140-6736(11)61742-X. [DOI] [PubMed] [Google Scholar]
- MacDonald A., Scarola J., Burke J.T., Zimmerman J.J. Clinical pharmacokinetics and therapeutic drug monitoring of sirolimus. Clin. Ther. 2000;22 suppl. B:B101–B121. doi: 10.1016/s0149-2918(00)89027-x. [DOI] [PubMed] [Google Scholar]
- Jacobsen W., Serkova N., Hausen B., Morris R.E., Benet L.Z., Christians U. Comparison of the in vitro metabolism of the macrolide immunosuppressants sirolimus and RAD. Transplant. Proc. 2001;33:514–515. doi: 10.1016/s0041-1345(00)02116-3. [DOI] [PubMed] [Google Scholar]
- Paine M.F., Hart H.L., Ludington S.S., Haining R.L., Rettie A.E., Zeldin D.C. The human intestinal cytochrome P450 “pie”. Drug Metab. Dispos. 2006;34:880–886. doi: 10.1124/dmd.105.008672. [DOI] [PMC free article] [PubMed] [Google Scholar]
- Cho A.K., Narimatsu S., Kumagai Y. Metabolism of drugs of abuse by cytochromes P450. Addict. Biol. 1999;4:283–301. doi: 10.1080/13556219971498. [DOI] [PubMed] [Google Scholar]
- Cummins C.L., Jacobsen W., Christians U., Benet L.Z. CYP3A4-transfected Caco-2 cells as a tool for understanding biochemical absorption barriers: studies with sirolimus and midazolam. J. Pharmacol. Exp. Ther. 2004;308:143–155. doi: 10.1124/jpet.103.058065. [DOI] [PubMed] [Google Scholar]
- Giacomini K.M., et al. Membrane transporters in drug development. Nat. Rev. Drug Discov. 2010;9 3:215–236. doi: 10.1038/nrd3028. [DOI] [PMC free article] [PubMed] [Google Scholar]
- Streit F., et al. Sensitive and specific quantification of sirolimus (rapamycin) and its metabolites in blood of kidney graft recipients by HPLC/electrospray-mass spectrometry. Clin. Chem. 1996;42:1417–1425. [PubMed] [Google Scholar]
- Brattström C., et al. Pharmacokinetics and safety of single oral doses of sirolimus (rapamycin) in healthy male volunteers. Ther. Drug Monit. 2000;22:537–544. doi: 10.1097/00007691-200010000-00006. [DOI] [PubMed] [Google Scholar]
- Tejani A., et al. Safety and pharmacokinetics of ascending single doses of sirolimus (Rapamune, rapamycin) in pediatric patients with stable chronic renal failure undergoing dialysis. Pediatr. Transplant. 2004;8:151–160. doi: 10.1046/j.1399-3046.2003.00137.x. [DOI] [PubMed] [Google Scholar]
- Ferron G.M., Mishina E.V., Zimmerman J.J., Jusko W.J. Population pharmacokinetics of sirolimus in kidney transplant patients. Clin. Pharmacol. Ther. 1997;61:416–428. doi: 10.1016/S0009-9236(97)90192-2. [DOI] [PubMed] [Google Scholar]
- Zhao P., Rowland M., Huang S.M. Best practice in the use of physiologically based pharmacokinetic modeling and simulation to address clinical pharmacology regulatory questions. Clin. Pharmacol. Ther. 2012;92:17–20. doi: 10.1038/clpt.2012.68. [DOI] [PubMed] [Google Scholar]
- Obach R.S. Prediction of human clearance of twenty-nine drugs from hepatic microsomal intrinsic clearance data: An examination of in vitro half-life approach and nonspecific binding to microsomes. Drug Metab. Dispos. 1999;27:1350–1359. [PubMed] [Google Scholar]
- Yang J., Jamei M., Yeo K.R., Tucker G.T., Rostami-Hodjegan A. Prediction of intestinal first-pass drug metabolism. Curr. Drug Metab. 2007;8:676–684. doi: 10.2174/138920007782109733. [DOI] [PubMed] [Google Scholar]
- von Richter O., Burk O., Fromm M.F., Thon K.P., Eichelbaum M., Kivistö K.T. Cytochrome P450 3A4 and P-glycoprotein expression in human small intestinal enterocytes and hepatocytes: a comparative analysis in paired tissue specimens. Clin. Pharmacol. Ther. 2004;75:172–183. doi: 10.1016/j.clpt.2003.10.008. [DOI] [PubMed] [Google Scholar]
- Böttiger Y., et al. Pharmacokinetic interaction between single oral doses of diltiazem and sirolimus in healthy volunteers. Clin. Pharmacol. Ther. 2001;69:32–40. doi: 10.1067/mcp.2001.112513. [DOI] [PubMed] [Google Scholar]
- Picard N., Djebli N., Sauvage F.L., Marquet P. Metabolism of sirolimus in the presence or absence of cyclosporine by genotyped human liver microsomes and recombinant cytochromes P450 3A4 and 3A5. Drug Metab. Dispos. 2007;35:350–355. doi: 10.1124/dmd.106.012161. [DOI] [PubMed] [Google Scholar]
- Inoue S., et al. Prediction of in vivo drug clearance from in vitro data. II: potential inter-ethnic differences. Xenobiotica. 2006;36:499–513. doi: 10.1080/00498250600683262. [DOI] [PubMed] [Google Scholar]
- Läpple F., et al. Differential expression and function of CYP2C isoforms in human intestine and liver. Pharmacogenetics. 2003;13:565–575. doi: 10.1097/00008571-200309000-00005. [DOI] [PubMed] [Google Scholar]
- Kato M., et al. The intestinal first-pass metabolism of substrates of CYP3A4 and P-glycoprotein-quantitative analysis based on information from the literature. Drug Metab. Pharmacokinet. 2003;18:365–372. doi: 10.2133/dmpk.18.365. [DOI] [PubMed] [Google Scholar]
- Lampen A., Zhang Y., Hackbarth I., Benet L.Z., Sewing K.F., Christians U. Metabolism and transport of the macrolide immunosuppressant sirolimus in the small intestine. J. Pharmacol. Exp. Ther. 1998;285:1104–1112. [PubMed] [Google Scholar]
- Poulin P., Schoenlein K., Theil F.P. Prediction of adipose tissue: plasma partition coefficients for structurally unrelated drugs. J. Pharm. Sci. 2001;90:436–447. doi: 10.1002/1520-6017(200104)90:4<436::aid-jps1002>3.0.co;2-p. [DOI] [PubMed] [Google Scholar]
- Gupta A., et al. Cyclosporin A, tacrolimus and sirolimus are potent inhibitors of the human breast cancer resistance protein (ABCG2) and reverse resistance to mitoxantrone and topotecan. Cancer Chemother. Pharmacol. 2006;58:374–383. doi: 10.1007/s00280-005-0173-6. [DOI] [PubMed] [Google Scholar]
- Paine M.F., et al. Identification of a novel route of extraction of sirolimus in human small intestine: roles of metabolism and secretion. J. Pharmacol. Exp. Ther. 2002;301:174–186. doi: 10.1124/jpet.301.1.174. [DOI] [PubMed] [Google Scholar]
- Williams J.A., et al. Comparative metabolic capabilities of CYP3A4, CYP3A5, and CYP3A7. Drug Metab. Dispos. 2002;30:883–891. doi: 10.1124/dmd.30.8.883. [DOI] [PubMed] [Google Scholar]
- Rendic S., Guengerich F.P. Update information on drug metabolism systems–2009, part II: summary of information on the effects of diseases and environmental factors on human cytochrome P450 (CYP) enzymes and transporters. Curr. Drug Metab. 2010;11:4–84. doi: 10.2174/138920010791110917. [DOI] [PMC free article] [PubMed] [Google Scholar]
- George J., Murray M., Byth K., Farrell G.C. Differential alterations of cytochrome P450 proteins in livers from patients with severe chronic liver disease. Hepatology. 1995;21:120–128. [PubMed] [Google Scholar]
- Zimmerman J.J., Patat A., Parks V., Moirand R., Matschke K. Pharmacokinetics of sirolimus (rapamycin) in subjects with severe hepatic impairment. J. Clin. Pharmacol. 2008;48:285–292. doi: 10.1177/0091270007312902. [DOI] [PubMed] [Google Scholar]
- Nagashima S., et al. Inter-individual variation in flavin-containing monooxygenase 3 in livers from Japanese: correlation with hepatic transcription factors. Drug Metab. Pharmacokinet. 2009;24:218–225. doi: 10.2133/dmpk.24.218. [DOI] [PMC free article] [PubMed] [Google Scholar]
- Koal T., Deters M., Casetta B., Kaever V. Simultaneous determination of four immunosuppressants by means of high speed and robust on-line solid phase extraction-high performance liquid chromatography-tandem mass spectrometry. J. Chromatogr. B Analyt. Technol. Biomed. Life Sci. 2004;805:215–222. doi: 10.1016/j.jchromb.2004.02.040. [DOI] [PubMed] [Google Scholar]
- Naritomi Y., Terashita S., Kimura S., Suzuki A., Kagayama A., Sugiyama Y. Prediction of human hepatic clearance from in vivo animal experiments and in vitro metabolic studies with liver microsomes from animals and humans. Drug Metab. Dispos. 2001;29:1316–1324. [PubMed] [Google Scholar]
- Hallifax D., Houston J.B. Binding of drugs to hepatic microsomes: comment and assessment of current prediction methodology with recommendation for improvement. Drug Metab. Dispos. 2006;34 4:724–726. doi: 10.1124/dmd.105.007658. [DOI] [PubMed] [Google Scholar]
- Barter Z.E., Perrett H.F., Yeo K.R., Allorge D., Lennard M.S., Rostami-Hodjegan A. Determination of a quantitative relationship between hepatic CYP3A5*1/*3 and CYP3A4 expression for use in the prediction of metabolic clearance in virtual populations. Biopharm. Drug Dispos. 2010;31:516–532. doi: 10.1002/bdd.732. [DOI] [PubMed] [Google Scholar]
- Barter Z.E., Chowdry J.E., Harlow J.R., Snawder J.E., Lipscomb J.C., Rostami-Hodjegan A. Covariation of human microsomal protein per gram of liver with age: absence of influence of operator and sample storage may justify interlaboratory data pooling. Drug Metab. Dispos. 2008;36:2405–2409. doi: 10.1124/dmd.108.021311. [DOI] [PubMed] [Google Scholar]
- Gertz M., Harrison A., Houston J.B., Galetin A. Prediction of human intestinal first-pass metabolism of 25 CYP3A substrates from in vitro clearance and permeability data. Drug Metab. Dispos. 2010;38:1147–1158. doi: 10.1124/dmd.110.032649. [DOI] [PubMed] [Google Scholar]
- Yang J., Tucker G.T., Rostami-Hodjegan A. Cytochrome P450 3A expression and activity in the human small intestine. Clin. Pharmacol. Ther. 2004;76:391. doi: 10.1016/j.clpt.2004.07.001. [DOI] [PubMed] [Google Scholar]
- Zimmerman J.J., Ferron G.M., Lim H.K., Parker V. The effect of a high-fat meal on the oral bioavailability of the immunosuppressant sirolimus (rapamycin). J. Clin. Pharmacol. 1999;39:1155–1161. [PubMed] [Google Scholar]
- Zimmerman J.J., et al. Pharmacokinetics of sirolimus (rapamycin) in subjects with mild to moderate hepatic impairment. J. Clin. Pharmacol. 2005;45:1368–1372. doi: 10.1177/0091270005281350. [DOI] [PubMed] [Google Scholar]
Associated Data
This section collects any data citations, data availability statements, or supplementary materials included in this article.