Abstract
Background:
Greater palatine canal is used for maxillary nerve block. This procedure has some complications such as proptosis, blindness, and intravascular injection. This study aimed to determine the mean greater palatine canal length (CL) and its typical anatomic routes, as well as provide a reliable facial index for computing the CL by using cone beam computed tomography (CBCT) data.
Materials and Methods:
A total of 138 CBCT scans (65 females and 73 males) were evaluated. The path of the canal and the CL were determined by sex, age, and side. The mean distance from the inferior border of the infraorbital foramen (IOF) to the crest of alveolar bone between maxillary premolar(CMP) was measured and compared with the CL. Paired t-tests, independent t-test, and one-way analysis of variance (ANOVA) were used for statistical analysis.
Results:
The mean of CL was 31.82 ± 1.37 mm (31.70 ± 2.44 mm on the right side and 31.94 ± 2.40 mm on the left side), and the values were 32.49 ± 2.37 mm in males and 30.55 ± 1.76 mm among females (P = 0.001). The mean distance from the IOF to the CMP was 32.01 ± 2.18 mm, which was not significantly different to the CL (P = 0.336).
Conclusions:
The mean CL was significantly different according to sex and side. The mean distance from the IOF to CMP was significantly different according to sex. On comparing the mean distance from the IOF to the CMP with the CL, no significant difference was observed. Therefore, the mean distance from the IOF to CMP may be a reliable clinical index.
Keywords: Anatomy, cone beam computed tomography, maxillary nerve, pterygopalatine fossa
INTRODUCTION
The pterygopalatine fossa (PPF) contains the maxillary artery and its branches, the accompanying vein, the maxillary nerve and its branches, and the pterygopalatine ganglion, and is an area with an inverted pyramid shape.[1] The greater palatine canal (GPC) extends through the PPF and contains the greater palatine and lesser palatine nerves, which diverge to enter the hard palate at respective foramina.[2] The canal helps direct access to the PPF, including the sphenopalatine ganglion, pterygopalatine ganglion, infraorbital nerve, internal maxillary artery, and the pterygoid venous plexus. Injection into the greater palatine foramen (GPF) is effective for anesthetizing and for controlling bleeding during paranasal sinus surgery.[3]
It is used in all the palatal interventions, where anesthetizing the hard palate is necessary, such as for periodontal procedures, drainage of abscesses, and even for surgical procedures such as dental extractions.[4,5] The most typical method used to block maxillary nerve is the greater palatine canal technique. This technique was first introduced by Mendel (1917),[6] and involves the insertion of a needle into the GPC through the GPF. A local anesthetic solution is injected via this needle into the superior aspect of the PPF to the trunk of the maxillary nerve. This method is successful provided at least two-thirds of the needle is inserted into the canal. Penetration of the orbit and nasal cavity, proptosis, blindness from vasoconstriction of the ophthalmic artery and/or intracranial spread of infection, intravascular injection, penetration of the nasopharynx, damage to neural tissue, and failed anesthesia are the possible complications.[2,6,7] Thus, good knowledge of the anatomy and average length of the GPC is crucial for avoiding these problems. Since 3D images of cone beam computed tomography (CBCT) are becoming more readily available for use in maxillofacial applications and provides better image quality of teeth and their surrounding structures, compared with conventional CT scan,[8] the aim of this study was to determine the average length of the GPC and its typical anatomic routes, as well as to provide a reliable facial index for computing the canal length (CL) of the GPC by using CBCT data obtained from patients in a dental school setting.
MATERIALS AND METHODS
In this descriptive analytical cross-sectional study, the computer database belonging to the Department of Radiology at Isfahan University of Medical Sciences was searched, and all scans taken between December 2010 and December 2011 were identified. CBCT scans were performed (GALILEOS, version 1.7) using a flat panel detector with 0.3 × 0.3 × 0.3 mm3 voxel size. All images were taken using volume 1 (high-resolution) and high-contrast options.
Three different variables were assessed, which are discussed subsequently.
(1, 2) The mean CL of the GPC and its paths:
The inclusion criteria for the assessment of the CL were age 18 years at the time of evaluation and full skeletal maturation.
The exclusion criteria were as follows: A history of trauma or orthognathic surgery, a history or the presence of pathologic bone disease in the maxilla, and CBCT scans that did not include the maxilla.
A total of 138 scans (65 females and 73 males) of individuals ranging in age from 18 to 76 years met the aforementioned criteria (convenience sampling).
The method described by Haward-Swirzinski, et al.[9] was used to assess the CL and its paths in both sagittal and coronal planes. The anatomic paths of the canal on both the right and left sides were determined (N = 276) and the CL was measured. Both the foramen rotundum and the pterygoid canal can be used to determine the superior aspect of the GPC; however, the pterygoid canal is easier to locate, and so is a better candidate for evaluating the superior limit of the canal. The superior-inferior direction of the pterygoid canal was marked using the programˊs line coordinates; its vertical location remained constant when it was viewed in different planes. To standardize the shape of the GPF, two different landmarks were introduced as its inferior limit; in the sagittal plane, the posterior wall of the GPF was used, and in the coronal plane, the inferior surface of the horizontal hard palate was used. Therefore, the bony portion of the GPC, which was defined as the distance from the center of the pterygoid canal (the center of the PPF) to the GPF on the inferior surface of the hard palate, was considered as the length of the GPC. The CL was measured in millimeters using the straightest linear path passing through the center of the canal. The path of the GPC was determined using descriptive characteristics.
The subjects were categorized into three age groups:
First group: 18-24 years old (n = 20)
Second group: 25-40 years old (n = 33)
Third group: 41-77 years old (n = 85)
The mean CL and the number of different paths were analyzed according to age, sex, and side.
Measurements were repeated 2 months later and intra-examiner reliability was analyzed.
(3) The mean distance from the inferior border of the infraorbital foramen (IOF) to the crest of the alveolar bone between the maxillary premolars (CMP).
The inclusion criteria for assessment of the distance from the IOF to the CMP were: Age ≥ 18 years at the time of evaluation and full skeletal maturation. The patients also had to have their maxillary premolars and no periodontal diseases.
The exclusion criteria were as follows: A history of trauma or orthognathic surgery, a history or the presence of pathologic bone disease in the maxilla, CBCT scans that did not include the maxilla, and patients who did not have their maxillary premolars or who had periodontal diseases.
Since 48 subjects either had periodontal problems or lacked maxillary premolars, 48 new age- and sex-matched subjects were evaluated to determine the distance from the IOF to the CMP. The new subjects ranged in age from 18 to 52 years, and included 65 females and 73 males, and so assessment of CL was still possible.
To determine the distance from the IOF to the CMP, we first located and marked the crest of alveolar bone between the maxillary bicuspids in the panorama view and then ran the multiplanar program to view the IOF in the coronal view. Distance was reported in millimeters.
Since one of the aims of this study was to compare the CL with the mean distance from the IOF to the CMP in order to obtain a facial index of the mean GPC, we determined the CL for 138 new subjects.
The subjects were categorized into three age groups:
First group: 18-24 years old (n = 23)
Second group: 25-40 years old (n = 68)
Third group: Above 41 years old (n = 47)
The distance from the inferior border of the IOF to the CMP was compared with the mean CL according to age, sex, and side.
Paired t-tests were used to assess statistical differences between the right and left sides for both sexes in each of the three study groups.
Independent t-test was used to compare the CL values and the distance from the IOF to the CMP.
One-way analysis of variance (ANOVA) was used to compare the CL and IOF between the three study groups.
To identify the level of agreement between the CL on the right and left sides, an intra-class correlation coefficient (ICC) was used.
A kappa coefficient was used to identify the degree of symmetry between the pathways on the right and left sides as viewed in the sagittal and coronal planes.
RESULTS
The mean CL of the GPC was 31.82 ± 1.37 mm (31.70 ± 2.44 mm on the right side and 31.94 ± 2.40 mm on the left, intra-examiner reliability was 95%); a statistically significant difference in CL was observed between the right and left sides (P = 0.044). However, the ICC was 0.8399 with P < 0.001, which indicates a consistent mean CL.
The mean CL in females was 30.55 ± 1.76 mm and in males was 32.94 ± 2.37 mm, which was a statistically significant difference (P = 0.001).
The mean CL on each side according to sex is shown in Table 1.
Table 1.
Mean CL on the right and left sides among males and females

No significant difference between the CL on the right and left sides was observed in the first two age groups, but a significant difference was observed among the third age group (P = 0.003).
There was no significant difference of the CL between the three age groups (ANOVA, P = 0.231).
The mean CL on each side according to age is shown in Table 2.
Table 2.
Mean CL on the right and left sides among the three age groups

Investigations of the canal path revealed three path types in the sagittal plane and four path types in the coronal plane [Figures 1 and 2].
Figure 1.

Three different path types observed in the sagittal plane
Figure 2.
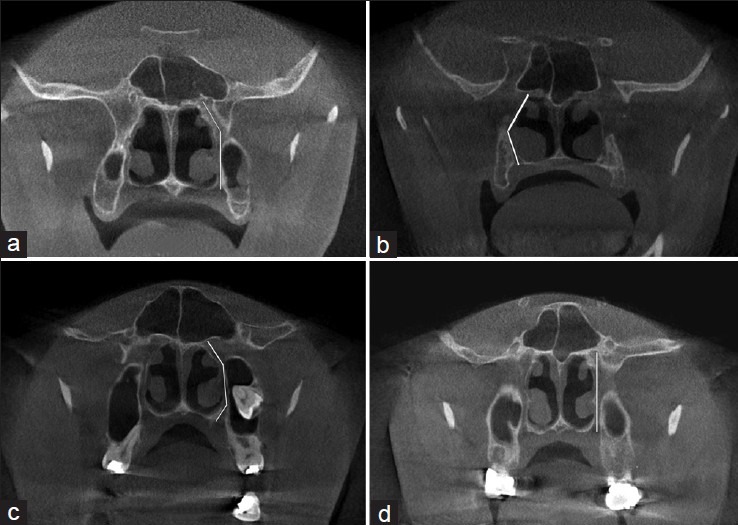
Four different path types observed in the coronal plane
In the sagittal plane:
The GPC travels in an anterior-inferior direction from the PPF [Figure 1a].
The GPC first travels in an inferior direction and then in an anterior-inferior direction through the remainder of the canal [Figure 1b].
The GPC first travels in an inferior direction and then changes to an anterior-inferior direction, and subsequently to an inferior direction through the remainder of the canal [Figure 1c].
In the coronal plane:
The GPC travels in an inferior-lateral direction from the PPF and then in a directly inferior direction [Figure 2a].
The GPC travels in an inferior-lateral direction for a certain distance and then changes to an inferior-medial direction through the remainder of the canal [Figure 2b].
The GPC first travels in an inferior-lateral direction and then in a directly inferior direction, and finally in an inferior-medial direction [Figure 2c].
The GPC travels in a directly inferior direction from the PPF [Figure 2d].
The most prevalent pathways in the sagittal and coronal planes were the paths shown in Figure 1b and 2a, respectively.
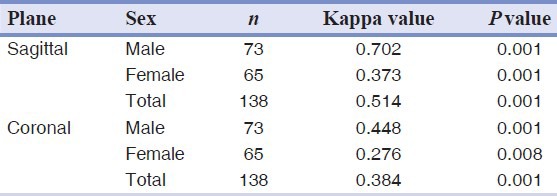
The different pathways and the degree of symmetry between the pathways on the right and left sides in the sagittal and coronal planes are shown in Figures 3 and 4 and in Table 3 (kappa), respectively.
Figure 3.
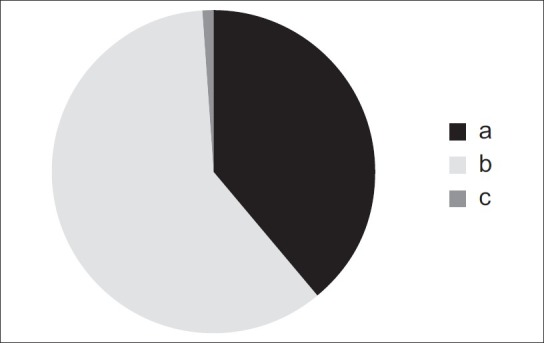
The different pathways identified in the sagittal plane: (a) The greater palatine canal travels in an anterior-inferior direction from the pterygopalatine fossa; (b) the greater palatine canal travels in an inferior direction and then in an anterior-inferior direction through the remainder of the canal; (c) the greater palatine canal first travels in an inferior direction, then changes to an anterior-inferior direction, and subsequently travels in an inferior direction through the remainder of the canal
Figure 4.
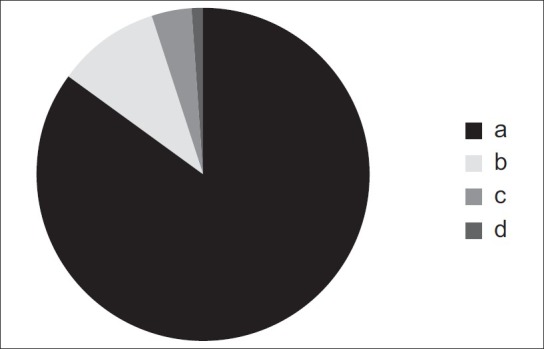
The different pathways identified in the coronal plane: (a) The greater palatine canal travels in an inferior-lateral direction from the PPF and then in a directly inferior direction; (b) the greater palatine canal travels in an inferior-lateral direction for a certain distance and then changes to an inferior-medial direction through the remainder of the canal; (c) the greater palatine canal first travels in an inferior-lateral direction, then in a directly inferior direction, and finally in an inferior-medial direction; (d) the greater palatine canal travels in a directly inferior direction from the pterygopalatine fossa
Table 3.
Kappa values showing the symmetry of the paths on the right and left sides
The mean distance from the inferior border of the IOF to the CMP was 31.97 ± 2.04 mm on the right side and 32.06 ± 2.32 mm on the left side, which was not significantly different (P = 0.385).
The mean distance from the IOF to the CMP was 30.91 ± 1.50 mm in females and 32.99 ± 2.07 mm in males, which was significantly different (P < 0.001).
The mean distance from the IOF to the CMP on each side according to sex is shown in Table 4.
Table 4.
Mean IOF to CMP distance among males and females

There was no significant difference of the mean distance from the IOF to the CMP between the three age groups (ANOVA, P = 0.126).
The mean CL of the GPC for the second data group was 31.83 ± 2.36 mm (31.78 ± 2.37 mm on the right and 31.89 ± 2.36 mm on the left).
When the mean distance from the IOF to the CMP was compared with the CL, no significant difference was observed according to sex (P = 0.336), and the ICC was 0.813 with P < 0.001.
The mean CL and the mean distance from the IOF to the CMP according to sex, side, and age are shown in Tables 5–7, respectively.
Table 5.
Mean IOF to CMP distance and CL among males and females

Table 7.
Mean of IOF to CMP and CL in the three age groups
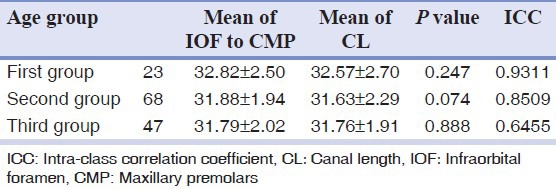
Table 6.
Mean IOF to CMP distance and CL on the right and left sides

DISCUSSION
Since the GPC technique is associated with several complications, this study was performed to determine the mean CL of the GPC and the geometric pattern of this structure, as well as to identify a reliable clinical index that can be used to estimate the mean CL for each sex and for different age groups using CBCT data.
Methathrathip, et al.[10] studied 105 dried skulls and reported that the length of the GPC and PPF from the GPF to the inferior border of the foramen rotendum ranged from 16.3 to 40.9 mm, with a mean of 29.7 ± 4.2 mm, which is consistent with the present study results (mean CL = 31.82 ± 1.37 mm). Das, et al.[11] analyzed the length of the GPC using high-resolution CT, and reported that the mean distance from the GPF to the sphenopalatine foramen was 28 ± 2 mm in men and 27 ± 2 mm in women (range, 23-33 mm). Hwang, et al. repeated the study using 3D CT scans and reported a mean height of the PPF and mean CL that were also in agreement with our findings.
However, the mean CLs reported by Douglas, et al. (40.1 mm) and McKinney, et al.[3,12] (28.75 mm) were not consistent with the present study; these differences could be explained by the small number of subjects included in the study or by differences in ethnicity.
In our study, the mean CL was higher in males than in females. Previous studies[13,14,15] on sexual dimorphism have suggested that the craniofacial complex is highly variable in both size and shape by sex, and the zygomatic curve and skull size are generally larger in males than in females. Differences in the shape of the midsagittal curve, the skull roof, the upper one-third of the face, the nose, eyes, and palate are all statistically significantly different between males and females.
Investigations of the skull base have suggested that the distance between the oval and spinosum opening on the right side and the distance between the optic canal and the rotendum opening on the left side are greater in males. The length, diameter, and angle of horizontal petrus internal carotid artery are also greater in males. Ramos, et al.[16] investigated the distance between the superior and inferior orbital foramen using surgical landmarks, and reported that the mean values of all of the measurements were higher in males.
The present study revealed a statistically significant difference between the mean CL on the right and left sides in males. Asymmetry is common in craniofacial bones. Inconsistent growth of the right and left canals could be due to genetic and/or environmental factors. Asymmetric expression of craniofacial features could be related to inheritance, the functional activity of the musculoskeletal system, or specifically to the masticatory apparatus.[17]
In the present study, the mean CL was not significantly different between the right and left sides in the first and second age groups, but a significant difference was observed in the third age group (41-77 years; P = 0.003). However, the ICC of this group was high (0.823). Therefore, the CL can be assumed to be symmetrical between sides in all of the different age groups.
In the coronal plane, the most common pathway observed was consistent with that reported by Haward-Swirzinski, et al.,[9] but this was not in agreement with the pathway they observed in the sagittal plane, which could be explained by the small number of subjects included in our study or by the differences due to ethnicity or sex.
Malamed, et al.[18] reported that the distance between the IOF and CMP was 24-41 mm (mean 32.57 mm) and Hawkins, et al.[19] reported a distance of 24-44 mm. It is generally considered to be 25-30 mm in most adults, which is consistent with our results. We also compared the mean IOF to CMP distance (31.98 ± 2.13 mm) with the mean CL (31.77 ± 2.28 mm) according to side, age, and sex. No significant differences between these two variables were observed for side, sex, or age group.
Once past age 12-13, the CL of the GPC and the distance between the GPF and sphenopalatine foramen will reach adult size. Studies have shown that the active growth phase of the midface occurs in early adolescence.[3] A study conducted by Waitzman, et al.[20] on 542 cadavers showed that 85% of the growth of the anterior cranial base is completed before age 5. Thereafter, the zygoma, orbit, and cranial bones grow gradually, stopping by age 17. In contrast, the active growth phase of the upper midface begins at age 5 and ends in mid-adolescence. After adolescence, there are minimal changes to the maxillofacial bones.[3] Therefore, the distance from the IOF to the CMP in patients with normal and healthy periodontium could be a reliable clinical index for determining the mean CL of the GPC.
A limiting factor in the present study was the small number of CBCT scans performed in Iran, and it is suggested that further studies be performed on a larger group of subjects to determine whether the results are applicable to different ethnic groups. It is also suggested that the height and volume of the PPF be compared in adults and children as well as in subjects with specific craniofacial diseases.
CONCLUSION
To prevent the complications of maxillary nerve block, 3D images of CBCT can be useful to detect precise the mean CL and its typical anatomic routes. If there is no access to CBCT data, distance from the IOF to the CMP may be a reliable clinical index to compute the CL.
Footnotes
Source of Support: This report is based on a thesis that was submitted to the School of Dentistry, Isfahan University of Medical Sciences, Isfahan, Iran, in partial fulfillment of the requirements for the MSc degree in Oral and Maxillofacial Radiology (390281 proposal code). The study was approved by the Medical Ethics and Research Office at Isfahan University of Medical Sciences and was financially supported by this University
Conflict of Interest: None declared
REFERENCES
- 1.Hwang SH, Seo JH, Joo YH, Kim BG, Cho JH, Kang JM. An anatomic study using three-dimensional reconstruction for pterygopalatine fossa infiltration via the greater palatine canal. Clin Anat. 2011;24:576–82. doi: 10.1002/ca.21134. [DOI] [PubMed] [Google Scholar]
- 2.Sved AM, Wong Head JD, Donkor P, Horan J, Rix L, Curtin J, et al. Complications associated with maxillary nerve block anaesthesia via the greater palatine canal. Aust Dent J. 1992;37:340–5. doi: 10.1111/j.1834-7819.1992.tb00758.x. [DOI] [PubMed] [Google Scholar]
- 3.McKinney KA, Stadler ME, Wong YT, Shah RN, Rose AS, Zdanski CJ, et al. Transpalatal greater palatine canal injection: Radioanatomic analysis of where to bend the needle for pediatric sinus surgery. Am J Rhinol Allergy. 2010;24:385–8. doi: 10.2500/ajra.2010.24.3496. [DOI] [PMC free article] [PubMed] [Google Scholar]
- 4.Madeira MC. 5th ed. São Paulo, Brazil: Servier; 2004. Anatomy of face; pp. 204–5. [Google Scholar]
- 5.Malamed FS. 4th ed. St. Louis: Mosby; 1997. Handbook of local anesthesia; pp. 26–7. [Google Scholar]
- 6.Malamed SF. 5th ed. St. Louis, MO: Mosby Company; 2004. Local anesthesia; pp. 202–7. [Google Scholar]
- 7.Lepere AJ. Maxillary nerve block via the greater palatine canal: New look at an old technique. Anesth Pain Control Dent. 1993;2:195–7. [PubMed] [Google Scholar]
- 8.Dalili Z, Mahjoub P, Sigaroudi AK. Comparison between cone beam computed tomography and panoramic radiography in the assessment of the relationship between the mandibular canal and impacted class C mandibular third molars. Dent Res J. 2011;8:203–10. doi: 10.4103/1735-3327.86041. [DOI] [PMC free article] [PubMed] [Google Scholar]
- 9.Haward-Swirzinski K, Edwards PC, Saini TS, Norton NS. Length and geometric patterns of the greater palatine canal observed in cone beam computed tomography. Int J Dent 2010. 2010:pii: 292753. doi: 10.1155/2010/292753. [DOI] [PMC free article] [PubMed] [Google Scholar]
- 10.Methathrathip D, Apinhasmit W, Chompoopong S, Lertsirithong A, Ariyawatkul T, Sangvichien S. Anatomy of greater palatine foramen and canal and pterygopalatine fossa in Thais: Considerations for maxillary nerve block. Surg Radiol Anat. 2005;27:511–6. doi: 10.1007/s00276-005-0016-5. [DOI] [PubMed] [Google Scholar]
- 11.Das S, Kim D, Cannon TY, Ebert CS, Jr, Senior BA. High-resolution computed tomography analysis of the greater palatine canal. Am J Rhinol. 2006;20:603–8. doi: 10.2500/ajr.2006.20.2949. [DOI] [PubMed] [Google Scholar]
- 12.Douglas R, Wormald PJ. Pterygopalatine fossa infiltration through the greater palatine foramen: where to bend the needle. Laryngoscope. 2006;116:1255–7. doi: 10.1097/01.mlg.0000226005.43817.a2. [DOI] [PubMed] [Google Scholar]
- 13.Bigoni L, Velemínská J, Brůžek J. Three-dimensional geometric morphometric analysis of cranio-facial sexual dimorphism in a Central European sample of known sex. J Comp Hum Biol. 2010;61:16–32. doi: 10.1016/j.jchb.2009.09.004. [DOI] [PubMed] [Google Scholar]
- 14.Takegosh H, Kikuchi S. An anatomic study of the horizontal petrous internal carotid artery: Sex and age differences. Auris Nasus Larynx. 2007;34:297–301. doi: 10.1016/j.anl.2007.01.007. [DOI] [PubMed] [Google Scholar]
- 15.Orish CN, Didia BC. Macrometric and micrometric study of sexual dimorphism in moramina of middle crania fossa of adult Nigerians. Int J Morphol. 2010;28:519–24. [Google Scholar]
- 16.Canovic BR, Abreu MH, Custódio AL. A morphometric analysis of supraorbital and infraorbital foramina relative to surgical landmarks. Surg Radiol Anat. 2011;33:329–35. doi: 10.1007/s00276-010-0698-1. [DOI] [PubMed] [Google Scholar]
- 17.Rossi M, Ribeiro E, Smith R. Craniofacial asymmetry in development: An anatomical study. Angle Orthod. 2003;73:381–5. doi: 10.1043/0003-3219(2003)073<0381:CAIDAA>2.0.CO;2. [DOI] [PubMed] [Google Scholar]
- 18.Malamed SF, Trieger N. Intraoral maxillary nerve block: An anatomical and clinical study. Anesth Prog. 1983;30:44–8. [PMC free article] [PubMed] [Google Scholar]
- 19.Hawkins JM, Isen D. Maxillary nerve block: The pterygopalitine canal approach. J Calif Dent Assoc. 1998;26:658–64. [PubMed] [Google Scholar]
- 20.Waitzman AA, Posnick JC, Armstrong DC, Pron GE. Craniofacial skeletal measurements based on computed tomography. Part II: Normal values and growth trends. Cleft Palate Craniofac J. 1992;29:118–28. doi: 10.1597/1545-1569_1992_029_0118_csmboc_2.3.co_2. [DOI] [PubMed] [Google Scholar]


