

Abstract
OBJECTIVE
Response Evaluation Criteria in Solid Tumors (RECIST) 1.1 has been rapidly accepted in clinical trials as a standard measure to assess tumor response to therapy and is expected to improve response assessment, especially in genomically defined patients. The impact of RECIST 1.1 was compared with RECIST 1.0 in non–small cell lung cancer (NSCLC) patients with sensitizing epidermal growth factor receptor (EGFR) mutations treated with EGFR tyrosine kinase inhibitors.
MATERIALS AND METHODS
Seventy patients with advanced NSCLC harboring sensitizing EGFR mutations treated with a first-line EGFR tyrosine kinase inhibitor were retrospectively studied. Tumor measurements and response assessment were performed using RECIST 1.0 and RECIST 1.1. The number of target lesions, the percentage change at the initial follow-up, best response, and time to progression were compared between RECIST 1.1 and RECIST 1.0.
RESULTS
The number of target lesions identified using RECIST 1.1 was significantly lower compared with that using RECIST 1.0 (mean, 2.7 and 2.0, respectively; p < 0.0001; paired Student t test), with a decrease in 31 patients (44%). The initial proportional changes of the target lesion measurements had high correlation between the two criteria (R2 = 0.8070), with concordant response assessment in 66 patients (94%). The best response showed almost perfect agreement (κw = 0.970). Time to progression (TTP) did not differ between the two criteria in 52 patients (74%), was longer by RECIST 1.1 in 15 patients (21%), and was shorter by RECIST 1.1 in three patients (4%).
CONCLUSION
RECIST 1.1 provided highly concordant response assessment with a decreased number of target lesions compared with RECIST 1.0 in advanced NSCLC patients harboring sensitizing EGFR mutations treated with an EGFR tyrosine kinase inhibitor. RECIST 1.1 altered TTP in 25% of patients compared with RECIST 1.0.
Keywords: epidermal growth factor receptor (EGFR), lung cancer, non–small cell lung cancer (NSCLC), Response Evaluation Criteria in Solid Tumors (RECIST), tumor response assessment, tyrosine kinase inhibitor
Objective assessment of tumor response to therapy is a key component of therapeutic decision making in clinical oncology practice and assessment of clinical trial endpoints [1, 2]. Radiologists play a major role in determining response, time to progression (TTP), and progression-free survival on the basis of imaging studies. The Response Evaluation Criteria in Solid Tumors (RECIST) guidelines, originally introduced in 2000, have been widely accepted and used as a standard method to assess response and define progression in cancer patients receiving anticancer therapeutic agents [1, 2]. The revised RECIST guideline (RECIST 1.1) was published in 2009 to overcome some of the limitations of the original RECIST (RECIST 1.0); RECIST 1.1 has also been quickly adapted as an updated measure to assess response and has replaced the original RECIST for defining response and progression in clinical trials [2]. The major changes in RECIST 1.1 included the reduction of the number of target lesions; methods for assessment of the size of lymph nodes; clarification of disease progression, which requires at least 20% increase and 5-mm absolute increase in size of target lesions; and inclusion of FDG PET in detection of new lesions [2, 3]. Some of these changes, such as the requirement of ≥ 5 mm increase in the size of the target lesions in addition to 20% increase, were expected to allow more clinically relevant response assessment in genomically defined subsets of patients who are treated with effective molecular targeting agents [3, 4]. In these patients, tumors initially tend to respond well to the targeted therapy and dramatically decrease in size. Therefore, a small absolute change in measurements can easily meet the 20% increase defined as progression by RECIST 1.0 even though the patients remain asymptomatic and the tumors are smaller than the baseline size. For example, a patient with a 5.0-cm lesion at baseline responds well to an effective targeted therapy and the lesion measures 1.0 cm on a follow-up study; if the lesion measures 1.2 cm on a subsequent follow-up study, the patient meets the criteria for progressive disease (PD) according to RECIST 1.0; however, a 2-mm difference in such a small lesion may well be within the measurement variability rather than true change [5]. The same patient, according to RECIST 1.1, does not meet the criteria for PD because the absolute increase in size is less than 5 mm [3, 4]. Although it has been more than 3 years from the publication of RECIST 1.1, the impact of RECIST 1.1 in genomically defined subsets of patients treated with effective targeted therapy has not been systematically studied.
Lung cancer remains the leading cause of cancer deaths in the United States and worldwide, responsible for more than 160,000 deaths in the United States each year [6, 7]. The recent major genomic discoveries of lung cancer and the clinical application of the discoveries are represented by the epidermal growth factor receptor (EGFR) tyrosine kinase inhibitor, erlotinib, recommended for non-small cell lung cancer (NSCLC) with EGFR mutations, and the anaplastic lymphoma kinase (ALK) inhibitor, crizotinib, approved for NSCLC with echinoderm microtube-associated proteinlike 4-anaplastic lymphoma kinase translocations [8, 9]. Given these discoveries, lung cancer is one of the representative solid tumors that oncologists treat with targeting agents on the basis of the specific genomic abnormalities identified within the tumor [10, 11].
In NSCLC patients with somatic sensitizing mutations in EGFR treated with EGFR tyrosine kinase inhibitors, gefitinib or erlotinib, the response rates are greater than 70%, and progression-free survival is 9.7–13.1 months [12–18]. However, all patients with an initial response eventually relapse due to the development of acquired resistance [19–23]. The assessment of response and progression by RECIST 1.1 was compared with RECIST 1.0 assessment in 43 advanced NSCLC patients treated with erlotinib in a phase II clinical trial; RECIST 1.1 assessment closely agreed with the assessment by RECIST 1.0 [4]. However, the patient population for our previous study was not genomically defined and included only three patients with known sensitizing mutation of EGFR. NSCLC patients with sensitizing EGFR mutations typically have dramatic response documented by imaging and then relapse with acquired resistance. The tumors tend to start increasing in size gradually while on a tyrosine kinase inhibitor over several months. Therefore, the subsets of NSCLC patients with EGFR mutations treated with an EGFR tyrosine kinase inhibitor are of considerable interest for evaluation of the impact of RECIST 1.1 guidelines in assessing response and defining progression.
The purpose of the current study was to compare the CT tumor measurements and response assessment according to RECIST 1.1 versus RECIST 1.0 in NSCLC patients harboring sensitizing EGFR mutations treated with EGFR tyrosine kinase inhibitor, assess the impact of RECIST 1.1 in the genomically defined subsets of NSCLC patients, and address the potential differences in response and progression assessment between the two criteria.
Materials and Methods
Patients
The original cohort included 101 consecutive patients with stage IV NSCLC (AJCC 7th edition) or stage I–IIIA NSCLC with systemic relapse and sensitizing EGFR mutations who were treated with first-line gefitinib or erlotinib as the initial systemic therapy for advanced NSCLC at the Dana-Farber Cancer Institute between February 2002 and May 2010, as described previously [24, 25].
Baseline CT and at least one follow-up CT during EGFR tyrosine kinase inhibitor therapy, performed a minimum of 4 weeks after the initiation of therapy, were available for review in 70 patients. In the remaining 31 patients, the baseline CT and/or at least one follow-up CT were not available for review, and these patients were excluded from the study. Therefore, the study population consisted of 70 advanced NSCLC patients with sensitizing EGFR mutations treated with first-line erlotinib or gefitinib at the Dana-Farber Cancer Institute.
Forty-one patients included in this study were enrolled in prospective trials of gefitinib or erlotinib in previously untreated patients with advanced NSCLC [13, 26–29]. Twenty-nine patients were treated with EGFR tyrosine kinase inhibitor as a part of the standard clinical care. The collection of clinical information on patients with somatic EGFR mutations was approved by the institutional review board at the Dana-Farber Cancer Institute.
Mutation Analysis
Tumor specimens for each patient on this study were obtained from diagnostic or surgical procedures. Samples consisted of either frozen tumor specimens or paraffin-embedded material. EGFR exons 18–21 were amplified by polymerase chain reaction and analyzed bidirectionally by direct sequencing for the presence of somatic mutations according to previously described methods [30–32].
CT Examinations
Baseline and follow-up CT studies of the chest were performed to determine response to erlotinib or gefitinib. The follow-up CT studies were performed after every 8 weeks (n = 38), every 6 weeks (n = 2), or every 12 weeks (n = 1) of therapy in 41 patients treated in the clinical trials, and according to the clinician's recommendation as clinically indicated in 29 patients treated as a part of the standard clinical care. The chest CT protocol at our institution used a 64-MDCT scanner (Aquilion 64, Toshiba America Medical Systems) or a 4-MDCT scanner (Volume Zoom, Siemens Healthcare) [4]. Patients were scanned in the supine position from the cranial to caudal direction from the clavicles to the adrenal glands at end-inspiration. During the study, 100 mL of iopromid (Ultravist 300, 300 mg I/mL, Bayer HealthCare Pharmaceuticals) was injected IV with an automated injector at a rate of 3 mL/s, with a scanning delay of 30 seconds, unless medically contraindicated. Axial images (5-mm thickness) were reconstructed using standard and lung algorithms. All images were displayed using a PACS workstation (Centricity, GE Healthcare).
CT Tumor Measurements and Response Assessment
Tumor measurements were performed by a thoracic radiologist with 7 years of experience in oncologic imaging on the baseline and the follow-up studies during EGFR tyrosine kinase inhibitor therapy using RECIST 1.0, and the response assessment category was assigned at each follow-up study using RECIST 1.0 [3, 4]. All imaging studies that included target lesions were reviewed at each follow-up for measurement. If any other imaging study that did not include target lesions was performed, such as brain MRI or 18F-FDG PET/CT, the radiology report of the study was reviewed to determine the presence of new lesions or unequivocal progression of nontarget lesions. Then, the tumor measurements using RECIST 1.0 were reviewed to generate a second set of tumor measurement tables to meet the RECIST 1.1 guidelines, and response assessment was assigned according to RECIST 1.1 at each follow-up study, as described previously [4].
The number of target lesions, sum of the longest diameters of target lesions, percentage change since the baseline, descriptions of nontarget lesions, presence or absence of new lesions, overall response at each study, and best response and TTP were recorded for each patient, according to RECIST 1.1 and RECIST 1.0 [1–4]. Best overall response was defined as the best response recorded from the start of the treatment until the end of treatment or the last follow-up, according to both RECIST 1.0 and RECIST 1.1 criteria [1, 2]. For example, a patient who had stable disease (SD) at the first assessment, partial response (PR) at the second assessment, and PD on the last assessment had a best overall response of PR [2].
The time needed to perform measurements using RECIST 1.1 versus RECIST 1.0 was studied in a randomly selected 10 patients from the cohort. The measurements were performed on baseline studies by one radiologist. Tumor tables indicated the location, description, and series and image numbers of target lesions (such as right middle lobe nodule, series 3, image 15), and the criteria that should be used for the measurement (RECIST 1.1 or 1.0). Twenty tumor tables (10 patients × two tables for each patient, one for RECIST 1.1 and the other for RECIST 1.0) were provided to the radiologist in a randomized order. The time needed for the measurements was measured and recorded using a stopwatch, starting when the scout view of the CT was displayed on the PACS workstation and ending when the radiologist completed the measurements of all target lesions on the PACS and recorded the measurements in the tumor table.
Statistical Analysis
A Wilcoxon signed rank test was used to assess the statistical significance of changes in the number of target lesions and the sum of lesion diameters at baseline between RECIST 1.1 and RECIST 1.0. The baseline CT measurements by RECIST 1.1 versus RECIST 1.0 as well as the percentage changes on the initial follow-up CT measurements compared with the baseline measurements were compared using Spearman correlation. The differences were assessed by the percentage change by RECIST 1.1 subtracted from the percentage change by RECIST 1.0 using a Wilcoxon signed rank test. A weighted kappa analysis was performed to assess the level of agreement between best responses by RECIST 1.1 versus RECIST 1.0 using quadratic weights. Quadratic weights were chosen because a difference between PR and SD is less important than a difference between SD and PD; patients remain on the trial (and on therapy) with PR or SD, whereas they are removed from the trial (and often taken off the therapy) with PD. Agreement between the two assessments was categorized as poor (weighted κ < 0), slight (weighted κ = 0–0.20), fair (weighted κ = 0.21–0.40), moderate (weighted κ = 0.41–0.60), substantial (weighted κ = 0.61–0.80), and almost perfect (weighted κ > 0.80) [33]. Time to progression according to RECIST 1.1 versus RECIST 1.0 was estimated using the Kaplan-Meier method [34]. The time needed for measurements using RECIST 1.1 versus RECIST 1.0 was compared using a Wilcoxon signed rank test. All p values are based on a two-sided hypothesis. A p value of less than 0.05 was considered significant.
Results
Baseline Patient and Disease Characteristics
Patient and disease characteristics at baseline are summarized in Table 1. Among 70 eligible patients, 58 (83%) were women, median age was 62 years (range, 35–84 years), 34 (49%) were never-smokers, 39 (56%) had distant metastasis, 36 (51%) had exon 19 deletion, and 63 (90%) were treated with erlotinib. At the time of the analysis, 57 patients experienced progression by RECIST 1.0, 44 patients had progressed by RECIST 1.1, and 40 patients had died.
TABLE 1.
Baseline Demographic and Clinical Characteristics of Patients
| Characteristics | Total (n = 70) |
|---|---|
|
| |
| Sex | |
| Female | 58 (83) |
| Male | 12 (17) |
| Age | |
| Median (range) | 62 (35–84) |
| Race | |
| White | 64 (91) |
| Asian | 4 (6) |
| Black | 2 (3) |
| Smoking statusa | |
| Never | 34 (49) |
| Former | 34 (49) |
| Current | 2 (3) |
| Pathology | |
| Adenocarcinoma | 63 (90) |
| NSCLC NOS | 7 (10) |
| Distant metastasisb | |
| Present | 39 (56) |
| Tyrosine kinase inhibitor | |
| Erlotinib | 63 (90) |
| Gefitinib | 7 (10) |
| EGFR mutation | |
| Exon 19 del | 36 (51) |
| Exon 19 del and L861Q | 1 (1) |
| L858R | 25 (36) |
| L861Q | 4 (6) |
| L861Q and G719 | 1 (1) |
| G719 | 3 (4) |
Note—Values in parenthesis are percentages unless otherwise specified. The information of race and smoking status was collected by the self-reported patient survey performed through the Clinical Research Information System (CRIS) within the Lowe Center for Thoracic Oncology at the Dana-Farber Cancer Institute [24, 25]. NSCLC = non-small cell lung cancer, NOS = not otherwise specified.
Never, fewer than 100 lifetime cigarettes; former, quit 1 year or more before start of therapy; current, smoked 1 year or less before start of therapy.
Extrathoracic metastasis at diagnosis of advanced disease.
Number of Target Lesions
The number of target lesions according to RECIST 1.1 ranged from 5 to 0 (mean, 2.0; median, 2; mode, 1), whereas the number of target lesions according to RECIST 1.0 ranged from 10 to 0 (mean, 2.7; median, 2; mode, 2), with a mean decrease of 0.76 by RECIST 1.1 compared with RECIST 1.0 (p < 0.0001, Wilcoxon signed rank test) (Fig. 1). The number of target lesions using RECIST 1.1 decreased because of the criteria for measurability of lymph nodes (a lymph node must be 15 mm in the short axis to be considered pathologically enlarged and measurable [2]) in 24 patients. The reduction of the maximum number of target lesions in RECIST 1.1 (up to 5 in total and up to 2 per organ by RECIST 1.1 compared with up to 10 in total and up to 5 per organ by RECIST 1.0) resulted in the decreased number in one patient. Six patients had a decrease in the number of target lesions because of both the lymph node criteria and the reduction of target lesions. In two patients, none of the target lesions according to RECIST 1.0 could be included as target lesions when RECIST 1.1 was used because of the revised criteria for lymph node measurability.
Fig. 1.
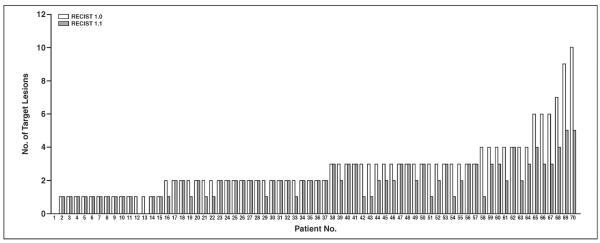
Graph shows number of target lesions according to Response Evaluation Criteria in Solid Tumors (RECIST) 1.1 versus that according to RECIST 1.0. Number of target lesions using RECIST 1.1 was significantly lower than that by RECIST 1.0 (p < 0.0001, paired Student t test).
Comparison of the Baseline Measurements
There was a high correlation between the sum of the longest diameters of target lesions on baseline scans by RECIST 1.1 and RECIST 1.0 (R2 = 0.7098, Spearman correlation) (Fig. 2). The RECIST 1.1 baseline measurements were significantly smaller than the RECIST 1.0 baseline measurements (p < 0.0001, Wilcoxon signed rank test), with a decrease in RECIST 1.1 measurements in 45 of the 70 patients (64%). The decrease in baseline measurement was caused by the decrease in the number of target lesions in 24 patients, use of short axis measurements for lymph nodes instead of the longest diameter in 13 patients, and both of these reasons in eight patients.
Fig. 2.
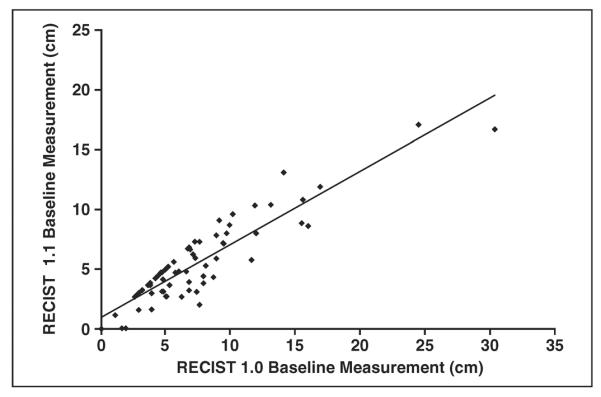
Graph shows comparison of baseline measurements according to Response Evaluation Criteria in Solid Tumors (RECIST) 1.1 versus RECIST 1.0. High correlation was observed between sum of longest diameters of target lesions on baseline scans by RECIST 1.1 and RECIST 1.0 (y = 0.6129x + 0.9513, R2 = 0.7098).
The Initial Proportional Change and the Initial Response Assessment
The initial proportional changes of the sums of the diameters of the target lesions were not significantly different between RECIST 1.1 and RECIST 1.0 (p = 0.29, Wilcoxon signed rank test) in 67 patients with at least one target lesion with both criteria, with a high correlation (R2 = 0.8070, Spearman correlation) (Fig. 3A) and a mean difference of 1.5% (range, −13% to 37%). The initial response category was concordant in 66 patients (94%) and was different in four patients (6%) between RECIST 1.1 versus RECIST 1.0 (Fig. 3A). Three patients were categorized as PR by RECIST 1.1 and as SD by RECIST 1.0 (patients 11, 15, and 30 in Fig. 3B), and one patient categorized as SD by RECIST 1.1 had a PR to therapy assessed by RECIST 1.0 (patient 31 in Fig. 3B). The difference in initial response assessment was caused by a decrease in the number of target lesions according to RECIST 1.1 in two patients (patients 15 and 31 in Fig. 3B) and the use of the short-axis measurements by RECIST 1.1 in two patients (patients 11 and 30 in Fig. 3B). Although the percentage changes in measurements of target lesions at the first follow-up in all 70 patients fell in the response category of PR or SD by both criteria, the overall assessment was PD by both RECIST 1.1 and 1.0 in one patient because of the appearance of a new lesion noted at the first follow-up CT (Fig. 3, patient 3).
Fig. 3.

Comparison of initial proportional changes of sum of diameters of target lesions according to Response Evaluation Criteria in Solid Tumors (RECIST) 1.1 versus RECIST 1.0.
A, Scatterplot of initial proportional changes of sum of diameters of target lesions by two criteria shows significant correlation (y = 0.9623x − 2.6233, R2 = 0.8070). Response assessment according to RECIST 1.1 was discordant with that according to RECIST 1.0 in four patients (circles). In one patient with percentage measurement changes in stable disease (SD) category, overall assessment was progressive disease (PD) by both RECIST 1.1 and 1.0 due to appearance of new lesion (triangle).
B, Initial proportional changes of sum of diameters of target lesions by two criteria in each patient are ranked by changes according to RECIST 1.0. Three patients were categorized as partial response (PR) by RECIST 1.1 and SD by RECIST 1.0 (patients 11, 15, and 30) (arrows). One patient was categorized as SD by RECIST 1.1 but as PR by RECIST 1.0 (patient 31) (asterisk). Patient 3 (triangle) had overall assessment of PD due to new lesion even though response assessment of target lesions was SD.
The Best Response by RECIST 1.1 and RECIST 1.0
The best response assessment using RECIST 1.1 was concordant with the best response using RECIST 1.0 in 69 patients (99%), with weighted kappa values of 0.970 (Table 2). In one patient, the best response was PR by RECIST 1.1; however, the response was SD by RECIST 1.0 because of a difference in measurements resulting from the decreased number of target lesions according to RECIST 1.1.
TABLE 2.
Best Response by Response Evaluation Criteria in Solid Tumors (RECIST) 1.1 Versus RECIST 1.0
| RECIST 1.1 |
||||
|---|---|---|---|---|
| RECIST 1.0 | PR | SD | PD | Total |
|
| ||||
| PR | 50 | 0 | 0 | 50 |
| SD | 1 | 18a | 0 | 19 |
| PD | 0 | 0 | 1 | 1 |
|
| ||||
| Total | 51 | 18 | 1 | 70 |
Note—κw = 0.970. PR = partial response, SD = stable disease, PD = progressive disease.
Includes three patients with response assessment based on nontarget lesions alone, designated as “non-CR/non-PD” because the radiographic findings of nontarget lesions in these patients were equivalent to SD. One patient had only nontarget lesions by RECIST 1.0 and RECIST 1.1, which were stable during the course of therapy. Two patients had target lesions by RECIST 1.0 with the best response of SD, but they did not have target lesions by RECIST 1.1 because of the lymph node criteria; their nontarget lesions showed no significant change during therapy.
Time to Progression by RECIST 1.1 and RECIST 1.0
Figure 4 shows the TTP according to RECIST 1.1 versus TTP by RECIST 1.0. The median TTP according to RECIST 1.1 (TTP 1.1) was 10.8 months, and the median TTP according to RECIST 1.0 (TTP 1.0) was 9.6 months. TTP 1.1 and TTP 1.0 were the same in 41 patients (59%). TTP 1.1 was longer than TTP 1.0 in 15 patients (21%) because of the difference in the target lesion measurements in 11 patients and the new requirement of 5-mm absolute increase in size in four patients. TTP 1.1 was shorter than TTP 1.0 in three patients (4%) because of the difference in target lesion measurements in two patients and a new lesion noted on FDG PET/CT in one patient. Eleven patients (16%) did not meet the criteria for PD according to RECIST 1.1 or RECIST 1.0 at the last follow-up study.
Fig. 4.
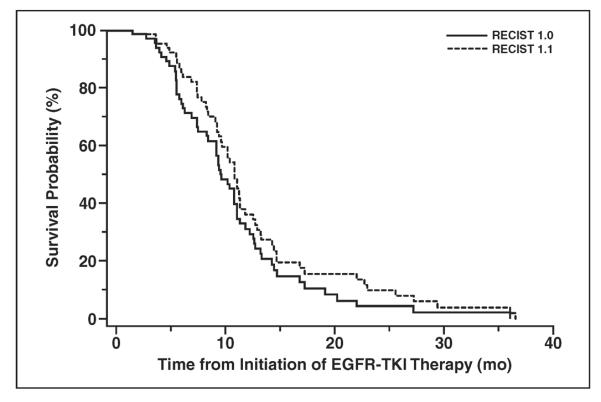
Graph shows time to progression by Response Evaluation Criteria in Solid Tumors (RECIST) 1.1 versus RECIST 1.0. EGFR = epidermal growth factor receptor, TKI = tyrosine kinase inhibitor.
Role of FDG PET
FDG PET/CT was not routinely performed as a part of the assessment of response and progression in this study cohort. FDG PET/CT was performed during therapy in 10 patients (14%) and changed the TTP in one patient according to RECIST 1.1 compared with RECIST 1.0. This patient did not undergo baseline PET, and a new lesion noted on PET/CT performed during therapy. The new lesion was confirmed by the follow-up CT, and the date of PET was assigned as the PD date according to RECIST 1.1 [2], resulting in shorter TTP 1.1 compared with TTP 1.0.
Time Needed for Tumor Measurement
In a randomly selected subset of 10 patients, the time needed for RECIST 1.1 measurement was significantly shorter than the time needed for RECIST 1.0 measurement (median, 18 seconds vs 30 seconds, respectively; p = 0.008, Wilcoxon signed rank test).
Discussion
The current study of response assessment in 70 NSCLC patients with sensitizing EGFR mutations treated with an EGFR tyrosine kinase inhibitor using RECIST 1.1 showed that RECIST 1.1 provided equivalent response assessment compared with RECIST 1.0 with a decreased number of target lesions. The new criteria for progression for target lesions (at least 5-mm increase in addition to 20% increase) and the inclusion of FDG/PET for new lesions changed TTP in a minority of patients. To our knowledge, this is the first report that has evaluated the impact of RECIST 1.1 in genomically defined subsets of NSCLC patients treated with molecular targeting therapy.
Since the initial introduction in 2000, the RECIST guideline has been widely adopted as a standard measure for response and progression assessment [1, 2]. Prior studies have shown that one-dimensional measurements used in RECIST are more reproducible than bidimensional measurements used in the World Health Organization (WHO) criteria [5, 11]. It has also been shown that the revised RECIST 1.1 has smaller measurement variability compared with RECIST 1.0 [4]. RECIST 1.1 also includes new revisions to better define progression and more accurately assess changes in tumor burden than RECIST 1.0, such as requirement of a 5-mm absolute increase for target lesions and inclusion of PET for new lesions [1–3]. Given these backgrounds and the recent clinical application of effective molecular targeted therapy in genomically defined subsets of NSCLC patients whose tumors dramatically respond to therapy on imaging, the radiologic study of the impact of RECIST 1.1 on tumor measurement and response assessment in EGFR-mutant NSCLC patients were deemed to be important.
The high prevalence of the women (83%) in the study cohort was expected given that female sex is associated with EGFR mutations and sensitivity to gefitinib and erlotinib [8, 10, 35]. Clinical predictors of response to gefitinib and erlotinib include female sex, nonsmoker status, Asian ethnicity, and adenocarcinoma histology [8, 10]. One of the prospective trials included in the study was a phase II trial of erlotinib in chemotherapy-naive women with advanced pulmonary adenocarcinoma. The trial provided 26 women in the current study cohort [26], which also contributed the high prevalence of women.
The number of target lesions was significantly lower when RECIST 1.1 was used compared with RECIST 1.0. The most common reason for the decrease in number of target lesions was the new criteria for the measurability for lymph nodes, which is consistent with our previous report in 43 advanced NSCLC patients treated with erlotinib [4]. The result is also concordant with other reports; in a study of 104 NSCLC patients treated with EGFR tyrosine kinase inhibitors by Sun et al. [36], the lymph node measurement guidelines by RECIST 1.1 resulted in a decrease in the number of target lesions, although their report did not describe the number of lesions that were assessed as nonmeasurable by RECIST 1.1. In a study of prostate cancer by Piatek et al. [37], among 75 lymph nodes considered as target lesions by RECIST 1.0, only 25 (33.4%) were greater than 1.5 cm in the short axis and were considered abnormal by RECIST 1.1.
In two patients (3%) included in the current study, all the target lesions by RECIST 1.0 were lymph nodes less than 15 mm in the short axis and therefore did not meet the criteria for target lesions by RECIST 1.1. These patients would likely be excluded from a clinical trial if the trial uses RECIST 1.1 and requires a measurable lesion for eligibility criteria. The result indicates that the revisions in RECIST 1.1 can potentially alter the eligibility of patients for clinical trial enrollment, as observed in our prior study, in which three of 43 (7%) patients lost their target lesions because of the revised criteria for lymph node measurability [4].
The response assessment at the first follow-up study was concordant between RECIST 1.1 and RECIST 1.0 except for four patients. The results are consistent with prior reports, including our previous study of RECIST 1.1 and 1.0 in advanced NSCLC [4] and the study by Zacharia et al. [38], which showed high agreement between response assessments using multiple-lesion versus single-lesion measurements in metastatic colon cancer patients. In four patients with discordant assessment, the discordance was between PR or SD, which is not a clinically significant difference because the patients will traditionally stay on the same therapy (and will remain on the trial if they were treated in clinical trials) as long as the assessment is PR or SD and not PD. Similarly, the best response showed almost perfect agreement between the two criteria, and the discordance was only between PR and SD and did not involve the PD category. Therefore, the clinical impact of RECIST 1.1 in defining the initial response and best response was minimal, especially in terms of changing therapeutic decisions. The results have a slightly different clinical implication compared with our previous report, which also showed overall perfect agreement in best response assessment [4]; in our previous study, three of 43 patients had a different best response between the two criteria and the discordance was PD versus SD in all three patients, which would have impacted the clinical decisions, including therapy continuation as well as allowance to remain on a trial [4].
In contrast to the studies of genomically unselected cohorts, in which 35–40% of the patients had PD as the best response by both criteria [4, 36], there was only one patient with PD for the best response in the current study. The results represent the distinct difference in the response rate to EGFR tyrosine kinase inhibitors between the genomically defined cohort with EGFR mutation and those without [12–18], indicating a need for therapy-specific and cohort-specific criteria for state-of-the-art response assessment in the era of personalized cancer care [39].
TTP did not differ in 52 patients (74%) by both criteria. Of 15 patients with longer TTP 1.1 than TTP 1.0, the most common reason was the difference in the target lesion measurements caused by the revised lymph node criteria and the reduction of the number of target lesions. The new criteria for progression of target lesions (at least 5-mm absolute increase in size in addition to 20% increase) made TTP 1.1 longer than TTP 1.0 in only four patients (6%). Similarly, in the study of RECIST 1.1 by Sun et al. [36] in 104 NSCLC patients treated with gefitinib or erlotinib, TTP differed between the two criteria in only five patients (three with longer TTP and two with shorter TTP by RECIST 1.1), with the 5-mm criteria making TTP 1.1 longer only in one patient.
The results of TTP are different from our initial expectation that the 5-mm requirement is likely to prolong TTP in the majority of EGFR-mutant NSCLC patients with initial dramatic response to EGFR tyrosine kinase inhibitors [3]. One of the several possible reasons is that the smallest target lesion diameters in our population are often greater than 2.5 cm even after the initial dramatic response, as noted in 33 of 67 patients (49%) with target lesions by RECIST 1.1. When the smallest target lesion measurement is 2.5 cm or larger, at least 20% increase in size also results in at least a 5-mm increase. In four patients whose TTP 1.1 was longer than TTP 1.0 because of the 5-mm requirement, the smallest target lesion measurements ranged from 0.8 to 1.6 cm. Thus, the at least 20% increase did not necessarily satisfy the 5-mm absolute increase. In 30 patients with the smallest target lesion measurement less than 2.5 cm, a 5-mm or greater increase was observed at the same time when a 20% or greater increase was first noted. For example, in one patient whose target lesion measured 2.0 cm at the nadir, it measured 2.6 cm on the follow-up, meeting ≥ 20% and ≥ 5 mm increase, which resulted in the same TTP 1.1 and TTP 1.0. In a case such as this, the lesion may be growing fast enough or the interval of follow-up studies may be too long to catch the situation in which the 5-mm requirement makes difference. The cutoff value of 5 mm may be too small to make a significant impact in response assessment in this population; however, larger systematic studies are needed to come up with an alternate number with clinical benefit. Although the concordance and accuracy of response assessment were studied using RECIST 1.1 [36], radiologic studies of the detailed measurements with the passage of time have not been performed.
In one patient, the criteria for PD were met by a 20% or greater increase (but less than 5-mm increase) of target lesion measurement as well as appearance of a new lesion by RECIST 1.0; the date of PD by RECIST 1.1 did not differ from that by RECIST 1.0 because of the appearance of a new lesion, regardless of the fact that target lesion did not show ≥ 5 mm absolute increase. This example represents one of the practical features of RECIST guidelines, which do not rely on the measurements alone and try to evaluate the systemic behavior of the tumor [1–3].
We also showed that RECIST 1.1 measurements required significantly less time compared with RECIST 1.0 measurements in a subset of patients, which implies that RECIST 1.1 may contribute to a time-saving in the work-flow, showing another advantage of the usage of RECIST 1.1, especially in clinical practice. It should be noted that the times measured in the current study included the time solely for performing unidimensional measurements of target lesions and recording the measurements and did not include time for other tasks, such as identifying and selecting target and nontarget lesions, detecting new lesions, summing the measurements, calculating the percentage changes, and assigning the response. We designed the study this way because our aim was to assess the time difference derived from the use of RECIST 1.1 versus RECIST 1.0, and the time for the other tasks was unlikely to be affected by the use of RECIST 1.1 versus RECIST 1.0. Therefore, the data, especially the absolute values of the time needed for measurement, should be interpreted in the context of the study design.
It is expected that the reduction of the number of target lesions by RECIST 1.1 may result in higher reproducibility of measurements compared with RECIST 1.0. Our previous study in advanced NSCLC patients has shown that RECIST 1.1 measurements were more reproducible, with narrower 95% limits of interobserver agreement (−18.6% to 25.4%) compared with that of RECIST 1.0 measurements (−30.8% to 30.4%), suggesting that the use of RECIST 1.1 may improve the reproducibility of tumor measurements and contribute to adequate response assessment by reflecting the true changes of tumor size, rather than changes due to measurement variability [4]. The constellation of the findings in our current and previous studies indicates that RECIST 1.1 provides response assessment that is highly concordant with RECIST 1.0, with a reduced number of target lesions, shorter time, and higher reproducibility.
The limitations of the current study include retrospective design and a relatively small number of patients treated at a single institution. A small number of patients underwent PET/CT during therapy, which limited the assessment of the impact of PET in detecting new lesions according to RECIST 1.1.
In conclusion, RECIST 1.1 guidelines provided highly concordant response assessment with a decreased number of target lesions compared with RECIST 1.0 in advanced NSCLC patients with EGFR-sensitizing mutations treated with targeted therapy. RECIST 1.1 resulted in alteration of TTP in 25% of the patients, mostly due to differences in measurements; the new requirement of a 5-mm absolute increase in size or inclusion of FDG PET affected a minority of patients. Further studies of tumor growth with time passage may help to identify the most optimal cutoff value to define progression in the subsets of EGFR-mutant NSCLC patients treated with EGFR tyrosine kinase inhibitors.
Acknowledgments
M. Nishino was supported by grant 1K23CA157631from the National Cancer Institute. B. E. Johnson and P. A. Jänne were supported by grant 1RO1CA114465-01 from the National Institutes of Health and grant 2P50CA090578-06 from the National Cancer Institute Specialized Program of Research Excellence in Lung Cancer as well as grants from Genentech and the Doris and William Krupp Research Fund in Thoracic Oncology and American Society of Clinical Oncology Translational Research Professorship. H. Hatabu was supported by grant 5R21 CA11627-02 from the National Institutes of Health.
References
- 1.Therasse P, Arbuck SG, Eisenhauer EA, et al. New guidelines to evaluate the response to treatment in solid tumors: European Organization for Research and Treatment of Cancer, National Cancer Institute of the United States, National Cancer Institute of Canada. J Natl Cancer Inst. 2000;92:205–216. doi: 10.1093/jnci/92.3.205. [DOI] [PubMed] [Google Scholar]
- 2.Eisenhauer EA, Therasse P, Bogaerts J, et al. New response evaluation criteria in solid tumors: revised RECIST guideline (version 1.1) Eur J Cancer. 2009;45:228–247. doi: 10.1016/j.ejca.2008.10.026. [DOI] [PubMed] [Google Scholar]
- 3.Nishino M, Jagannathan JP, Ramaiya N, Van den Abbeele AD. Revised RECIST guideline version 1.1: what oncologists want to know and what radiologists need to know. AJR. 2010;195:281–289. doi: 10.2214/AJR.09.4110. [DOI] [PubMed] [Google Scholar]
- 4.Nishino M, Jackman DM, Hatabu H, et al. New Response Evaluation Criteria in Solid Tumors (revised RECIST guideline, version 1.1) in advanced non–small-cell lung cancer: comparison with the original RECIST (version 1.0) and its impact on assessment of tumor response to therapy. AJR. 2010;195 doi: 10.2214/AJR.09.3928. [web]W221W228. [DOI] [PMC free article] [PubMed] [Google Scholar]
- 5.Zhao B, James LP, Moskowitz CS, et al. Evaluating variability in tumor measurements from same-day repeat CT scans of patients with non-small cell lung cancer. Radiology. 2009;252:263–272. doi: 10.1148/radiol.2522081593. [DOI] [PMC free article] [PubMed] [Google Scholar]
- 6.Siegel R, Naishadham D, Jemal A. Cancer statistics, 2012. CA Cancer J Clin. 2012;62:10–29. doi: 10.3322/caac.20138. [DOI] [PubMed] [Google Scholar]
- 7.American Cancer Society website [Accessed March 6, 2013];Cancer facts and figures. 2012 www.cancer.org/acs/groups/content/@epidemiologysurveilance/documents/document/acspc-031941.pdf.
- 8.Gazdar AF. Personalized medicine and inhibition of EGFR signaling in lung cancer. N Engl J Med. 2009;361:1018–1020. doi: 10.1056/NEJMe0905763. [DOI] [PMC free article] [PubMed] [Google Scholar]
- 9.Kwak EL, Bang YJ, Camidge DR, et al. Anaplastic lymphoma kinase inhibition in non–small-cell lung cancer. N Engl J Med. 2010;363:1693–1703. doi: 10.1056/NEJMoa1006448. [DOI] [PMC free article] [PubMed] [Google Scholar]
- 10.Nishino M, Jackman DM, Hatabu H, Johnson BE, Van den Abbeele AD. Imaging of lung cancer in the era of molecular medicine. Acad Radiol. 2011;18:424–436. doi: 10.1016/j.acra.2010.10.020. [DOI] [PMC free article] [PubMed] [Google Scholar]
- 11.Nishino M, Guo M, Jackman DM, et al. CT tumor volume measurement in advanced non-small-cell lung cancer: performance characteristics of emerging clinical tool. Acad Radiol. 2011;18:54–62. doi: 10.1016/j.acra.2010.08.021. [DOI] [PMC free article] [PubMed] [Google Scholar]
- 12.van Zandwijk N, Mathy A, Boerrigter L, et al. EGFR and KRAS mutations as criteria for treatment with tyrosine kinase inhibitors: retro- and prospective observations in non-small-cell lung cancer. Ann Oncol. 2007;18:99–103. doi: 10.1093/annonc/mdl323. [DOI] [PubMed] [Google Scholar]
- 13.Sequist LV, Martins RG, Spigel D, et al. First-line gefitinib in patients with advanced non-small-cell lung cancer harboring somatic EGFR mutations. J Clin Oncol. 2008;26:2442–2449. doi: 10.1200/JCO.2007.14.8494. [DOI] [PubMed] [Google Scholar]
- 14.Jackman DM, Yeap BY, Sequist LV, et al. Exon 19 deletion mutations of epidermal growth factor receptor are associated with prolonged survival in non-small cell lung cancer patients treated with gefitinib or erlotinib. Clin Cancer Res. 2006;12:3908–3914. doi: 10.1158/1078-0432.CCR-06-0462. [DOI] [PubMed] [Google Scholar]
- 15.Mok TS, Wu YL, Thongprasert S. Gefitinib or carboplatin-paclitaxel in pulmonary adenocarcinoma. N Engl J Med. 2009;361:947–957. doi: 10.1056/NEJMoa0810699. [DOI] [PubMed] [Google Scholar]
- 16.Maemondo M, Inoue A, Kobayashi K, et al. Gefitinib or chemotherapy for non-small-cell lung cancer with mutated EGFR. N Engl J Med. 2010;362:2380–2388. doi: 10.1056/NEJMoa0909530. [DOI] [PubMed] [Google Scholar]
- 17.Zhou C, Wu YL, Chen G, et al. Erlotinib versus chemotherapy as first-line treatment for patients with advanced EGFR mutation-positive non-small-cell lung cancer (OPTIMAL, CTONG-0802): a multicentre, open-label, randomised, phase 3 study. Lancet Oncol. 2011;12:735–742. doi: 10.1016/S1470-2045(11)70184-X. [DOI] [PubMed] [Google Scholar]
- 18.Rosell R, Carcereny E, Gervais R, et al. Erlotinib versus standard chemotherapy as first-line treatment for European patients with advanced EGFR mutation-positive non-small-cell lung cancer (EURTAC): a multicentre, open-label, randomised phase 3 trial. Lancet Oncol. 2012;13:239–246. doi: 10.1016/S1470-2045(11)70393-X. [DOI] [PubMed] [Google Scholar]
- 19.Pao W, Miller VA, Politi KA, et al. Acquired resistance of lung adenocarcinomas to gefitinib or erlotinib is associated with a second mutation in the EGFR kinase domain. PLoS Med. 2005;2:e73. doi: 10.1371/journal.pmed.0020073. [DOI] [PMC free article] [PubMed] [Google Scholar]
- 20.Engelman JA, Zejnullahu K, Mitsudomi T, et al. MET amplification leads to gefitinib resistance in lung cancer by activating ERBB3 signaling. Science. 2007;316:1039–1043. doi: 10.1126/science.1141478. [DOI] [PubMed] [Google Scholar]
- 21.Kobayashi S, Boggon TJ, Dayaram T, et al. EGFR mutation and resistance of non-small-cell lung cancer to gefitinib. N Engl J Med. 2005;352:786–792. doi: 10.1056/NEJMoa044238. [DOI] [PubMed] [Google Scholar]
- 22.Sequist LV, Waltman BA, Dias-Santagata D, et al. Genotypic and histological evolution of lung cancers acquiring resistance to EGFR inhibitors. Sci Transl Med. 2011;23:75ra26. doi: 10.1126/scitranslmed.3002003. [DOI] [PMC free article] [PubMed] [Google Scholar]
- 23.Arcila ME, Oxnard GR, Nafa K, et al. Rebiopsy of lung cancer patients with acquired resistance to EGFR inhibitors and enhanced detection of the T790M mutation using a locked nucleic acid-based assay. Clin Cancer Res. 2011;17:1169–1180. doi: 10.1158/1078-0432.CCR-10-2277. [DOI] [PMC free article] [PubMed] [Google Scholar]
- 24.Heon S, Yeap BY, Britt GJ, et al. Development of central nervous system metastases in patients with advanced non-small cell lung cancer and somatic EGFR mutations treated with gefitinib or erlotinib. Clin Cancer Res. 2010;16:5873–5882. doi: 10.1158/1078-0432.CCR-10-1588. [DOI] [PMC free article] [PubMed] [Google Scholar]
- 25.Heon S, Yeap BY, Lindeman NI, et al. The impact of initial gefitinib or erlotinib versus chemotherapy on central nervous system progression in advanced non-small cell lung cancer with EGFR mutations. Clin Cancer Res. 2012;18:4406–4414. doi: 10.1158/1078-0432.CCR-12-0357. [DOI] [PMC free article] [PubMed] [Google Scholar]
- 26.Jackman DM, Cioffredi LA, Lindeman N, et al. Phase II trial of erlotinib in chemotherapy-naïve women with advanced pulmonary adenocarcinoma. J Clin Oncol. 2009;27(suppl):15s. abstr 8065. [Google Scholar]
- 27.Jackman DM, Yeap BY, Lindeman NI, et al. Phase II clinical trial of chemotherapy-naive patients ≤ 70 years of age treated with erlotinib for advanced non-small-cell lung cancer. J Clin Oncol. 2007;25:760–766. doi: 10.1200/JCO.2006.07.5754. [DOI] [PubMed] [Google Scholar]
- 28.Jänne PA, Gurubhagavatula S, Yeap BY, et al. Outcomes of patients with advanced non-small cell lung cancer treated with gefitinib (ZD1839, “Iressa”) on an expanded access study. Lung Cancer. 2004;44:221–230. doi: 10.1016/j.lungcan.2003.12.014. [DOI] [PubMed] [Google Scholar]
- 29.Jänne PA, Wang XF, Socinski MA, et al. Randomized phase III trial of erlotinib (E) alone or in combination with carboplatin/paclitaxel (CP) in never or light former smokers with advanced lung adenocarcinoma: CALGB 30406. J Clin Oncol. 2010;28(suppl):15s. doi: 10.1200/JCO.2011.40.1315. abstr 7503. [DOI] [PMC free article] [PubMed] [Google Scholar]
- 30.Lynch TJ, Bell DW, Sordella R, et al. Activating mutations in the epidermal growth factor receptor underlying responsiveness of non-small-cell lung cancer to gefitinib. N Engl J Med. 2004;350:2129–2139. doi: 10.1056/NEJMoa040938. [DOI] [PubMed] [Google Scholar]
- 31.Paez JG, Jänne PA, Lee JC, et al. EGFR mutations in lung cancer: correlation with clinical response to gefitinib therapy. Science. 2004;304:1497–1500. doi: 10.1126/science.1099314. [DOI] [PubMed] [Google Scholar]
- 32.Jackman D, Pao W, Riely GJ, et al. Clinical definition of acquired resistance to epidermal growth factor receptor tyrosine kinase inhibitors in non-small-cell lung cancer. J Clin Oncol. 2010;28:357–360. doi: 10.1200/JCO.2009.24.7049. [DOI] [PMC free article] [PubMed] [Google Scholar]
- 33.Kundel HL, Polansky M. Measurement of observer agreement. Radiology. 2003;228:303–308. doi: 10.1148/radiol.2282011860. [DOI] [PubMed] [Google Scholar]
- 34.Kaplan EL, Meier P. Nonparametric estimation from incomplete observations. J Am Stat Assoc. 1958;53:457–481. [Google Scholar]
- 35.Herbst RS, Heymach JV, Lippman SM. Lung cancer. N Engl J Med. 2008;359:1367–1380. doi: 10.1056/NEJMra0802714. [DOI] [PMC free article] [PubMed] [Google Scholar]
- 36.Sun JM, Ahn MJ, Park MJ, et al. Accuracy of RECIST 1.1 for non-small cell lung cancer treated with EGFR tyrosine kinase inhibitors. Lung Cancer. 2010;69:105–109. doi: 10.1016/j.lungcan.2009.09.014. [DOI] [PubMed] [Google Scholar]
- 37.Piatek CI, Desai BB, Wei-Tsao D, et al. RECIST 1.0 versus 1.1: implications for trial interpretation and design in advanced prostate cancer. J Clin Oncol. 2011;29(suppl) abstr 2563. [Google Scholar]
- 38.Zacharia TT, Saini S, Halpern EF, Sumner JE. CT of colon cancer metastases to the liver using modified RECIST criteria: determining the ideal number of target lesions to measure. AJR. 2006;186:1067–1070. doi: 10.2214/AJR.05.0038. [DOI] [PubMed] [Google Scholar]
- 39.Nishino M, Jagannathan JP, Krajewski KM, et al. Personalized tumor response assessment in the era of molecular medicine: cancer-specific and therapy-specific response criteria to complement pitfalls of RECIST. AJR. 2012;198:737–745. doi: 10.2214/AJR.11.7483. [DOI] [PMC free article] [PubMed] [Google Scholar]